适用于MetaTrader 5的付费EA交易和指标 - 98
This is a modern MACD indicator based on regular MACD indicator. It also has alert system included. This indicator gives you alerts when base line of MACD indicator crosses above or below Zero level so you can look for Buy or Sell opportunity. Available Alerts: 1. Audible Alerts on Chart / Trading Terminal window. 2. Alerts on your email. 3. Alerts on your mobile phone. Type of Alerts Explained: 1. Audible_Chart_Alerts - Audible alerts and Popup message on your computer’s tr

Here is a powerful trading tool that will allow you to trade manually or automatically in any market, but is especially useful in markets with high volatility and liquidity.
This system has two EAs (Expert Advisors): one for Buy and one for Sell, which work independently. The operation is based on the hedging strategy and the increase in lots based on the Fibonacci sequence, which will allow you to always add the two previous lots: 1, 2, 3, 5, 8, 13...
You decide how you want to trade: you ca

请仅针对以下 7 种货币对设置 Slick Extractor 交易机器人:EURUSD、GBPUSD、GBPAUD、USDCHF、USDJPY、CADCHF 和 CADJPY。
图表上的交易时间范围应严格为 4 小时 (H4)。
请将输入设置中的“Auto lot size”更改为“True”,这非常重要,这将使 EA 计算每笔交易的最佳手数,这样 EA 的风险就不会超过默认的 2%每笔交易的净值。如果自动手数保持为假,则每个货币对的默认手数为最小手数 (0.01)。
要增加自动计算的手数,只需将“每笔交易的风险”增加到不超过 6% (0.06) 以实现良好的风险管理。每笔交易的风险以权益的百分比表示,例如默认值为权益的 2% (0.02)。此处应格外小心。
在输入设置中调整时差以匹配您经纪商的交易时间。例如,由于时区差异,如果您的经纪人的时间比本地计算机或机器人将运行的 VPS 早 2 小时,则将“时间差异”更改为 2。如果您的经纪人的时间比本地计算机或 VPS 晚 2 小时机器人将运行的 VPS,然后将“时差”更改为 -2。这非常重要,如果做得不正确,可能会降低机器人的

it depends on channels and moving average in sketching the chart in two colors the default colors are gold and light blue to highlight the area of downtrend and the area of uptrend TO ADJUST THE INDICATOR YOU CAN CHNGE THE FOLLOWING: 1- the look back period which affects the length of the moving average 2- the multiplier which affects the point of swing in the trend 3- the channel shift which affects how close the line is moving to the price the default settings are the best for the indicator B

ACL GOLD is a complete automated expert advisor for trading on Gold/USD market. Price domain has been predicted by logical equations and calculations that provide a reasonable and reliable trend and consider the dynamic momentum to take positions. ACL GOLD brings safe position management with low risk trades to keep user properties safe and makes minimum loss. At the same time profits levels could be developed on the trades at any tikes of market to catch any opportunities. It must be noticed t
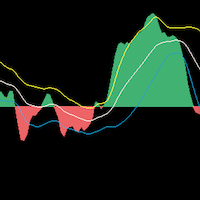
TradingDirection是一个针对中长线交易的趋势指标。在图上你能很清晰的看到什么时候是上涨趋势,什么时候是下跌趋势,同时在趋势中,你能看到很明显的补仓位置和减仓位置。同时它与 BestPointOfInitiation( https://www.mql5.com/zh/market/product/96671 )指标可以形成完美的配合,两个指标相互配合更能很好的把握开单时机。 ===================参数列表===================== fastPeriod: 9 slowPeriod:30 PassivationCoefficient:5 =================参考使用方法=================== 此指标可以适用于任何交易品种,能够用在任何周期。

The Imbalance Market is a multi-pair, multi-order and multi-lot product. It is designed to operate on 4 pairs: EURUSD, GBPUSD, USDJPY and USDCHF, it is optimized and designed for these four values, not being recommended for use in others. You can use other robots on your platform, but I do not recommend that you use it in these pairs at the same time as this robot.
This system detects when the market is unbalanced and operates in favor of equilibrium, that is, it detects a pair's uneven movement
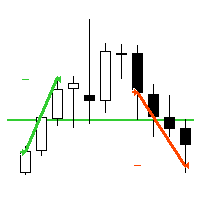
"AV Level EA MT5 Full" is an Expert Advisor for the MetaTrader 5, which is intended exclusively for the german DAX (DE40, GE40, etc.) and is also available as a free version with MinLot to try out.
NEW: More ways to close, third entry, MagicNr adjustable.
Strategy:
- Level Trading, DAX M15 (also M5 or M30)
- Entry: Buy level 75, sell level 25
- Exits: TP = 25 (i.e. approx. 00 level) or TP = 50 (buy 75 level, sell 25 level)
- Second entry in the event of a reset, distance e.g. 25 or 50 (it

The FxCruiser trading robot is a highly advanced trading tool that utilizes artificial intelligence to accurately predict market movements. Designed specifically to trade in the EURUSD and GBPUSD markets, it boasts an exceptional rate of return that is unmatched by any other trading robot. With its unique features and unparalleled performance, FxCruiser has established itself as the top trading robot in the industry.

My Expert Advisor trade Gold (XAUUSD) on M1 time frame, Base on special hedging strategy. stop loss 0.27 usd/0.01 lot take profit 3.9 usd/0.01 lot (increase if u want more profit) Recommend broker: Exness, 5 digit broker, stoploss = 270; takeprofit = 3900; If 3 diggit broker, stoploss = 27; takeprofit = 390; Min deposit: from 500 usd - From 500 usd to 140.000 usd after more than 01 year (backtest) Input Setting to test my EA: - Stoploss: 0.27 usd/0.01 lot (adjust to the correct ratio

it depends on ATR period to get swing points to help make better trading decisions blue dot and red dot is the default color scheme of course you can change it later if you'd like you can change the following : ATR PERIOD sending notifications number of times to send notifications sending notifications to your smart phone that's it very simple to use just drag and drop and follow the trend

BestPointOfInitiation是一个很好的短线交易指示器,能与 ShortBS ( https://www.mql5.com/zh/market/product/96796 )完美的配合,可以很好的指出最佳的buy和sell位置,指标不含有未来函数,不会重新绘制,不仅能够应用到自己的手动交易过程中,还能完全可以写入到自己的EA中。(如果你感觉到这个指标能够帮助你进行更准确的交易,请帮忙给个好评,希望我的作品能够帮助更多多有需要的人) ===================参数列表===================== fastPeriod: 9 slowPeriod:30 PassivationCoefficient:5 =================参考使用方法=================== 此指标可以适用于任何交易品种,能够用在任何周期。

您必须有兴趣制作自己的专家和优化。 这不带有设置文件。 增强您自己的交易能力,利用基因优化测试仪的力量。
Alpha Generation 使用一组技术指标,包括 Awesome Oscillator、Bulls Power、Commodity Channel Index、Envelopes、Moving Average Convergence Divergence、Moving Average、Parabolic SAR、Relative Strength Index、Stochastic Oscillator 和 Williams Percent Range 来生成交易信号。
EA 还包括一个固定保证金资金管理系统,它根据账户余额的百分比确定头寸的大小。 该代码包括每个输入参数的详细注释,用户可以自定义这些注释以使 EA 适应他们的特定交易策略。 指标的不同组合可以产生无穷无尽的信号。
如何使用:
选择要执行的优化并在测试器中输入。 运行测试并在回溯测试和正向测试中查看结果。 将输入保存为设置文件。 在图表上加载 EA 并加载设置文件,就这样,您成为了专家。

Indicator ICT Implied Fair Value Gap (IFVG) is an important part of the Smart Money Concepts (SMC) system. It looks for and shows on the chart a modern pattern - the Fair Value Gap ( FVG ). This pattern is a three candlestick imbalance formation based on the discovery of a mismatch between supply and demand. This happens when the price moves quickly in one direction without encountering resistance. The result is a "gap", which can be filled in later. The indicator finds this pattern using the up

The NFX Crash 500 Bot, is an advanced Synthetics Trading bot! It is a tried and tested EA based on a proprietary trading strategy specifically designed and optimised for the Crash 500 Index . We have paired this with a custom multilayer neural network that constantly scans previous and present market conditions using over 120 different data points and can make fine adjustments to find better entries. It uses Technical Analysis, Statistical Data Analysis, and custom indicators to open trades. LIN

This Rocket Breakout Strategy for NASDAQ index is a trading strategy that focuses on breakouts from a range based on previous days, using a volatility filter to identify pre-breakout situations and a trend filter. This strategy employs a stop loss and profit target approach to manage risk, with higher profit targets for long entries and lower for short entries. The strategy also includes an end-of-week exit to avoid exposure to weekend news events. Percentage-based position sizing is used for

Bot to attach to any different chart than the one using to get the orders and send them to telegram Inputs: Telegram Bot Token, Telegram Chat ID Sends Open Price, Order Type, Lots, Take Profit and Stop Loss instantly after the trade is executed. Easy to SetUp and to use My other Bot for XAUUSD and USDCHF: https://www.mql5.com/en/market/product/94001 Just remember to go to Tolls->Options->ExpertAdvisors->Allow Web Request for listed URL: https://api.telegram.org/
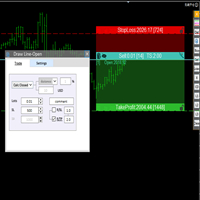
交易者的最佳伙伴! 基本使用设置 基本: 支持语言的选择切换(目前支持中文和英文) 自动识别语言 划线交易
支持英文中文自动选择,自动识别.
1.划线交易 ( 支持拖拉,支持多个订单线 ) 2.手数管理: 两种手数计算模式 ①资金的风险比例,例如设置风险百分比为1的时候,1万美金可交易1手. 计算手数 = 资金(净值或者余额或者剩余保证金) * RISK /10000 ②按亏损金额计算,本设置需要配合止损设置, 计算手数 = ( 当订单被初始下单设置的止损所止损的时候所亏损金额 计算得到的手数,小于最低手数会等于最小手数) ; 3.盈亏比等设置,
设置部分 1. 自动吸附最近高低点 2.高低点偏移 3.自动选择订单习惯 4.SL TP设置方式 5.语言设置

This EA works best on EURUSD pair in M15 time frame . EA is equiped with very low drawdown to return ratio settings . For any additional quaries telegram contact is given .
telegram link : https://t.me/Ari_407 .
To properly test the EA in mt5 strategy tester select deposit balance 10000 and M15 timeframe and select EURUSD pair and run the backtest from 01/01/2022 to current date. Lot size may be configured depending upon user needs. Other settings are not to be changed .
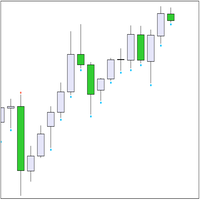
趋势指标“Trend Two Moving Average”使用两种箭头来显示计算结果 - 它们是“Trend UP”和“Trend DN”。 箭头“向上趋势” 绘制 经过 价格 '低的' 酒吧 , A 箭头“趋势 DN”- 经过 价格 '高的'。 趋势搜索算法基于对柱线价格和两个“移动平均线”指标值的分析。趋势方向是在当前(零)柱上计算的。因此,建议使用来自 bar #1 的信号 - 来自完全形成的 bar。 在交易中使用指标。 使用趋势指标,您可以同时使用风险策略(当信号来自当前柱时)和风险较低的策略(当信号来自柱 #1 时)。下面描述了基于来自柱 #1 的信号的策略 。 等待生成的信号( 此刻 新柱的出现,您需要查看柱 #1) 。 如果 在吧台上 #1 是 Arrow ,我们在市场上交易,或使用挂单: 1.按箭头方向开仓 2. 根据箭头的水平 放置挂单( Limit )

2015年的回顾 | MT4版本 | FAQ MiloBot PRO 是一个先进的外汇专家顾问,基于一个独特的专有策略 它已经被开发、测试和优化了2年多的时间。该策略的可靠性在于,开发商的真实账户的存款总额超过10万美元。 独特的MiloBot PRO策略允许每个月获得稳定的利润,自定义指标允许EA在市场反转时刻尽可能精确地进入市场。 查看开发商当前的实时信号: 2019 年 11 月以来的账户(利润超过 +1520%): myfxbook.com/members/Malik87/robot-advisor-launched-november-11/3623023
我們個人使用 MiloBot Pro 進行交易,因此我們不斷測試它,在 EA 中實施一些新的東西。 所有買家都將收到更新並使用最新和最可靠的顧問版本。 我叫 Sergey Ermolov ,是 MiloBot PRO 顧問開發團隊的負責人。 我只相信數字,而數字表明: 我们的MiloBot PRO专家顾问让你的年收益高达103%,包括资本重组 它平均每月完成181笔交易,其中68%是盈利的。 能够
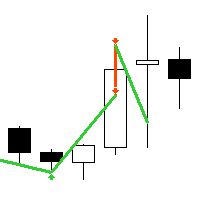
"AV BuyLow SellHigh EA Full" is an Expert Advisor for MetaTrader 5, which was created from the simple "AV Preview".
The original idea was to buy lower and sell higher from the last entry price. On request, I have developed it further and tried to remove its trend weakness. This EA has more settings than the free Minlot version.
Strategy:
The size of a displayed rectangle is used to decide whether range trading is to be carried out (sell above, buy below) or trend trading (buy on rising, cont

It contains four major utilities: ZeroRisk Trade Pad to open and manage trades, ZeroRisk Manual Trader , a ssistant for manual traders to control the trading plan and prop firm rules, ZeroRisk Algo Trader , assistant for algo traders to control and monitor EAs and ZeroRisk Telegram Signal Provider to send manual or EA signal to telegram. This assistant supports news filter from top 3 trusted news website ( Investing.com, Daily FX , Forex Factory ) and auto GMT offset from Worl

Introducing "Congestion Breakout MT5" - the indicator that helps you identify congestion zones in your chart and alerts you when the price breaks through them. Traders know that congestion zones can be key areas of price action and can indicate potential turning points in the market. However, spotting these zones and anticipating breakouts can be a difficult and time-consuming task. That's where "Congestion Breakout" comes in. This powerful indicator uses advanced algorithms to analyze the pri

To get access to MT4 version please click here . This is the exact conversion from TradingView: "SwingArm ATR Trend Indicator" by " vsnfnd ". The screenshot shows similar results from tradingview and Metatrader when tested on ICMarkets on both platforms. Also known as : "Blackflag FTS" by "Jose Azcarate" This is a light-load processing and non-repaint indicator. All input options are available except multi time frame. Buffers are available for processing in EAs. Extra option to show buy and sel

Displays trends in current chart. You can display trends of multiple timeframes in one chart by inserting this indicator as often as you want. Key features: displays trend line by finding highs and lows counts number of high/low of current trend in different color (long/short) allows you to display multiple timeframe trends in one chart Settings: Indicator Name: if you want to show M5 and H1 on one chart add TITrend twice to your current chart and rename M5 to "TITrendM5" and H1 to "TITrendH1" C

简介和说明 Arcturus是一个专门用于外汇投资的交易EA。基于密集型马丁格尔原则,该机器人以与趋势相反的方式进行交易,以尝试在趋势反转中获利。马丁格尔系统是一种投资系统,其中投资的美元价值在亏损后不断增加,或者头寸大小随着投资组合规模的降低而增加。马丁格尔系统是由法国数学家保罗-皮埃尔-莱维在18世纪提出的。该策略的前提是只需要一个好的赌注或交易就可以扭转你的命运。与绝大多数没有紧急关闭系统的马丁格尔不同,Arcturus有一个完整的保护系统。这个系统特别有助于验证道具公司的挑战。 Arcturus对点差不敏感,对滑点也不敏感。它可以在几乎所有允许此类系统的经纪商(代表大多数经纪商)上使用。此外,该EA是多货币兼容的,这意味着可以用它同时进行多个符号的交易。然而,如果多货币交易是活跃的,该EA应该在非相关货币对上启动,如欧元兑美元和瑞士法郎兑日元。 以下是专家顾问的不同特点的列表: 马丁格尔。 没有网格。 获利。 多货币交易兼容:为每个符号选择不同的神奇数字。 动态和固定手数。 兼容道具公司:紧急关闭和每日损失限制。 可定制的输入和指标,可进行广泛的优化。 调试模式。 交易的账户应
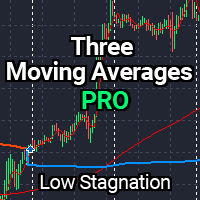
介绍Three Moving Averages Pro,这是一系列包括强大的自定义优化指标的移动平均策略,Three Moving Averages Pro帮助您找到低停滞和高净利润的最佳交易系统。 该策略使用两个入场条件和一个出场条件来执行精确和准确的交易。通过多种选项,例如在不同移动平均线上方或下方的开盘柱位置和不同方向的移动平均线交叉,您将拥有所需的所有控制权以进行盈利交易。 您可以通过将收益率和止损设置为价格的百分比来控制风险。此外,您还可以设置进入和关闭时间以增加对交易的控制。借助自定义优化指标,交易员可以找到具有高CAGR和低回撤以及低停滞的系统。 Three Moving Averages Pro的最佳功能之一是它提供了广泛的移动平均类型可供选择。这使得交易员可以灵活定制其交易策略以适应其个人需求。通过选项,例如简单移动平均线(SMA)、指数移动平均线(EMA)、平滑移动平均线(SMMA)、线性加权移动平均线(LWMA)、双指数移动平均线(DEMA)、三指数移动平均线(TEMA)、高低移动平均线(HiLo)、成交量加权移动平均价格(VWAP)和线性回归移动平均线(LINR

This is a simple arrow system based on Engulfing Candlestick Pattern. It gives you alerts on your smartphone when there is an engulfing candlestick pattern happens. Which type of alerts available? 1. It paints on chart Up/Down Arrows. 2. Popup message and sound alert in trading terminal window. 3. Push notification or Alert on your Android and IOS mobile phones (requires MT4 or MT5 app installed!) *Note: Use it on higher timeframes like H4 (4 hours), D1 (1 Day) then find trade opportunities on s
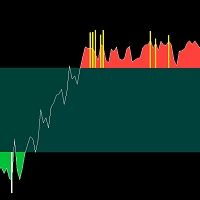
BS Trend Line是一款很好的买卖指示器,不含有未来函数,不会重绘,新版本已经加入了更好的过滤算法,开单成功率有了很大的提高,是一个很好的波段交易提示器,尤其是配合 SourcePoint 会有更明显的效果,它能帮你过滤掉接近70%以上的无效交易信号。 ===================参数列表===================== timeframe:M1
gip:30 sip:6 up line:80 down line:20 ===================使用方法===================== 配合 SourcePoint 使用时, SourcePoint 的参数 fastP: 96
slowP:208 avgP:72

My Grid expert advisor for MT5 is a safe and good-quality tool that uses advanced algorithms and technical indicators to automate Grid trading strategies. It offers flexible customization options and can handle both trending and ranging markets on the EURUSD and other pairs. With its take-profit levels, trailing stops, and lot size management, it ensures the safety and profitability of your trading account.
The EA is plug and play, set file is in the comment section. Account monitoring: https

Simple supply and demand indicator which should help identify and visualize S&D zones. Settings:
Color for supply zones, color for demand zones - default colors are set for dark (black) background.
Number of how much zones should be created above and below current price - value "3" means there will be 3 zones above current price and 3 zones below current price. Principle:
When price creates "V", reversal zone is registered. Rectangle filled based on zone type (supply / demand) is drawn if price

uGenesys AI - 90% Accurate Daytrading Indicator
Introducing the ultimate forex trading indicator system, uGenesys AI, powered by cutting-edge AI technology and advanced analytical techniques, including Time-Series Analysis and Genetic Algorithms. Our AI-powered trading system leverages the power of time-series analysis to identify trends and patterns in historical price data, allowing traders to make informed predictions about future market movements. By analyzing vast amounts of data, our syst
交易者您好!
我提出“牧师大师”策略,牧师大师,一位应用基于规范的扎实技术的古代牧师。 它可以与整个市场一起工作,如果需要的话可以控制滑点和点差,通过 RSI、布林线等重要指标对入场点进行高度分析。值得注意的是,他的表现已经超越了市场的许多品种,以及他在哪里取得了成功 特殊之处在于使制胜位置具有战略方法
我的策略针对“所有外汇市场”进行了优化,但也有最好的货币对”,但建议使用我设计的 Priest Master 它有一个内置系统,可以承受 x 余额的风险,它也有恢复功能 如果市场在任何时候变得不稳定 它还具有我的智能算法系统,当 TP 检测到我的内置秘密指标的正确预测时,它可以关闭某些仓位,而不是其他仓位。
我的策略 EA 有着鲜活的历史
现场表演 如果您想要我的信号预设,请私下询问我,仅限我的客户
https://www.mql5.com/en/users/aiotrading/seller
每次收购的价格都会上涨,我们将以此保护,以便很少有人能够拥有我独特的策略
下个月价格 --> ??
我建议您在第一次复制时退出
建议搭配推荐的配对使用! (重要通知购买

The Turtle EA is a fully automated robot that uses a very efficient strategy and good money management. These are the suggested Settings: EA for trading long term, Best Results Starting from 2023 Lot Amount suggested use the Dynamic Position Size and Risk % per trade. Trade XAUUSD, USDCHF on 5m, settings for XAUUSD are the standards of the program, for USDCHF are the comments near the inputs The screenshots are based on a backtest using Real Tick data on a 1000$ account on a 3 months backtest d

An Opening Range Breakout (ORB) EA is an automated trading system that is designed to trade a financial instrument based on a specific strategy called an Opening Range Breakout. The strategy is commonly used by day traders in the financial markets, particularly in the stock market. The Opening Range Breakout strategy is based on the idea that the first few minutes of the trading day can be particularly volatile, and that a significant move in the price of a stock or other financial instrument ca

This is a simple arrow system based on MACD indicators Main/Base line and MACD Levels. It gives you alerts when MACD's Main Line crosses above/below certain level. Which type of alerts available? 1. It paints on chart Up/Down Arrows. 2. Popup message and sound alert in trading terminal window. 3. Push notification or Alert on your android and ios mobile phones (requires MT4 or MT5 app installed!)

IMPORTANT: Blocks&Levels Alerts MT5 indicador.
Gives you the ability to easy draw Blocks and Levels (support and resistance) using key shortcuts and Alerts when price touch them. Please use it and give me feedback!! It really helps! Thank you very much! DESCRIPTION:
Blocks&Levels Indicator, has useful key shortcuts for draw Levels, Blocks Zones, change chart Time Frames, Select or Deselect all drew objects. SETUP: Just install the Indicator on the Chart
Open and navigate Indicator properties

ABOUT TWENTY 23th EA This is one of the EA's in the market that trades martingale with moving averages, this ea trades using 2 moving averages and the other moving average id for the trailing user don't need to worry about setting trailing stops.This ea martingale on both side at the same time. TRADING PLAN We also have daily trading plan whereby the user will be able to set the trading plan on how much each day the trader is willing to loss or gain. once the daily target is reached ea stops wor

Sometimes the market becomes volatile and we need algorithms that operate this volatility regardless of its direction. This system tries to take advantage in moments of high volatility.
It has 5 levels of input filters that it is recommended to adjust depending on the volatility, the average value would be mode 3, below the sensitivity decreases, above it increases.
You can download the demo and test it yourself.
Very stable growth curve as result of smart averaging techniques. "Safety first

Gold King
Gold King is an expert advisor (EA) developed for the MetaTrader 5 platform and designed to assist traders in their gold trading activities. The EA uses advanced algorithms to analyze market data and identify trading opportunities, while also providing real-time trading signals and automated trading capabilities. Gold King is specifically designed for gold trading and utilizes a range of technical indicators and price action analysis to generate its trading signals. Traders can use t

SqueezePlay is an EA that trades four indicator, it is optimised for trading DOGE coin, its secret is in the closing of the trades. The take profit and stop loss squeeze the trade untill a profit or loss is determined. With the SqueezePlay EA we squeeze out the profits to its maximum potential. So choose the SqueezePlay EA for your arsenal of EAs for your best chance at EA profits.

It is important that the indicator works only in the charts of Japanese candlesticks and bars. So, this indicator is ideally combined with price pattern analysis Price Action and is used in classic Japanese candlestick analysis This forecasting tool consists of three elements: Price flip is a signal of a potential reverse. Setup filters out the signals, that is, it identifies where a new trend starts and when there is only a correction within the current trend. Countdown calculates the tre

该工具在您的头寸上设置止损
通过 Metatrade 策略测试器快速测试。 如果多头头寸,您的止损将在最后一个底部 或者在空头头寸的情况下,您的止损将在最后一个顶部
此外,该工具还管理您未平仓头寸的尾随。 始终将止损设置在最后形成的高点或最后形成的底部
要创建顶部和底部,我使用免费指标“支撑线和阻力线”,可通过此链接下载: 下载 metatrade 5 的免费顶部和底部指标
该工具移动资产上所有未平仓头寸的止损位置 gāi gōngjù zài nín de tóucùn shàng shèzhì zhǐ sǔn
tōngguò Metatrade cèlüè cèshì qì kuàisù cèshì. rúguǒ duōtóu tóucùn, nín de zhǐ sǔn jiàng zài zuìhòu yīgè dǐbù huòzhě zài kōngtóu tóucùn de qíngkuàng xià, nín de zhǐ sǔn jiàng zài zuìhòu yīgè dǐngbù
cǐwài, gāi gōngjù hái guǎnlǐ nín wèi
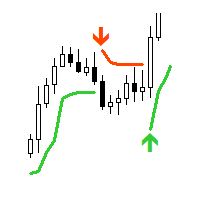
"AV SuperTrend MT5" is an indicator for MetaTrader 5. The supertrend indicator is popular for determining the trend and positioning stops or as trailing support. I use this indicator in several expert advisors for trend analysis.
Supertrend indicator signals can be selected in the form of entry arrows and notifications, as well as various sounds.
Settings:
- Period
- Multiplier
- Alert buy signal: arrow color
- Alert sell signal: arrow color
- Alert yes/no
- Sound: choice or no
- Email yes/

该指标旨在确定一天内最大交易活动的时间。 计算完成后,指标建立最重要的交易水平。 将这些水平与实际价格行为进行比较可以提供有关市场趋势强度和方向的信息。
指标的特点 时间范围必须低于 D1。 推荐时间范围:M15、M30 和 H1。 H1 以上的时间框架可以给出非常粗略的画面。 使用低于 M15 的时间框架可能会导致短暂的交易爆发。 该指标对历史数据敏感。 因此,我建议在图表窗口中至少设置 50,000 个柱。
指标参数 Base - 设置计算交易活动的基准期。 day - 计算交易活动时考虑了一天中的时间。 week – 交易活动的计算考虑了一天中的时间和一周中的某一天。
Width - 线宽。 ClrMean、ClrUp 和 ClrDn 是中、上、下交易水平的颜色。 Style1 - Style5 – 显示交易水平的样式。
AlertsOn - 打开交易时段开始的通知。 MailOn - 启用将消息发送到电子邮件的权限。 NotificationOn - 允许向移动终端发送消息。
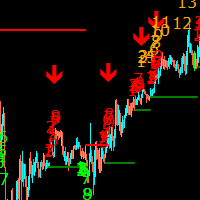
The Sequential Ultimate Indicator is a modified version of the Ultimate Oscillator that adds a sequential component to the calculation. It is designed to identify potential trend reversals by looking for divergences between the price action and the oscillator. The Sequential Ultimate Indicator works by adding a sequential count to the Ultimate Oscillator readings. The sequential count starts at 1 when the oscillator moves above 70 or below 30 and continues until a price reversal occurs. The sequ

The Rainbow Multiple Moving Average (MMA) is a technical analysis tool used to identify trends and potential reversal points in financial markets. It is based on a system of moving averages that are designed to be used together, with each moving average having a different time frame. The Rainbow MMA consists of multiple exponential moving averages (EMAs) of different lengths, with each EMA plotted in a different color. Typically, the Rainbow MMA includes EMAs of 2, 3, 4, 5, 6, 7, 8, 9, 10, 11, a

Smart Tape - это индикатор ленты всех сделок с возможностью агрегации по цене и времени и фильтрацией по величине объема, включает в себя два отключаемых варианта отображения. Вариант 1: перемещаемое окно по графику со списком сделок (Time Sales). Список обновляется сверху вниз и не имеет возможности просмотра истории. Количество отображаемых строк выбирается пользователем. Порядок отображения в строке: время с точностью до миллисекунд, тип сделки (B - покупка или S - продажа
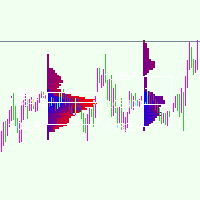
A Market Profile (time price opportunity) implementation with an option to mark a point of control (POC) based on volume .
Config: Hide default candles. Select a session time using exchange timezone. Experiment with tick multiplier value to achieve desired level of detail. Choose the symbols of your choice, e.g. squares or A-Z chars. For multiple sessions you will have to add additional instances of this script with a different time configuration.
Limitations: TradingView has a hard limi

Golden Ducat NAS — is an advanced system designed specifically for GOLD trading. The basis of the system is a unique custom indicator. This is not a grid, not Martingale.
How to run it:
You need to place the EA on the XAUUSD chart ONLY TIMEFRAMES M5 .
Attention :
You can start trading with a minimum initial deposit of $50 Recommended leverage is 1:100 or more. Highly recommended VPS hosting 24/7.
Options:
Maximum deposit risk, % Fixed lot, if 0 then auto Take Profit,pip Stop Loss,pip V

Arguably THE MOST PROFITABLE SYSTEM..... WITH EXTREMELY ::::::::::TIGHT STOPLOSS::::::: Introduction PRICE of only 199/- (limited period)
- Extremely TIGHT STOP LOSS on EVERY TRADE (only 20 pips STOP LOSS) - EXTREMELY HIGH WIN RATIO STILL :::::::::: 90% ::::::::::::: - SUPER HIGH PROFITS ::::::::::: BACK TEST SHOWS 1000 ==> 3.2 million in 13 years - QUICK SCALPING ... TIGHT SCALPING...
IS THE HOLY GRAIL of All Systems as it has EVERYTHING - 90% WIN RATE - Super high return $ 1000

Master Scalping is an expert advisor (EA) developed for the MetaTrader 5 platform using MQL5 programming language. As its name suggests, it is designed for scalping in the foreign exchange (forex) market, where it aims to generate small profits from numerous trades executed within a short period. The EA uses a combination of technical indicators and price action analysis to identify trading opportunities and execute trades automatically. It can be customized with various settings such as lot siz
Capital management robot: automatically manage the volume of your positions with this expert. With this robot, you can automatically manage the volume of your positions. It will be possible for you to log in with multiple TPs.
Also, three Dravidian indicators, sessions and candle end timer have been added to this expert.
You can quickly make any changes you need in your transactions by using the position management and order management section.
Very practical and easy to use.
There are other rob

The Katsil Scalper is an innovative approach in the financial market that has been developed through years of meticulous research and development. This strategy encapsulates the very essence of the iconic Katsil brand, which is renowned for its blend of sophistication, excellence, and meticulous attention to detail. With the help of cutting-edge technology, the Katsil Scalper is designed to provide a competitive edge to those seeking to achieve leadership in the financial market. The method is

Introducing the ultimate news trading robot for forex MetaTrader 5 - designed specifically for traders who want to profit from market volatility during news events. With this robot, you can easily set up two pending orders - buy stop and sell stop - just 10 minutes before the news release. Simply set the time on the robot to 10 minutes prior to the news release time (for example, if the news is scheduled for 6:30, set the time on the robot to 6:20), and the robot will take care of the rest. But
The SD Indicator is a powerful tool in the world of Forex trading, that combines two classical strategies: Support/Resistance levels and Supply/Demand zones. The indicator helps traders to identify potential trading opportunities in the market with high accuracy.
Support and resistance levels are key price levels where buying and selling pressure converge, leading to potential price reversals. The SD Indicator identifies these levels in real-time and provides traders with a clear picture of whe
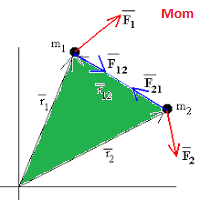
Indcador/Oscilador basado en el concepto de la física clásica, "Cantidad de movimiento". Fácilmente adaptable a diferentes pares y activos, como a períodos de time frame. Los parámetros de entrada son los que siguen, y pueden modificarse por el usuario: TrendPeriod = 14; // Trend period Smooth = 3; // Smoothing period TriggerUp = 0.05; // Trigger up level TriggerDown = -0.05; // Trigger down level

Sobre la base del concepto físco de "Cantidad de Movimiento" construimos este indicador/oscillador, que pretende darnos idea de entradas y salidas en el mercado. En mecánica clásica, la cantidad de movimiento se define como el producto de la masa del cuerpo (volumen) y su velocidad (rapidez con la varía el precio) en un instante determinado. p=M*V Se trata de un indicador/oscilador que pretende identificar momentos de entrada y salida basados en la fuerza o presión a ambos lados del preci

If you want to be successful in Trading you must be extremely disciplined. Without discipline you won't get far.
To help traders build and maintain discipline in the long run I have create the Risk Manager EA that comes with two huge benefits:
1. Equity and Balance protection
2. Risk and Money Management automatic tracking rules
How?
The EA has 6 customizable Conditions that, if triggered, will use at least one of 3 available Actions. All the tracking activity is displayed
in a simple an

The Buffalo Trader BOT is the most complete QUANT solution on the market. With it you'll be able to create any strategy you want, and better, without tying yourself to specialist models that only perform specific tasks. With Buffalo, you will have a true ally for your operations, as you will have the freedom to define, test and train the best Quantitative Trading models using a single and powerful tool.
See what you can do with your Buffalo Robot
BASIC DEFINITIONS OF STRATEGY Define names for

Introducing KILLINGFUNDED_ALLINONE , the AI Trading system that's changing the game. Developed and run by the master traders, fund managers, and pro developers at TimeGroup since September 1st, 2019, KILLINGFUNDED_ALLINONE is revolutionizing the market. Here's what you can expect from KILLINGFUNDED_ALLINONE : The system uses advanced algorithms to identify advantageous market conditions in both overbought and oversold markets, combining wave and wave rebound principles to enter and exit trad

This is a trend scalping EA because it uses trend indicators like Bollinger Bands and Moving Average. Easy to use forex expert advisor designed for EURUSD H1 but fully capable of trading other forex pairs and other timeframes too. Features: 1. NO Grid 2. NO Martingale 3. Smart Lot Sizing 4. Auto Take Profit in Money 5. Auto Stop Out at % of Balance 6. Minimal Inputs 7. Can trade 100 US Account too. 8. High Win Rate 9. Positive Equity Curve Account Requirements: *Broker - Any *Account type - Hed

< Features >
Seed is a robot that automatically trades by finding the beginning of a trend in a range market. It is a day trading robot that automatically sets lot size, stop loss, etc., and increases assets with compound interest. It trades 2-10 times per week. In a market of uncertainty, we use optimization tools to efficiently select currency pairs that we believe are range-bound each day.
< How to use >
(1) Using the optimization tool, the trading of currency pairs that have been profit
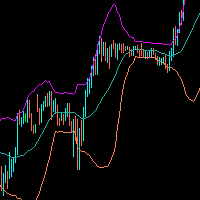
Bollinger Bands are a technical analysis tool that consists of a set of three lines plotted on a price chart. The middle line is a simple moving average, usually of 20 periods, and the upper and lower lines represent the standard deviation of the price from the moving average. The upper band is calculated by adding two standard deviations to the moving average, while the lower band is calculated by subtracting two standard deviations from the moving average. This creates a band around the moving

As well as SuperTrend, SuperTrend Alerts offers alerts . You can also get alerts with SuperTrend Alerts . Besides SuperTrend, SuperTrend Alerts also offers alerts . SuperTrend Alerts offers alerts along with SuperTrend . In addition to SuperTrend, SuperTrend Alerts has alerts . Also , SuperTrend Alerts offers alerts . The SuperTrend Alerts add-on works with SuperTrend as well. As well as SuperTrend, SuperTrend Alerts has alerts too .

iHegde MA cross is a MultiTimeFrame Indicator which works by intersection of two moving averages
Signals- the indicator generates signals in the form of arrows when the intersection between short and long moving average occurs
Features 1. Works on All Time Frame 2. Works on All scripts, Index, Forex 3.No repainting 4. Smoothed for better appearance
Settings 1.Moving averages-short and long 2. Arrow-size 3. Colour customization 4. Alerts/Push/Email
Note: The signals are indicative of possibl

Attention : Please send a message to us if you still don't understand and are expected to follow the recommended capital size, lots size value, and one of the brokers whose portfolio we display. " For those of you who buy RTC Spectra products by ignoring our recommendations, you don't need to provide bad testimonials for your own mistakes!". The Expert Advisor (EA) named "RTC Spectra" is designed for the long term with good and consistent results. This EA has been proven to perform very well

COGO Hunter is a fully automatic Expert Advisor for Trend, Hedging, News filter Strategy Trade Base On Machine learning and Stochastic Oscillator Stochastic Main Line And Signal Line Use For Open Pending Order Buy Or Sell COGO Hunter can work on a VPS Supported timeframes: H1,H4,D1, W1, MN1. recommend use D1 CoGo Hunter support machine learning CoGo Hunter all currency pairs Features No martingale Hard stop loss a

THE BIG FOUR system operates at the same time and simultaneously the 4 big forex pairs: EURUSD, GBPUSD, USDJPY and USDCHF, the system is optimized for these four pairs although it could be used with any value if you decide to use it in other values try They are not too correlated.
To use the robot, place it in any pair in the 1 min time frame (recommended) and it will place the images in the 4 selected products, (you do not have to place a robot in each pair)
The system is of multiple orders a
MetaTrader市场是 出售自动交易和技术指标的最好地方。
您只需要以一个有吸引力的设计和良好的描述为MetaTrader平台开发应用程序。我们将为您解释如何在市场发布您的产品将它提供给数以百万计的MetaTrader用户。
您错过了交易机会:
- 免费交易应用程序
- 8,000+信号可供复制
- 探索金融市场的经济新闻
注册
登录