适用于MetaTrader 5的付费EA交易和指标 - 122
Crash Killer Pro
This robot automatically assists you in trading the Crash index. However, knowledge of reading the trend is necessary to avoid losses. Launch the robot only in clear periods of trends either uphill or downhill. Some recommendations: Check trend with 1h timeframe Crash 1000 recommended for robot Timeframe 1 minute Minimum capital 300 You can use default settings or adjust.

Starting sale price is 159$ The next price will be 299$. So grab yours now! Stallion expert advisor is the product of years of research, development, and testing. This EA uses two price action strategies for entering a position and recovering the lost trades. Every position has its specific stop-loss and take-profit but by increasing lot-size EA will recover losses. with all that said the drawdown is often fairly low. minimum balance 500$, recommended balance 1000$. minimum leverage: 1:500, rec
BOOM Killer Pro
Here is an excellent robot that will allow you to trade the Boom with some ease. The strategy used allows through a combination of Buy and Sell to ensure that you are always in blue. The robot is set to stop losses at -150 and this is obviously configurable. This will rarely happen if the following recommendations are followed. Some practical recommendations: Use the robot in clear upward or downward trends. Avoid using the robot in the ranges Boom 1000 recommended for robot Tim

ADX 指标(平均方向指数)是一种旨在衡量市场趋势强度的技术工具。 ADX 指标用于各种目的,例如测量趋势强度、寻找趋势和交易范围,以及作为各种外汇交易策略的过滤器。
一些最好的交易策略是基于跟随市场趋势。还有一些策略可以让交易者通过逆势交易来获利。无论如何,如果你能及时发现新出现的趋势,你赚钱的机会就会明显增加。
对于交易者来说,好消息是现代交易软件会自动为您进行这些计算。 在这种情况下,您无需单独下载 ADX 指标:ADX 会自动包含在平台指标列表中
如您所知,ADX 指标用于确定市场是否呈趋势。 但是你怎么知道趋势何时发生? 因此,ADX 的范围从 0 到 100。Wilder 认为高于 25 的值表明市场存在趋势,而低于 20 的值表明趋势较弱或根本没有趋势。 出于这个原因,许多现代技术分析师认为 25 的值是市场中“趋势”和“无趋势”之间的关键点。
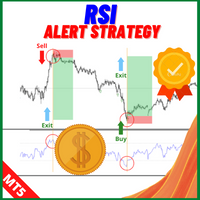
Description: For a comprehensive understanding of our indicators, we invite you to explore the entire Q&A section within this MQL5 blog post here . The RSI Cross Alert Indicator is a powerful technical analysis tool designed to assist traders in identifying potential trend reversals and generating timely buy or sell signals. This user-friendly indicator is suitable for both novice and experienced traders, providing valuable insights into market trends and price movements. Key Features: - RSI

本指标的目的是识别反转点. 蓝色箭头是做多信号,它对应的黄色星是止损. 红色箭头是多空信号,它对应的黄色星是止损.
报警功能: 如果产生了信号,指标会发送三种报警:弹窗,邮件,或者手机推送 Inputs: Popup Window Alert: 弹窗报警,默认是关闭的 Email Alert : 邮件报警,默认是关闭的 Mobile Push Alert: 手机推送报警,默认是关闭的. MetaTrader 4 Version : Reversal Point 请注意,这个信号是逆势的,可能会连续失败. 请注意,这个信号是逆势的,可能会连续失败. 请注意,这个信号是逆势的,可能会连续失败. 请注意,这个信号是逆势的,可能会连续失败. 请注意,这个信号是逆势的,可能会连续失败. 请注意,这个信号是逆势的,可能会连续失败.

What is this indicator? This indicator plots a customized text object as a note at any point on the chart. To plot the text object, press the hotkey and then click at any point on the chart. You can also add your favorite words and sentences to the template and plot them.
How to stick a note 1. Press the hotkey to enter sticky mode. 2. Click any point to stick. 3. Edit the text of the text object plotted as a note.
About sticky mode
This mode is for plotting a text object as a note. If the ho

What is this indicator? This indicator stamps any customized number at any point on the chart. To stamp any number, press the hotkey (0–9) and then click at any point on the chart. You can also stamp a series of numbers to indicate a chart pattern. (Each number synchronizes modification)
How to stamp any number
1. Press the hotkey (0–9) to enter stamping mode. 2. Click any point to stamp.
How to stamp a double top/bottom pattern 1. Press the hotkey to enter stamping mode. 2. Click any points

What is this indicator? This indicator draws a customized Fibonacci retracement or expansion at any position on the chart. To draw the object, press the hotkey and then click at any point on the chart. Each anchor point magnets to the high or low price of the nearest bar on the chart.
How to draw
1. Press the hotkey to enter drawing mode. 2. Click any point to draw. 3. Drag and drop each anchor point to adjust if needed.
About drawing mode
This mode is for drawing a Fibonacci retracement or
What is this indicator?
This indicator controls the visibility of graphic objects on the chart when the hotkey is pressed. If you switch on, the graphic objects will be hidden. If you switch off, the graphic objects will be shown. You can specify the object to control with object type.
List of supported object types - Vertical Line - Horizontal Line - Trendline - Trendl By Angle - Cycle Lines - Arrowed Line - Equidistant Channel - Standard Deviation Channel - Linear Regression Channel - Andrew
Tool converted from tradingview indicator. Modified version with pivot points calculated in a more intuitive way.
This tool displays relative volatility and directional trend. Excellent way to pickup diversions and reversals. Length can be lowered to 11 or 13 in settings to show price range.
Can be used to identify patterns such as parallel channels and likely direction of price action.
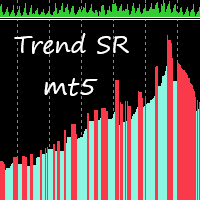
This indicator takes input from Support and Resistance levels, combined with a special trend filter. Easily spot tops and bottoms, and trade with more confidence. Great for scalping. This indicator can be used on all time frames and pairs. Features alert function.
No need to set up the indicator.
How to use: Simply attach to any chart. Zoom chart out completely. Red histogram line color = Selling opportunities. Blue histogram line color = Buying opportunities. See pictures below. To spot highs/
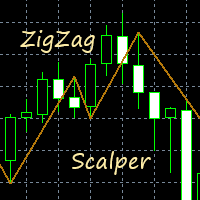
This indicator gives you a modified ZigZag, combined with a trend filter. Great for scalping. Perfect for channel trading. Features alert functions. No need to set up the indicator. How to use: Simply attach to any chart. Buy when the golden line stops below the price. Sell when the golden line stops above the price. It also helps to keep the audible alert set to true. Best results when checking two or more timeframes before entering trades on the lower time frames. Use as you see fit for your

该指标使用所谓的“邪恶”数字作为权重系数。它们的对立面是“可憎”的数字,也出现在该指标中。将数字划分为这两类与汉明权重有关,汉明权重由特定数字的二进制表示法中的单位数确定。 使用这些数字作为加权因子会产生趋势跟踪指标。此外,可恶的数字给出了更敏感的指标,而邪恶的数字给出了保守的指标。它们之间的差异不是很大,只有在市场价格剧烈波动时才能注意到。使用该指标可以帮助确定新趋势的开始。这使得可以更准确地确定开仓时刻。 指标参数: Type numbers - 选择数字类型,Evil 或 Odious; iPeriod - 指标周期。指标的灵敏度取决于此参数。它越小,对价格变化和市场趋势变化的敏感度越高。 图中显示了指标操作的示例。

You can see Binance Futures data instantly in Metatrader 5 and it allows you to use all the features that Metatrader has provided to you.
You can access the data of all symbols listed on Binance Futures. Don't forget to set the timezone. Binance it's 00:00 UTC. You need to fix it according to your own country You need to pre-install the free Binance Future Symbol List plugin. https://www.mql5.com/tr/market/product/82891 After loading, it automatically downloads the data of the cryptos in the m

EA Goldlytic use a trend built-in indicator. It's specifically designed for trading the XAUUSD (GOLD) but can be used with other assets (forex, crypto...).
The Expert Advisor opens an order based on a signal from the indicators and fixes the profit at a certain level with the ability to open order basket For best results, it is recommended to cancel the direction of trade on the EA panel on the chart Since this is a trend-following Expert Advisor, we recommend disabling the Expert Advisor in c
Equilibro B3 Trader é um robô de negociação versátil projetado para a bolsa de valores brasileira B3, capaz de operar no mini-índice WIN e mini-dólar WDO, bem como em commodities (como milho e boi gordo) e ações (fracionadas ou não). O robô utiliza uma estratégia poderosa baseada em forças e retrações para fazer entradas nos trades, por meio de uma avaliação de 3 médias móveis simples, que podem ser configuradas de acordo com as preferências do usuário. Inclui-se também filtros de entrada por â

Optimize before back test or use.
New Wave trades trends. 3 moving averages and trends up and trends down, buying and selling. Finding the optimal parameters for yourself, you will need to optimize in the platform. A set file is in the comments to use in the test to show the Expert. Optimize inputs according to your asset and risk. I optimized this with EURUSD on a 1 hour time frame. Percentage of balance is used to trade by.

The EA uses a scalping strategy on a breakout, uses innovative advanced technologies using a Neural Network. To create the EA , we used the latest advanced algorithms to find the best moments to enter the market. The EA uses many smart filters to adapt to almost any economic situation. The EA sets a protective stop order, so the trader does not have to worry that the robot will allow significant drawdowns. The adviser is safe and does not require any settings from the user, just install it on th

Supported currency pairs: EURUSD,USDCAD, GBPUSD, EURGBP Recommended timeframe: M15
The EA should run on a VPS continuously Setting Fixed Lot - fixed frist trading lot StopLoss, in pips - stop loss value TakeProfit, in pips - t ake profit value RSI : averaging period, Averaging period for calculation
RSI : type of price RSI :RSI value calculation
Use martingale, martingale Mode Martingale coefficient, martingale multiplier Order Maximum number of multiplications
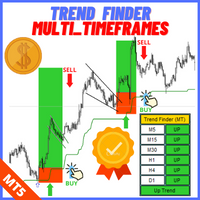
Description: The "Trend Finder Multi Time Frames multi pairs" indicator is a new technical analysis tool designed to assist traders in identifying and confirming trends across multiple timeframes and multiple pairs at the same time. By combining the strengths of various timeframes, this indicator offers a comprehensive view of the market's direction, helping traders make more informed decisions. Features: Multi-Timeframe Analysis: The indicator analyzes trends on different timeframes (e.g., M1
Este EA foi desenvolvido para o mercado financeiro Brasileiro, porem, com os Parâmetros corretos pode ser aplicado a todos ativos disponíveis na metatrader inclusive forex e metais. Não julgue o resultado com os parâmetros padrão, entenda que os parametros são para validação de diversos ativos, por isso cada ativo tem um valor que se enquadra na realidade do contexto do mercado. Qualquer duvida, pode me chamar no Telegram @andrefonsecaloureiro ou no email vendas.mercadocapital@gmail.com

The Force and Weakness Indicator for MT5 Real Volume is part of the (Wyckoff Academy Price and Volume) toolset The Force and Weakness Indicator for MT5 Real Volume was developed to identify the Strength and Weakness of volume in an accumulated way. Enabling the vision of a panorama between price and volume. The Indicator can be used as an oscillator and as a histogram. As a fantasy it has all the premises of R. Wyckoff's three laws when put together with the price: Cause and Effect, Effort x Res

The Force and Weakness Indicator for MT5 Forex is part of the (Wyckoff Academy Price and Volume) Toolkit The Force and Weakness Indicator for MT5 Forex was developed to identify the Strength and Weakness of volume in an accumulated way. Enabling the vision of a panorama between price and volume. The Indicator can be used as an oscillator and as a histogram. As usual it has all the premises of R. Wyckoff's three laws when put together with the price: Cause and Effect, Effort x Result and Supply a

The VSA Candle Signal for MT5 is part of the toolset (Wyckoff Academy Price and Volume). Its function is to identify the correlation of Price and Volume in the formation of the candle. Its creation is based on the premises of R.Wyckoff , a precursor in the analysis of Price and Volume. VSA Candle Signal for MT5 assists in decision making, leaving your reading clearer and more fluid. See the images below.

The Weis Wave Bouble Side Indicator for MT5 is part of the toolkit (Wyckoff Academy Wave Market) The Weis Wave Bouble side Indicator for MT5 was created based on the already established Weis Wave created by David Weis. The Weis Wave Double Side indicator reads the market in waves as R. Wyckoff did in 1900. It helps in the identification of effort x result, cause and effect, and Supply and demand Its differential is that it can be used below the zero axis and has a breakout alert showing Who is s

The Weis Wave Bouble Side Indicator for MT5 is part of the toolkit (Wyckoff Academy Wave Market) The Weis Wave Bouble side Indicator for MT5 was created based on the already established Weis Wave created by David Weis. The Weis Wave Double Side indicator reads the market in waves as it was done by R. Wyckoff in 1900. It helps in the identification of effort x result, cause and effect, and Supply and demand Its differential is that it can be used below the zero axis, further improving plus operat
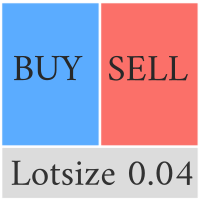
This Pro version of the LotSizePanel let's you set the stoploss with a line. Instantly the ea will calculate the lotsize based on where you drag the line on the chart. Press the "Show Line" button again, and the line dissappears and the ea reverts back to calculating the lot size from an ATR based stoploss again.
I can't see how I would ever trade manually without this panel again.
Remember that autotrading needs to be turned on to place orders with the buttons.


User Grid MT5 is a multifunctional grid Expert Advisor designed to fully or partially automate various ideas related to grid trading (on a hedging account) . The Expert Advisor can trade on any timeframe, on any currency pair, on several currency pairs, on any number of signs. It does not interfere with manual trading, trading of other Expert Advisors, or the operation of any indicators. It allows you to adjust your settings on the fly, works only with your own positions and orders. It has a

WA_PV_BOX_EFFORT X MT5 的结果 WAPV Box Effort x Result Indicator 是 Package Indicators 组(Wyckoff Academy Wave Market)的一部分。 MT5 的 WAPV Box Effort x Result Indicator 可帮助您阅读价格和交易量。它的阅读包括协助识别努力x结果 在图表创建的波浪中。 当方框为绿色时,MT5 的 WAPV Box Effort x Result Indicator 表示交易量有利于需求,而当方框为红色时 量有利于供应。 方框越大,成交量相对于价格的位移越大。如果价格的上升波与 Box 的大小不成比例,则 努力x结果。 以一种非常直观的方式,我们可以识别出数量和价格之间的这种差异。 MT5 的 WAPV Box Effort x Result Indicator 还允许您通过将指标置于零轴下方来改善可视化。 以即时交易量和实际交易量在市场上运作 看图片:

The WAPV ADH Supply and Demand Forex Indicator is part of a set of Indicators called (Wyckoff Academy Wave Market) The WAPV ADH Forex Supply and Demand Indicator for MT5 is intended to identify the winning side between buyers and sellers. Its reading is very simple, when the green line is above the red line demand is in command, when the red line is above the green line supply is in command. The more positive the green and red lines, the higher the volume input, the closer to zero or negative, t

Supported currency pairs: EURUSD,USDCAD, GBPUSD, EURGBP Recommended timeframe: M15
The EA should run on a VPS continuously Setting Fixed Lot - fixed frist trading lot StopLoss, in pips - stop loss value TakeProfit, in pips - t ake profit value CCI: averaging period, Averaging period for calculation
CCI: type of price, Use martingale, martingale Mode Martingale coefficient, martingale multiplier Order Maximum number of multiplications

The WAPV ADH Supply and Demand indicator is part of a set of indicators called (Wyckoff Academy Wave Market)
The WAPV ADH Supply and Demand indicator for MT5 is intended to identify the winning side between buyers and sellers.
Its reading is very simple, when the green line is above the red line the demand is in charge, when the red line is above the green line the supply is in charge.
The more positive the green and red lines, the greater the volume input, the closer to zero or negative, th

The Price Elevator indicator is developed to help you figure out the general long-term trend of the market. If the price is above the Green separator line, this is a clear indication the bulls are in control. Similarly, the bears are in control if the price continues to trend below the red separator line. Download Price Elevator MT4
Trend Re-entry In this case you would plan your buy entries above the green dotted box (make sure to set the Buy / Sell Retracement Floor=30). The SL should be
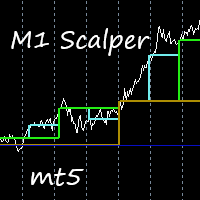
This indicator is excellent for scalping on the M1 or M5 chart. Uses a special algorithm for the lines. No need to set up the indicator. Does not feature any alerts and is best used manually after visually confirming the line displays. NB: Make sure to download M1 history before testing and use.
How to use: Simply attach to M1 or M5 chart. Zoom chart out completely. Sell when all lines above the white line (PriceLine). Sniper line crosses above white line. Buy when all lines below the white lin
该交易专家的主要目的是利用追踪止损来支持未平仓头寸。专家可以跟踪手动和其他顾问开设的头寸。 止损和止盈水平的计算是基于市场价格变化的统计关系。借助这一点,顾问可以选择利润和风险之间的最佳比率。一有机会,专家就会将仓位移至盈亏平衡点,然后开始跟踪价格。头寸的盈亏平衡点是根据累计掉期和佣金来计算的。 此外,还增加了使用您自己的算法开仓的功能。因此,对顾问进行了重大更改,包括输入参数。
追踪止损参数: Trailing Stop timeframe-顾问用来计算止损和获利水平的时间范围; UseTakeProfit-跟踪仓位时使用您自己的获利。
交易策略主要参数: Lot – 如果使用其内部策略,专家将开设的头寸数量; Slippage – 价格滑点(最小值 1); Best price-专家开仓时使用的过滤器; MinRisk-控制风险。启用此过滤器可以降低风险,但也会降低盈利能力。
策略参数: Symbol Name——顾问应该监控的符号。如果未指定参数,则使用安装顾问的符号; Strategy-选择您自己的交易策略。 None- 未发生该符号的交易; Strategy para

1.这是什么 这是关于市场形成盒子后,再突破的交易策略。它可以交易主要货币兑和黄金:EURUSD,GBPUSD,AUDUSD,NZDUSD,USDJPY,USDCAD,USDCHF,XAUUSD。它不是削头皮模式,不采用马丁格尔的资金管理模式,此策略主要是为了稳健的盈利。 2.相关说明 策略时间框 PERIOD_M30. 它适用于Hedge账户。 它内部的策略逻辑已经被设置好,仅开放了资金管理供你调整。并且资金管理的模式是我自定义的模式,它兼顾收益和风险。 3.资金管理的参数说明 MM_Mode1 = Money_Minimum / Money_Fixed / Money_FixedIncrement_SplitFund / Money_FixedIncrement_SplitFormula. Money_Minimum 为最小仓位. Money_Fixed 为固定仓位.
Money_FixedIncrement_SplitFund / Money_FixedIncrement_SplitFormula 为我个人设置的资金管理模式。当前策略我一般使用 Money_FixedIn

The idea behind this indicator is very simple , First it contains 2 mechanisms to place your trades:
1- Enter the Pips you want to duplicate to price levels. 2- Automatically let the indicator specify the largest Buy / Sell Volume Candle and place duplicated levels based on the candle itself.
How it works: 1- Enter the Pips you want to duplicate to price levels: 1- once the indicator is loaded you will need first to Specify the number of pips in the indicator Configuration window ,you can g

“Practically everyone can forgive us for honesty: and, say, an insufficiently professional game, and even insufficiently professional poetry. There are many examples of this. But when honesty disappears, nothing is forgiven.”
Golden Rings - Forex financial robot offers options for finding profitable trades even in unstable markets when the current trend direction is unclear. It will follow the best trend to maximize profits and reduce the chances of possible losses.
To work in MetaTrader 4 an

Defender Deposit is a professional expert system designed to analyze markets based on the Parabolic SAR indicator. On a "bull trend" the indicator is below prices, on a "bear trend" - above. If the price crosses the Parabolic SAR lines, then the indicator reverses, and its next values are located on the other side of the price. With this "reversal" of the indicator, the reference point will be the maximum or minimum price for the previous period. The reversal of the indicator is a signal ei
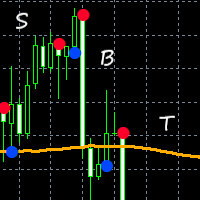
This indicator combines input from two trend filters and the ADX. You can change the trend line on chart to your preference. Great for scalping and channels. Features alert function and parameter TrendLinePeriod.
How to use: Simply attach to any chart. Sell on red bullets, with trend line above price. Enter on bullets closest to this line. Buy on blue bullets, with trend line below price. Enter on bullets closest to this line. Best results when checking the higher time frames before entering tr

该实用程序通过滚动鼠标滚轮来控制任何指标的任何参数。 如果您购买或租用了一个指示器,您可以使用这个实用程序更改它的界面. 任何具有至少一个整数参数的指标都适用于此。
如果您首先想尝试它的工作原理,请下载免费的 Standart 滚动条指示器,以控制标准终端交付的指示器。
运作原理 该实用程序通过滚动鼠标滚轮进行更改来控制您选择的参数之一。 滚动模式激活是通过将光标悬停在按钮上或单击它来启用的。 按钮自动在图表上设置。 对于长时间加载的指示器,按按钮使用滚动模式. 在这种模式下,只有在按钮关闭后,指示器才会加载。
安装工程 在图表上加载您的指标,记住您要控制的参数的值。 它必须是一个整数。 将通用滚动条上传到图表。 在"设置"窗口中,同步两个指标-为此,请在"参数"字段中输入指标中的值。 例如,如果指示器的参数等于14,请在通用滚动条设置中设置参数14。 单击确定。 按钮出现在图表上后,您可以将其拖动到任何方便的地方,它会记住它的位置。 指示器已准备好使用。 只需将鼠标悬停在按钮上! 申请表格 将光标悬停在按钮上并旋转鼠标滚轮。 您选择的参数将随着您在设置窗口中设置的步骤而增

该EA结合了来自Keltner通道和其他指标的信号,根据所选时间框架的趋势执行买入和卖出,通过为每个资产选择特定参数来非常自信。理想情况下,您应该在回溯测试中测试参数以验证策略。享受技术为您提供的最好的东西。如果您对我的个人预设感兴趣,请在聊天中与我们联系或发送电子邮件,vendas.mercadocapital@gmail.com。 This EA combines signals from Keltner's channels and other indicators, executes buy and sell against the trend of the selected time frame, great assertiveness with selection of specific parameters for each asset. Ideally, you should test the parameters in the backtest to validate the strategy. Enjoy the best that technology has t

Hello traders. The Ultimate Machine is a versatile robot, primarily designed to trade the XAUUSD symbol on the H1 time frame using default settings. However, if you wish to trade on a different currency pair, such as EURUSD, you'll need to undergo the optimization and testing process. Therefore, I recommend testing the robot extensively on a DEMO account before proceeding further. If you're exclusively using this robot, there's no need for additional adjustments. However, if you're simultaneousl

MACD strategies EA is a EA that can support multiple MACD strategies. Purchasing this EA can save you the time taken to automate your existing MACD strategy through coding a custom EA and it also helps you discover profitable MACD strategies as its fully compatible with the strategy tester and all settings are editable. The EA supports both scalping, short term and long term strategies. The various supported settings are explained below: NOTE: The default settings in the EA are s
This EA was developed for the Brazilian market in win active in all series of the year. A method of confluence of several indicators of moving averages, IFR and ATR is used. It uses the medium price technique to recover losses in a situation of reversal of movement, and can be enabled and parameterized. The goal is to gain 50 points at each entry, with only 1 contract the risk is minimized and the profit is gradual. Recognizes and avoids input at lateralization levels. It recognizes and advance
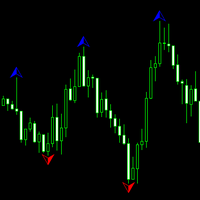
An indicator for all timeframes with a configurable number of bars for calculating fractals. Suitable for determining extremes of both lower and higher order, by which it is possible to determine the patterns of technical analysis, as well as divergences.
The indicator has one adjustable parameter - the number of bars for extremum calculation. It is also possible to change the color characteristics.

FIRST 10 FREE Zeus is a system developed by 8A Sistemas, it is very simple but its strength lies precisely in its simplicity, Zeus works on the statistics of the price of the previous day, such as its minimum price, maximum price, greatest retracement, pivot points among other statistical data that is not We reveal it to guarantee our intellectual property, but it is only statistical data that is not necessary for the operator to know for its correct operation.
Strategy: Zeus looks for impul
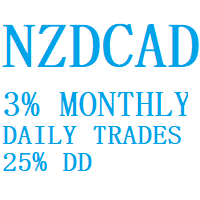
My name is Bea and I trade the NZDCAD 1H I am extremely profitable with low risk. I trade every other day, but when I do, you don't need to worry. I am under control.
I give a return of 1 to 3% a month ( to be used with my other ea's) for higher profit return (3-5%) a month. you can always increase risk. Draw down is under 30%. Using 100% tick data and forward testing: turn $5,000 into $63,812 with 30%dd 90% of trades close within 60 hours Turn $10,000 into $149,237 with 30%dd This all done wit
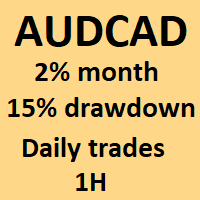
My name is Moose and I trade the AUDCAD 1H I am very profitable and have been trading for more than 3 years live. I have a very successful track record. I am a bit risky, but I do like to receive my reward at the end of the day. I am only 3 years old, but my boss has been trading for 17 years - he designed me and my rewards. I give a return of 1 to 2% a month ( to be used with my other ea's) for higher profit return (3-5%) a month. you can always increase risk. Draw down is under 15%.
Recommend

ROC 价格直方图警报是一种基于动量的技术指标,用于衡量当前价格与一定时期前价格之间的价格百分比变化。 ROC 以直方图对零绘制,如果价格变化向上,则指标向上移动到正区域,如果价格变化向下,则指标移动到负区域。
计算 ROC 周期的主要步骤是“计算周期”输入设置。短线交易者可能会选择一个较小的值,例如 9 或 12。长期投资者可能会选择更高的值,例如 200。“计算期”是与当前价格相比的多少个时期。较小的值将使 ROC 对价格变化的反应更快,但这也可能意味着更多的错误信号。较大的值意味着 ROC 反应较慢,但信号在出现时可能更有意义。 这种技术指标既有积极的一面,也有消极的一面
积极的 ROC 价格振荡器是技术分析中使用的无界动量指标,以零水平中点为基准 ROC 上升高于零通常确认上升趋势,而 ROC 下降低于零则表明下降趋势 五种警报类型,包括视觉买卖箭头 任何品种和时间框架 消极的 当价格整合时,ROC 将徘徊在零附近。在这种情况下,观察整体价格趋势很重要,因为 ROC 除了确认整合之外几乎不会提供任何洞察力。 指标菜单类别 主要配置 - ROC 计算周期/警报设置 - 应用

Market Conditions indicators can provide support to the trader so that he can identify market trends over a given period. The purpose of this model is to allow traders to have a global vision on the exchange markets. And the formula that we develop allow to scan the major currencies in the exchange market. The model uses a purely statistical formula which is based on the historical data of the major currencies "eur, usd, gbp, jpy, aud, nzd, cad, chd". Of which 28 currency pairs are traded. It

Golden Retriever is one of my best EA's to date. The Golden Retriever, retrieves money from the market for you. It Retrieves money in small sizes and is a very gentle trader. I am a fullime trader for the past 17 years. My methods all revolve around small profits, short trades and low risk. My experience shows that 2-3% monthly profit using a combination of trade systems is the best way to have a long and effective career in trading. It was developed using 17 years of experience in live tradin

SLTPSetter - StopLoss Take Profit Setter HOW DOES IT WORK? Risk and account management is a very critical aspect of trading. Before entering a position, you must be fully aware how much you will be willing to loss both in percentage and value. This is where SLTPSetter gets you covered.
All you need to do is attach the indicator on the chart and PRESS BUY OR SELL automatically, all parameters needed for placing the trades will be provided at the top left corner of the screen. Feel free to adjust

FINAL BLUE EA THE DESCRIPTION : Finale bleue is a trading robot that allows the automation of analysis and trading processes. It opens and closes orders based on certain criteria and calculations it has been programmed to perform. EXPLANATIONS: He opens and closes orders much faster and more efficiently than a human ever could, and he does it 24/7 without emotion. Which makes it an ideal trading tool. It only exits the market in blue and in the end it always emerges as a winner on all

McDuckEA MT5 – works on the martingale strategy. It shows good results when trading on Gold, XAUUSD. Martingale orders are opened with a step from each other and only after the opening of a new bar of the set timeframe. During the release of important news, the adviser suspends the opening of new orders. The EA has an internal risk control system and, if the risk is exceeded, it starts to exit the market, closing extreme positions in pairs. The level of loading of the deposit determines the risk

The LevelsDetector Expert Advisor identifies the strongest levels on the chart.
How it works LevelsDetector collects data on all the prices of Japanese candlesticks for the selected period LevelsDetector considers the top levels, which often touched the price. As the price and the timeframe change, the LevelsDetector also corrects the levels. Settings candlesCount - Number of candles for the analysis maxLevelsCount - Number of levels to display magic_number - Unique number of the Expert Adviso

At first, I got my teeth into Phoenix Ultra Expert Advisor.
This Expert Advisor will support automatic close order if the direction is correct and perform recovery if the direction is wrong. If you enter an order: 1. The price goes in the right direction and hits the Min Profit Point , trailing stop 20% of the current profit. 2. The price goes in the opposite direction, the Expert Advisor will place the order with the volume is Recovery Volume Percent at the input, the distance to

The ATRStopLoss Expert Advisor determines where best to put a stop relative to the current price.
How it works ATRStopLoss gets the size of ATR for the selected period ATRStopLoss draws Stop-Loss levels from the current price with the size of the ATR. As the price and the timeframe change, ATRStopLoss also adjusts the Stop-Loss levels. Settings MA_Period - period of the ATR MA_Timeframe - ATR timeframe

DreamCather EA - 是美国时段收盘时的高级剥头皮策略。 EA 交易是趋势剥头皮交易者,当主要趋势回滚时进入交易。一套简单的算法可以让您在很长一段时间内以及在市场的各个阶段取得稳定的结果。该系统专注于长期增长。 EA 不使用危险的资金管理系统,例如网格或鞅。它为每个头寸使用固定的止损。 EA 已经对数据进行了 20 多年的测试,在此期间它经受住了最不稳定的时期。如果您没有机会让您的计算机 24/5 保持正常工作,那么建议使用 VPS 服务器服务。 实时信号: https://www.mql5.com/en/users/delmare/seller 此处提供 MT4 版本: https://www.mql5.com/en/market/product/80988 有关产品的全面说明、输入说明和常见问题解答, 请单击此处。 加入我们分享新闻的 MQL5 小组 建议: 时间范围:M5 主要(推荐)货币对:EURUSD,USDCHF,GBPUSD 次要货币对:EURCHF,EURGBP,USDCAD,USDJPY 最低存款:100 美元 设置:所有对的默认设置 为获得最佳

该指标使用价格序列的局部高点和低点。突出极值后,对它们的值进行平滑处理。因此,建立了两个通道 - 外部和内部。如果价格走势严格遵循线性趋势,则内部通道显示限制。外部通道以对数趋势显示价格变动的边界。 在计算通道后,该指标分析实际价格走势并提供开仓和平仓建议。蓝点 - 建立买入头寸,红色点 - 建立卖出头寸。相应的交叉盘建议关闭某些头寸,如果有的话。应该记住,并非所有信号都具有相同的强度和准确性。在某些情况下,正确方向的价格变动会很快结束,因此不可能获得大笔利润。在某些情况下,信号会导致损失(最后一张图片显示了此类信号的示例)。鉴于这些特点,我们可以推荐以下方法 - 使用浮动止盈,其值可以根据当前市场情况进行更改。还需要选择一个止损值,以便在出现关闭它们的信号之前关闭无利可图的头寸。 指标设置使用以下参数进行: iChannel - 调整通道的宽度。狭窄的通道会提供更多的信号,但也会增加误报的风险。 iSignal - 允许您配置信号的显示。默认情况下,仅显示最佳进入和退出信号。 iPeriod - 指标周期。该参数越大,通道宽度越大。因此,它也会影响信号的数量。 iFac

The Market Entropy indicator was created to measure the order of price changes over time. consists of two lines and a histogram where the lines are responsible for measuring the price movement and the histogram measures the strength of the analyzed movement. It can be used to find a trend (Image 2) or price reversal (Image 3).
Blue Line: Buy Entropy Red Line: Sell Entropy Historgram: Market Entropy
Interpretation: Buy Line above the Sell Line indicates that in the analyzed period buyers were

ProZone
!!! There is a discount for the first 5 users
A stable working adviser on real accounts: https://www.mql5.com/ru/signals/966602
https://www.mql5.com/ru/signals/966598
The expert analyzes more than 100 indicators. Thanks to this, he trades almost all week.
The adviser can trade both completely independently, and there is an opportunity to open the first positions himself, after which the expert will independently bring the matter to its logical end, that is, close the position or pos

ImbaTrend Runner - is the trend following manual system for forex/crypto market. It defines medium-term trends and works with it in intraday mode. System shows enter points, profit and loss targets. As a rule profit targets are 2-3 X bigger than loss targets. Indicator is AutoAdaptive and it automatically updates it's settings during trading. Indicator is sensitive to market changes, regular updates helps to stay in relevant trend. Main Indicator's Features Signals are not repaint, late or disap

Informações Importantes sobre o ArrowHacker (Não repinta! Não gera sinais atrasados!)
Se você está procurando um indicador que cumpre aquilo que promete, você acabou de encontrar! O ArrowHacker irá superar todas as suas expectativas com certeza! E o melhor de tudo, é só colocar na sua conta, ligar e já começar a lucrar!
O ArrowHacker é um sistema profissional de trade criado para as plataformas MT4 & MT5 e otimizado para trabalhar com qualquer ativo na plataforma MetaTrader 5, sejam moedas, m

Remove comments from MQL5 and MQL4 code with a few mouse clicks using this utility. The utility processes all files in the root directory and in all folders of your project at once. Use the "Remove Comments" to protect your source code before compilation, when you publish the next version of your product in the MQL Market, or when you give an executable file to your customer. You can work with the actual source code of your project in the \MQL5\EXPERTS\ or \MQL5\INDICATORS folders. At th

40% off. Original price: $50
Advanced Bollinger Bands Scanner is a multi symbol multi timeframe Bollinger bands dashboard that monitors and analyzes the Bollinger Bands indicator from one chart. This panel scans the Bollinger bands indicator in up to 28 configurable instruments and 9 timeframes for price overbought/oversold, price consolidation (Bollinger bands squeeze), and consolidation breakout (squeeze break) with a deep scan feature to scan all market watch symbols (up to 1000 instrument

As you know, the logarithmic chart is essential for any Technical approach. This Expert Advisor create a customize symbol for any symbol you want and it plot logarithmic chart for that. You can easily switch between logarithmic and arithmetic charts. the Expert provide crosshair for last and actual price and you can add your personal LOGO to chart. also you can set individual zoom for each Time Frame. Important: The Expert Advisor doesn't work on Demo version. because Demo version work only on S

The Sytem Equivalent is a breakout trading system in data distribution based on deep machine learning, parameterized neural network technology. Data distribution has different types of breakout - different systems study and analyze in terms of neural network parameters, something progress up to date. The system analyzes every profit from the distribution of breakout types so that it is tested on the backtest and it is very successful.The accuracy of profit in the learning system for neural netwo
MetaTrader市场是独有的自动交易和技术指标商店。
阅读MQL5.community用户备忘更多地了解我们提供给交易者的独特的服务:复制交易信号,自由职业者开发的自定义应用程序,通过支付系统完成的自动付款和MQL5云网络。
您错过了交易机会:
- 免费交易应用程序
- 8,000+信号可供复制
- 探索金融市场的经济新闻
注册
登录