适用于MetaTrader 5的付费EA交易和指标 - 112

The WRLD ZIGZAG, as it says in its name, is taking from candle to candle, it can be used in m1, m5, m15, m30 and h1 to scalp, it also has high and low to capture the next break that can be made, it can be used in synthetic indices as well as for forex too! It works in any type of pair for each market, where you can also add the Critical channel indicator to capture a beautiful profit trend
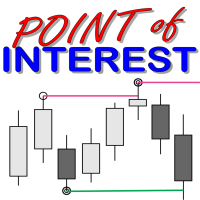
What is a Point of Interest? Traders who follow Smart Money Concepts may call this a Liquidity Point, or areas pools of liquidity have been built up by retail traders for for Big Banks to target to create large price movements in the market. As we all know, retail traders that use outdated and unreliable methods of trading like using trendlines, support and resistance, RSI, MACD, and many others to place trades and put their stop losses at keys points in the market. The "Big Banks" know these me

Obar FX
I would like to offer you the opportunity to create your own system portfolio.
The offer is aimed at all who want to have a diversified portfolio that outperforms the market with significantly lower fluctuation.
therefore I will gradually upload all Exper Advisor, which I use. It should be noted that I run them all together and do not rely on a single strategy. i have additionally checked the individual expert advisors for correlations via quant and calculated the corresponding positio

趋势跟踪和非重绘外汇交易指标。
它的信号以完全自动的方式计算和提供,并基于移动平均线交叉点。 这是一个对新手友好的工具,因为这些信号以简单的买入/卖出箭头的形式呈现。 尽管如此,信号可靠性非常可靠。 您可以将它与任何外汇交易策略结合使用。
Trend Signals Alerts Indicator 适用于各种时间框架和货币对。 它直接显示在主交易图表上。 可以直接从输入选项卡修改默认设置。
仔细查看趋势信号警报指标 该指标背后的主要思想是提供一种简单的方法来展示市场趋势和交易信号。 结果,初学者和高级交易者都可以利用该工具。 只需看看屏幕截图中在 MT5 中激活时的外观。
趋势信号警报指标剖析 如您所见,它只是一条带有买入/卖出箭头的线,可以进行相应的交易。 箭头位于移动平均线相交的同一位置。 但是,不能更改这些移动平均线的周期。
趋势信号警报指标:买入信号 请按照以下提示获取多头交易信号: 1.向上箭头出现 2.触发收盘后开启买入交易 3.将止损设置在最近市场低点下方几个点 4.保持仓位直到出现相反的信号或使用您自己的交易退出策略
半趋势买入卖出指标:卖出信号 请

"Pattern 123" is an indicator-a trading system built on a popular pattern, pattern 123.
This is the moment when we expect a reversal on the older trend and enter the continuation of the small trend, its 3rd impulse.
The indicator displays signals and markings on an open chart. You can enable/disable graphical constructions in the settings.
The indicator has a built-in notification system (email, mobile terminal, standard terminal alert).
"Pattern 123" has a table that displays signals from se

RSI Professional is based on an oscillator to hunt ranges and trends where you can also see it catches rebounds in the measurements according to the pair, it can be used for forex and synthetic indices, it works in any temporality, in the pairs that I use it are, eur/usd, usd/jpy, usd/chf and gbp/usd, in synthetics in the crash and boom pairs all, volatility 75, jumps, and range break!
Xrey SP500 Trend
I would like to offer you the opportunity to create your own system portfolio.
The offer is aimed at all who want to have a diversified portfolio that outperforms the market with significantly lower fluctuation.
therefore I will gradually upload all Exper Advisor, which I use. It should be noted that I run them all together and do not rely on a single strategy. i have additionally checked the individual expert advisors for correlations via quant and calculated the correspondi

Xrey Dax Cycle
I would like to offer you the opportunity to create your own system portfolio.
The offer is aimed at all who want to have a diversified portfolio that outperforms the market with significantly lower fluctuation.
therefore I will gradually upload all Exper Advisor, which I use. It should be noted that I run them all together and do not rely on a single strategy. i have additionally checked the individual expert advisors for correlations via quant and calculated the corresponding

Trade on Binance with MT5/MT4 EAs and indicators! GRat_BinanceImport is a tool for manual and automated trading , including ANY available EA, ANY cryptocurrency on the most popular crypto exchange Binance 24/7. Features 1. ALL Binance instruments are available. 2. Import(automatic copying) to the specified Binance currency all trades (made manually or by an EA) from an MT5 account (including demo) by the specified symbol and/or magic number. 3. Import(automatic copying) to the specifie

One of the main Forex secrets is that the majority of these systems don't actually work. They have been developed by marketers, and are designed to sell, and not work. Once you have paid for the signals or automated software, you will not be able to get your money back ,and such tools would hardly bring you any profit. Forex trading may make you rich if you are a hedge fund with deep pockets or an unusually skilled currency trader. But for the average retail trader, rather than being an easy roa
This algorithm uses real time data to generate signals with an accuracy rate of 80%. It shows entries and where you should place both the stoploss and the take profit for each trade. It determines trend! It can even help you to become a signal provider! And it can generate up to 8 signals a day! You get access to a free forex trading community Operates on any broker compatible to synthetic indices and forex
if you need any assistance whatsapp +2774 35 35 744 or telegram link @pipsempire01

Fractal MA is an indicator to hunt trends and scalp on h1 m30 m15 m5 and m1 works very well for synthetic indices and forex, in eur/usd, usd/jpy pairs, in synthetic indices in Range break 100, boom pairs 300, crash 300, boom 500 and crash 500, volatility 75, it is also programmed to hunt rebounds in m5, it has a profit percentage of 80% You can also trade in the 28 currency pairs

Introducing the South African Sniper indicator created by a small group of traders with a few years trading trading the financial market profitably . This is a plug and play indicator that provides you with BUY and SELL (SNIPER ENTRY) signals with TARGET and trail stops. The indicator Works with all MT5 trading instruments. The indicator uses previous chart data as receipt to speculate on future market moves.
"The South African Sniper indicator community are very happy with the indicator and
RSI Intelligent is a fully automated scalping robot that uses a very efficient Relative Strength Index (RSI) breakout strategy, Probabilistic analysis with (RSI). Most effective in the price Cumulative probability of a normal distribution that occupy the bulk of the market time. Transactions happen almost every day like Scalping follow trend. A Forex robot using the Relative Strength Index (RSI) indicator combined with an artificial neural network would be an advanced automated trading system th
Sika EA works on GBPUSD - 1H $1,000 to $11,700 ... Jan 2020 - Dec 2022 (1% Risk. Low Risk. Change risk percent from zero to 1 to start trade or test).
$10,000 to $5,000,000 ... Jan 2018 - Dec 2022 (2% Risk Trade)
RISK Management :
It is always better to stay in the game for a long term growth rather than one time win trades.
Sika EA uses an averaging technique to mitigate against risk. Take Profit and Stop loss are hidden by the EA and auto calculates each
profit base on the parameters

Please note that the price of the EA will change after every three copies sold. Therefore, the next price will be $290 This is an Neural Network EA which is trained on NZDCAD symbol from 2010 until 2022-12-01 at M15. The EA not using dangerous method like martingale or grid. But you can enable the Martingale method on the EA's inputs.
Every month the trained data would be updated on my server automatically. So the EA need to be updated every month. You have to download every month the new ver

Multi trend is an indicator that marks the low and high to be able to do a good scalping, whether it is on the upside or on the downside, it is recommended to use it in h1, m30, m15, m5 and m1, it works very well for synthetic indices and forex in eur pairs /usd, usd/jpy, aud/cad, etc and in synthetics in the pairs Boom 300, crash 300, crash 500 and boom 500, volatility 75, jump 100, jump 75, volatility 10 etc!

The Kiss EA is a fully automated scalping robot that uses a very simple but efficient strategy, advanced money management and probabilistic analysis. Most effective in the ranging market with more than 65% of the market time . Reliability and guarantee of stable profit in the future. Suitable for both beginners and experienced traders.
Monitoring: https://www.mql5.com/en/signals/1881519
Requirements Trading pairs Recommend: EURUSD, XAUUSD
Timeframe Recommend: M15 or M30
Minimum deposit
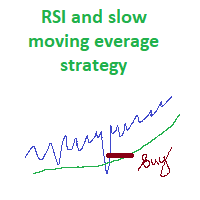
This EA uses 2 indicators: RSI and moving average. Positions opened towards the side of moving average. When price reaches the predefined high RSI value and goes down to the trigger point, then EA opens a sell position. Logic to opening a buy position is the same. Setting input parameters:
This EA uses 2 indicators: RSI and moving average. Positions opened towards the side of moving average. When price reaches the predefined high RSI value and goes down to the trigger point, then EA opens a

Highs and lows fulfill the same function as support and resistance, this indicator works both for scalping and for intraday, it can be used in markets such as forex and synthetic indices, it works very well in the eur/usd usd/jpy gbp/usd pair and others , in synthetics in the pairs volatility 75, volatility 25, volatility 10, jump all crash and boom too range break 100 !

Reversal EA is a price action mean reversal trend expert advisor that recognizes candlestick patterns such as DOJI , ENGULF , THREE WHITE SOLDIER and THREE BLACK CROWS and HARAMI , either for long or short trades. The indicator Relative Strength Index RSI can be used to filter only reversal trends. Takeprofit and Stoploss can be configured with fixed values or dynamic values according Bollinger Bands. Indicators: - Relative Strength Index RSI. - Bollinger Bands. Features: -

Critical channel an indicator where trend channels are shown and the pivots are seized the indicator is for scalping and is used in M1/M5/M15/Y M30 it is also analyzed in H1 it is used both for forex and synthetic indices %100 recommended! It goes very well in the eur/usd, usd/jpy, aud/cad, etc. in synthetic indices for volatility, crash and boom and jump use with japanese candles

SmartVSV Panel. Swing trade with pending orders or scalp with your keyboard . You can try this panel out with the free version SmartVSV1. https://www.mql5.com/en/market/product/91194 Chart objects. This tool will help you to find orderblocks , fair value gaps and liquidity . If you use session ranges or Sunday open in your strategy, it will draw them for you. If you are looking at another chart (such as DXY, Gold etc) while trading, SmartVSV has a minichart button for you. You can set an

Zig Zag EA is a trading robot that uses the ZigZag indicator to determine tops and bottoms, then it trades the breakout with fixed stops and risk. Signal
Settings Features - Fully automatic mode with adjustable inputs.
- Strict use of stop loss management, every trade is protected in advance.
- Filter for bad market conditions to avoid large spreads and heavy slippage.
- Filter for bad terminal connection.
- Filter for time.
- Auto lot size calculation.
- Does not use averaging, grid or marting
This EA is sessions trading robot that allows you to trade the trading session of yours choice as it waits for market markers to make decision for the direction of the day before taking any trades. It has 3 entry signals that uses candle stick patterns, Moving Averages and Range Break to maximize profits and to take advantage of the trending market. The EA practices risk management and has the ability to grow account by risking certain percentage of your account(risk percentage) each time there

Nonfarm Payrolls Expert advisor is a fully automated EA that can only be used to trade fundamentals and specifically NFP news releases. A nonfarm payrolls EA is a type of EA that is specifically designed to trade based on the nonfarm payrolls data releases. It is suitable for both beginners and experienced traders.
INSTRUCTIONS
* User should only active this expert advisor when expecting NFP NEWS release. * During this event the market is volatile and If it happens for whatever reason the m
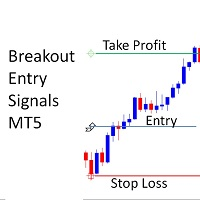
!! FLASH SALE !! Over 80% off !! For ONE week only. Now only $47 - normally $297! >>> Ends on 30 June 2023 - Don't miss it!
Buy and Sell Alerts when price breaks out following strict price action. Sends Alerts – #On MT5 To Your Phone To Your Email
Does not repaint .
Works on any Forex pair, any timeframe.
10 Activations allowed so you are free from limitations >> MT4 Version Here For spreads from a tiny 0.1pip RAW/ECN Accounts, click here . Check out my Waka Esque EA signal here

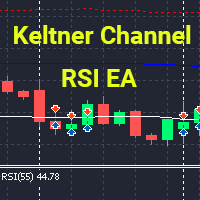
Maximize Your Profits with the Powerful Keltner Channel RSI EA - An Expert Advisor with Custom Optimization Metrics Introducing the Keltner Channel RSI EA, an expert advisor that allows you to trade in a variety of ways using Keltner Channel and RSI signals. The Keltner Channel is a technical indicator that plots upper and lower bands around the price action, based on the volatility and average true range. The RSI is a momentum indicator that measures the strength of an asset's price action, rel
Update 2.0: Added the option to change LWMA to the other 3 basic MA modes. I also added Smoothing to it, to tame it a bit. You can input 1 as smoothing period and no smoothing will be applied.
Update 2.1: Removed Trend Typical Open/Close as is was the same behavior as Trend Open/Close. Trend follow works by averaging the high/low with close/open. If Close is above Open, Trend Close = Close+High/2, averaging between close and high, and when Close drops below Open, it's calculation automatically s

**This is a Utility so the DEMO does not work. Please leave a comment and we will reply** ‘Trader Pro – Any Broker’ is the ideal solution for beginners and professional traders who want to trade ANY Signals on MT5 with ANY broker. This unique service will complete all the technical set up, monitoring and maintenance, so you don’t have too.
This ground breaking service has been developed by experienced traders to solve real world problems and overcome Signal to Broker limitations so the user

Советник в начале торговой недели выставляет сетку отложенных ордеров (stop или limit) и пытается достичь недельной прибыли, указанной в настройках. В пятницу, если целевая прибыль не достигнута, то советник в течение дня либо ждет любого положительного или нулевого результата за неделю и закрывает остатки сетки и открытые позиции, либо в последний час торгов принудительно закрывает все. Настройки советника Automatic lot calculation
Автоматический расчет лота Risk in automatic lot calculation

Советник основан на довольно интересной связке двух классических индикаторов: Аллигатор и Стохастик. Стохастик используется на более старшем таймфрейме для фильтрации направления, а сделки открываются по сигналам Аллигатора. Настройки советника Группа "Настройки торговли" lot размер лота new bar control включить/отключить явный контроль открытия нового бара Группа "Настройки Аллигатора" working timeframe
период
the period for calculating the jaws
период для расчета челюстей
horizontal disp

!! FLASH SALE !! Over 80% off !! For ONE week only. Now only $47 - normally $297! >>> Ends on 30 June 2023 - Don't miss it!
Buy and Sell Arrows when price breaks away from mean price. Sends Alerts – On MT5 To Your Phone To Your Email
Does not repaint .
Works on any Forex pair, any timeframe.
10 Activations allowed so you are free from limitations >> MT4 Version Here For spreads from a tiny 0.1 pips RAW/ECN Accounts, click here . Check out my Waka Esque EA signal here: >> High
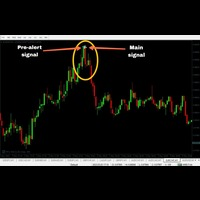
'Zoro PRO' is a reversal strategy based MT5 indicator with advance pre-alert system. Its an 100% non repaint indicator with an average accuracy of about 70-95% in any kind of market. (EXCEPT BAD MARKET AND NEWS TIME) MT4 version https://www.mql5.com/en/market/product/89772 PLEASE NOTE: MT4 version has more accuracy. Better avoid this MT5 version and go for the above link of MT4 version
Recommended Broker: Alpari, Amarkets, tickmill. Recommended pairs for M1
EURUSD
USDJPY
EURGBP
EURJ

ZigZag Expert is a robot that trades on the signals of the ZigZag indicator. The decision to enter the market is made by the signal of the trend system of the continuation model. See pictures and videos for more details.
Program input parameters: Choose tf - you need to specify the period for which the market will be monitored (recommended H4 and older); Depth of ZigZag - the first parameter of the ZigZag indicator (recommended from 4 to 8); Deviation of ZigZag - the second parameter of the Zi
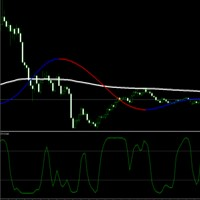
Scalping strategy using EMA, MavilimW and IFT-CCI indicators This is based on a strategy demonstrated by Traders Landing on Tradingview and referenced in the youtube video. MavilimW and IFT-CCI are custom indicators but the logic for thises is built into the expert and no additional files are required. EMA and MavilimW are used as trend filters. IFT-CCI is used as a trade entry trigger.
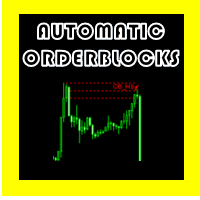
自动化订单块 OSW
(元交易者 5)
该指标负责根据一些预先制定的规则显示订单块,其中包括:
> 有一种冲动打破了之前的冲动。
>找到后,负责找到形成的烛台形态,以最有效的方式计算该位置的高低,创建Order Block的高低。
>创建 Order Block 后,Indicator 会不断检查是否有任何烛台穿过 Order Block 的上下线以产生警报信号,表明存在可能的信号。
>指标给出的信号不像任何策略那样 100% 有效,因此建议配合手动技术分析。
>生成 3 种类型的警报,发送到 PC、移动设备和电子邮件。
自动化订单块 OSW
(元交易者 5)
该指标负责根据一些预先制定的规则显示订单块,其中包括:
> 有一种冲动打破了之前的冲动。
>找到后,负责找到形成的烛台形态,以最有效的方式计算该位置的高低,创建Order Block的高低。
>创建 Order Block 后,Indicator 会不断检查是否有任何烛台穿过 Order Block 的上下线以产生警报信号,表明存在可能的信号。
>指标给出的信号不像任何策略那样 100% 有效,因此
MT4 Version
Advanced Daily Breakout
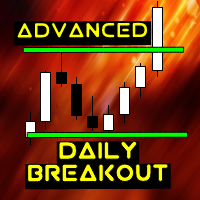
Advanced Daily Breakout allows you to trade session breakouts in an automatic way and with an accurate order and risk managing. This EA focuses on defining the session range and trading its breakout. You can let the trade run until the end of the session or keep a tight trailing stop loss (TSL) to catch as much as possible of breakouts' characteristic explosive price movements while protecting the trade if it turns out to be a fakeout. There are three main w
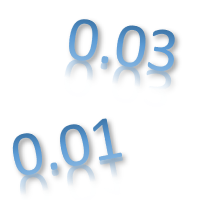
“面板部分平仓”实用面板用于快速部分平仓有利润的头寸。它只有两个参数:“ Partial closure #1 ”和“ Partial closure #2 ”。适用于任何符号和任何“幻数”——也就是说,该实用程序主要用于手动交易。 这个怎么运作: 例如,您在“EURUSD”、“Jump 100 Index”和“XAUUSD”(黄金)上有多个头寸。该实用程序找到利润最大的头寸 - 在屏幕截图中,这是“Jump 100 Index”交易品种的“卖出”头寸,交易量为 0.05 手,利润为 2.59。 第一个按钮将部分关闭 0.01 手(该值取自“ Partial closure #1 ”参数),第二个按钮将部分关闭 0.03 手(该值取自“ Partial closure #2 ”参数)。
Hello traders, Hypnos is a sophisticated scalper designed for the semi-night market, after a deep analysis prior to its internal functions, it manages to detect unique opportunities, cared for by a system with price control and news control. It should be noted that the analysis is strongly optimized to handle night trading at its best for slippage and spreads. 4 important factors Low Liquidity: During market closure, liquidity usually decreases significantly. Fewer participants in the market
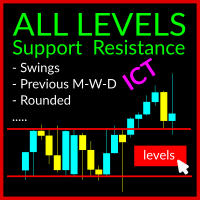
我们的ICT摆动水平支持和阻力指标是MetaTrader 5交易者的强大工具。它通过显示以下内容帮助识别市场中价格可能发生变化方向的关键水平: 图表上的摆动高点和低点 前一天,周和月的高点和低点 美国午夜开盘水平。 (ICT表示,在纽约午夜,机器人会重新初始化,并在白天,价格有很高的概率回到前一天的水平。) 当市场价格行动反转时形成的这些水平可以被视为支持和阻力,可以帮助交易者识别交易范围和潜在的入场和出场点。 该指标可用于所有对,包括外汇,加密货币,指数和商品,以及所有时间框架, ICT建议在更高的时间框架H4及以上使用此技术,因为时间框架越高,支持或阻力水平越强。 它还包括一个切换按钮,允许您在任何时候在图表上显示或隐藏这些水平,给您一个干净的图表进行分析,同时仍然快速访问重要的市场
PK Boom Crash Scalper RSI is an EA designed specifically for scalping Boom and Crash Indices on the M1 Timeframe. The EA uses the Relative Strength Index (RSI) indicator to open positions based on the Oversold and Overbought levels which can be adjusted to the users' preferences. Positions are opened after a spike or drop depending on the index being traded. NB: This EA, unlike my other EA's, doesn't come with optimized parameters. It's up to the user to set it up according to their preferred

EYeQ Indicator 是一个强大的工具,用于在 STEP INDEX、VOLATILITY 10、25、50、75 100、BOOM 和 CRUSH 上提供入场信号。
在 BOOM 和 CRUSH 300、500 和 1000 上捕获 SPIKES 更有效。
EYeQ 指标跨多个时间框架分析市场,并根据趋势找到最合适的切入点。您只需要打开桌面警报,以便在信号释放时收到通知。允许向其他便携式设备(如手机和平板电脑)推送通知,以获取在此类设备上进行远程交易的警报。
N/B:避免在 Boom 和 Crush 指数上使用它进行交易。此外,请注意该指标不提供退出点,如果在 MetaTrader 平台上每种工具的最低手数达到 3 美元的利润,您需要退出。
示例:最低手数;步骤索引-0.1
v75-0.001
v50-3
v25-0.5 同样适用于其余仪器
我们建议您将指示器安装在 VPS 上以获得实时信号警报。并始终记住将指标安装在 1 分钟时间框架图上。

A trend expert with a trained neural network. It works according to the strategy of averaging trading positions. Parameters Minus - decrease a take profit when opening a new order
InpStepMinus - take profit level decrease step for an order grid in points
TakeProfit - profit in points for the main grid of orders
StopLoss - limitation of losses in points
Distance - the distance to open th
Easily convert your candlestick patterns into signals!
Eval - Command interpreter - Command line interface - String converter - Customizable sign I bring one more indicator that was requested by a real trader. Thanks for the suggestion mate!
The String2Signal indicator will allow you to write your candlestick patterns and get the signals on the screen, integrating with EAs or using it to assist in manual operations. You type a text with your setup and the indicator converts it into the MQL5
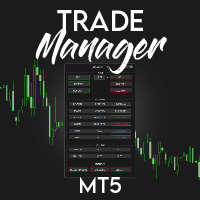
️ Discover the powerful Trade Manager for MetaTrader, a tool that will revolutionize your trading experience in the financial market. This innovative software provides you with efficiency and speed, allowing you to execute all your trades quickly and visually.
️ With just a click of a button, the Trade Manager creates three strategic lines: a blue line for order placement, a green line for take profit, and a red line for stop loss. These lines offer you a clear focus and enable you to manage

Karla Three is the final piece of the Karla series. It differs from Karla One & Karla Two in the strategy and symbols that it trades. It is a very complex piece of software that analyses each H1 candle of every symbol from the list and is capable of identifying rare patterns which are usually too difficult to spot for a human eye. Because such patterns have a high probability of repeating themselves, this EA will try to repeatedly catch them and monetize on them. To get the best results I traine

The most crucial price level in any "Volume Profile" is the "Point of Control" . Is the price level with the highest traded volume. And mainly, is the level where the big guys start there their positions, so it's an accumulation/distribution level for smart money.
The idea of the indicator arose after the "MR Volume Profile Rectangles" indicator was made. When creating the "MR Volume Profile Rectangles" indicator, we spent a lot of time comparing the volumes with those from the volume profile

交易員您好!
我介紹“先知”戰略, 它是為高勝率和長期穩定交易而選擇的 先知是眾多選擇中的一個,因為它是一種強調勝率重要性的策略,它是您會發現類似於 %100 勝率的少數策略之一,它基於內部算法諮詢多種策略因素,以便可以進行和圍欄適應市場 包含控制適當風險的所有必要保護措施僅適用於主要貨幣對 也實施隱藏
Prophet 針對“EURUSD , GBPUSD , EURCHF”進行了優化,它是相對於其他 RANGED 最穩定的貨幣,你可以找到自己的方式去其他符號,但建議使用我設計的那個 邏輯不是基於馬丁等,而是添加了可選使用 最需要關注的是算法檢測到高頻率的數據才有勝率 我的策略 EA 有實時歷史記錄
現場表演 如果你想要我的信號預設,私下問我只有我的客戶
https://www.mql5.com/en/users/aiotrading/seller
下個月價格 --> ??
我建議您在第一次復制時退出
建議與推薦的配對使用! (重要通知購買後,私下詢問我的設置,我會幫助您了解它是如何工作的,因此它可以完美地在您的帳戶上運行,您只需

Range Break Scalper is a forex robot designed to trade breakouts of predefined price ranges. The robot has several input parameters including Auto Lot Size, Max Auto Lots, Risk % of the account, Lot size, SL in range percentage, Target in range percentage, Allow Trailing stop, Trailing points, Range start time(Hours), Range start time(Minutes), Range duration(Hours), Range duration(Minutes), Range close time(Hours) and Range close time(Minutes). The Auto Lot Size parameter allows users to choos

This long-term trading system works on 3 pairs and on the H1 timeframe. It uses various trading systems such as trend trading, countertrend trading and a few others. This increases the chances of sustain
MT4 Version: https://www.mql5.com/en/market/product/90740 Signal of Gambit: https://www.mql5.com/en/signals/1800861
INPUTS FOR GAMBIT
Comment for positions: Enter your comment for orders here Magic number: magic number for orders Lots method: lot management method manual lots: use a st

MMD 的鑽石
MMD 的鑽石是一種高級指標,可識別對價格行為重要的位置。 該指標 - 在任何時間範圍內 - 檢測並標記圖表上的價格反應區域。 鑽石 - MMD 方法中知識金字塔的元素之一 - 是滿足非常嚴格條件的蠟燭。 鑽石主要有兩種類型: - 標準鑽石 - 逆轉癡呆症。 這兩種型號都會自動識別並標記在圖表上。 該指標可以標記鑽石,例如從 M5 區間到 H1 區間。 該指標的默認設置在您當前打開圖表的時間範圍內顯示菱形。
指標參數說明。 使用標準鑽石 - 顯示/隱藏模型 00100 中的鑽石 使用反轉鑽石 - 顯示/隱藏模型 0010100 中的鑽石 Diamond Time Frame - 一個選項,允許您指示顯示鑽石的時間間隔。 例如,可以使用 M1 或 H1 蠟燭圖在圖表上顯示 M5 區間的鑽石。 Diamond Look Back Bars - 指定蠟燭的數量 - 在給定的時間間隔內 - 將掃描 - 以搜索滿足為鑽石選擇的參數的蠟燭。 Min Diamond Range Points - 最小鑽石大小(以點為單位)。 Max Diamond Range Points -

This Robot detects when an statististical anomaly is present on the market an exploits its. It works better on currencies with low volatility but it performs relativellly well on high volatility pairs like EUR/USD and with indexes and commodities. Uses some indicators and its statistical properties to perform statistical arbitrage. Maximal drawdown 22%.(Backtesting) Instructions The bot needs 3 parameters to work: - Sigma (float) : size of the anomaly. A larger sigma means that the anomaly that

GBot is an Expert Advisor (EA) that uses sophisticated algorithms to trade on trends or reverse trends in the forex market. With four different algorithms to choose from, traders have the flexibility to customize the strategy to their specific needs and preferences. One of the standout features of GBot is its ability to work with multiple trading pairs, making it a versatile tool for traders looking to diversify their portfolio. While the bot is particularly effective with the XAU/USD pair, it c
This is very simple strategy based on martingale and reverse martingale strategy. When Ea keeps on winning it multiplies with winning multiplier ,when it has a loosing streak it multiplies with loosing multiplier. Whenever cycle goes from winning to loosing or vice versa the lot size will be reset to default one. This will keep the risk minimized as we are using it for both side. Also when we are in loosing streak we keep on changing the order type from its previous example. For detailed documen
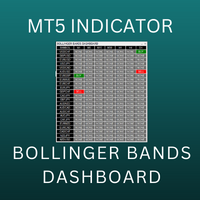
Bollinger Bands Multi Dashboard MT5 uses the value of Bollinger Bands indicator. This dashboard will monitor all symbols in the market watch. We can set up to receive an alert, notification or an email when the buy/sell signal appear on each timeframe. You can check all symbols via only 1 chart. This dashboard will check almost popular time frame (M1,M2,M3,M4,M5,M6,M10,M12,M15,M20,,M30,H1,H2,H3,H4,H6,H8,H12 and D1) in MT5. The colors can be customized. We can have a look at many pairs and many t

Lego Trading Advisor is a fully automatic trading advisor that uses RSI and MA indicators in its trading strategy. The trading advisor is completely safe for your account as it does not use dangerous strategies such as averaging, martingale, grid. Each open trade has its own stop loss and take profit, so if the trade fails, you will simply lose the predetermined risk in the stop loss. In the Expert Advisor, transactions can be controlled both by stop loss and by the time spent in the market;

To download MT4 version please click here . - This is the exact conversion from TradingView: "Trend Direction Force Index - TDFI [wm]" By "causecelebre". - The screenshot shows similar results from tradingview and Metatrader when tested on ICMarkets on both platforms. - This indicator uses multiple levels of averaging to detect trend strength. - You can optimize filter low and filter high levels to achieve best results. - You have access to buffers to use in EAs. - This is a light-load processin
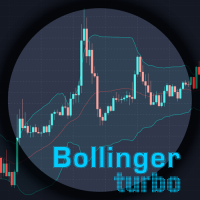
Советник основан на популярной стратегии и использованием связки из двух индикаторов: Bollinger Bands + RSI. Добавлена функция добавления новых позиций при определенной просадке. Количество добавляемых позиций и размер просадки регулируются. Описание настроек Группа "Настройки торговли" Lot Size
Размер лота
Drawdown
Просадка
TakeProfit
Тейк профит
Count
Счетчик доливок (не более 10)
New bar control Включение явного контроля открытия нового бара (для тестера) Группа "Настройки Bollinger B

Time Line by MMD is a simple indicator that supports historical data analysis and trading on statistical models that follow the MMD methodology.
Start Time - specifying the time when we start analyzing and playing the MMD statistical model Time Duration in minutes - duration of the model and its highest effectiveness (after the end of the line, the price returns - statistically - to the set level) Lookback days - the number of days back, subjected to historical analysis Base Time Frame - the b
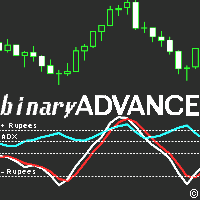
Update 2.2: Added MFI with predictive mod. Updated all indicators to reflect similar values, to combine multiple ones to rest well on overbought/oversold lines.
Update 2.3: Minor bug fixes.
Update 2.4: Removed buggy indicators DeMarker, and MACD, as it was too complicated and not as accurate as the rest due to it's nature. Added Awesome Oscillator. removed spreads, as it bogged the indicator down. Added other features, like indicator value compensators to match each other's levels when combined.
ABOUT THE PRODUCT
Your all-in-one licensing software is now available. End users are typically granted the right to make one or more copies of software without infringing on third-party rights. The license also specifies the obligations of the parties to the license agreement and may impose limitations on how the software can be used. AIM OF THE SOFTWARE
The purpose of this system is to provide you with a one-of-a-kind piece of software that will help you license and securely track your MT4/MT5
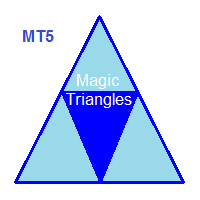
Magic Triangles is a tick Expert Advisor designed for simultaneous trading on three symbols of the FOREX market. The possible combinations of the financial instruments: SYMBOL 1 SYMBOL 2 SYMBOL 3 EURUSD EURJPY USDJPY EURUSD EURCHF USDCHF EURGBP EURUSD GBPUSD USDCHF USDJPY CHFJPY USDCHF EURCHF EURUSD AUDCAD AUDJPY CADJPY Symbols are choosed in accordance with the following principle of triangulation: SYMBOL_1=SYMBOL_2/SYMBOL_3, for example: EURUSD = EURJPY/USDJPY. Inputs First Symbol - first

Советник основан на классической трендовой стратегии "Моментум Элдера" Дополнительные возможности: Фильтр важных новостей Режим невидимки Возможность торговать по тренду Фильтр ложных пересечений сигнальной линии Моментума Отправка уведомлений в мобильный терминал о событиях Регулировка стандартной зеленой зоны (100 пунктов) и отрисовка её на графике Описание настроек: Группа "Настройки торговли" Lot
Размер лота
Profit-to-loss ratio
Отношение возможной прибыли к возможному убытку
Use stealth

Unleash the Power of Trading with the Boss Key Levels Indicator!
Are you ready to conquer the markets and elevate your trading prowess to extraordinary heights? Look no further! The Boss Key Levels Indicator is your secret weapon, designed to revolutionize the way you approach the financial markets and supercharge your trading strategy.
Harness the potential of Key Levels, those pivotal price zones that hold the key to market movements. With the Boss Key Levels Indicator, you gain access

It is important to read and understand the EA. Optimize for parameters. The EA does use stops and does not use martingales This is an original partial concept version, not the same but a concept of HFT HACKER: https://www.mql5.com/en/market/product/74421 HFT HACKER uses money management and is not so much about getting 1 pip and was built with machine learning. This EA will buy and sell capturing small moves. It needs to be trades on the best broker for small moves, like a direct access
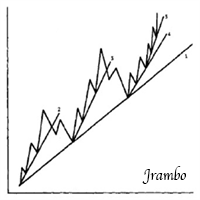
For : Forex, XAUUSD, XAGUSD,OIL Knowing the direction of a symbol (will it go up, go down, or have an oscillating trend?) but not knowing when to set up a position or control profits/losses, the EA is your best choice. The EA, a very suitable filter, is part of my trading system. It can simplify my transactions. For example, when I think the symbol will go up, I open the buy limit mode and let it start trading after parameter optimization. If I make a wrong judgment, the EA will minimize my los
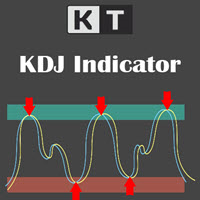
Basic technical analysis tools use signals during market changes by providing critical information that can influence investment and trading decisions. Several technical analysis tools are developed for this purpose, and one of the most popular indicators traders use the KDJ Random index. It's known as the Random Index, is primarily a trend-following indicator that aids traders in identifying trends and prime entry points.
Features
It analyzes and projects changes in trends and price patterns
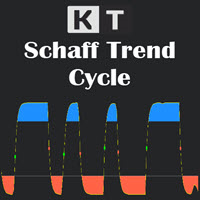
The Schaff Trend Cycle (STC) is a technical analysis tool that helps traders and investors plot highly-probable predictions on the price direction of an instrument. Due to its predictive properties, It's a good tool for foreign exchange (forex) traders to plot buy and sell signals. The Schaff Trend Cycle was developed by prominent forex trader and analyst Doug Schaff in 1999. The idea driving the STC is the proven narrative that market trends rise or fall in cyclical patterns across all time fr
MetaTrader市场是独有的自动交易和技术指标商店。
阅读MQL5.community用户备忘更多地了解我们提供给交易者的独特的服务:复制交易信号,自由职业者开发的自定义应用程序,通过支付系统完成的自动付款和MQL5云网络。
您错过了交易机会:
- 免费交易应用程序
- 8,000+信号可供复制
- 探索金融市场的经济新闻
注册
登录