适用于MetaTrader 5的EA交易和指标 - 97

KT Auto Trendline draws the upper and lower trendlines automatically using the last two significant swing highs/lows. Trendline anchor points are found by plotting the ZigZag over X number of bars.
Features
No guesswork requires. It instantly draws the notable trendlines without any uncertainty. Each trendline is extended with its corresponding rays, which helps determine the area of breakout/reversal. It can draw two separate upper and lower trendlines simultaneously. It works on all timefr
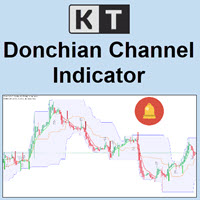
KT Donchian Channel is an advanced version of the famous Donchian channel first developed by Richard Donchian. It consists of three bands based on the moving average of last high and low prices. Upper Band: Highest price over last n period. Lower Band: Lowest price over last n period. Middle Band: The average of upper and lower band (Upper Band + Lower Band) / 2. Where n is 20 or a custom period value is chosen by the trader.
Features
A straightforward implementation of the Donchian channel

Please enable this site https://openexchangerates.org/ on webrequest options on Tools -> Options -> Expert Advisors
this utility has it's function as a updater of your's database with the currency conversions of the day, all the days, and all the Currency Pairs. My Expert Advisors and Indicators who make auto calculation to show the lot take this data to guide their calculation, in relation to a account currency and a pair curreny who isn't the same as the account. Sample account in USD and

KT Custom High Low shows the most recent highs/lows by fetching the data points from multi-timeframes and then projecting them on a single chart. If two or more highs/lows are found at the same price, they are merged into a single level to declutter the charts.
Features
It is built with a sorting algorithm that declutters the charts by merging the duplicate values into a single value. Get Highs/Lows from multiple timeframes on a single chart without any fuss. Provide alerts when the current

KT Absolute Strength measures and plots the absolute strength of the instrument's price action in a histogram form. It combines the moving average and histogram for a meaningful illustration. It supports two modes for the histogram calculation, i.e., it can be calculated using RSI and Stochastic both. However, for more dynamic analysis, RSI mode is always preferred.
Buy Entry
When the Absolute Strength histogram turns green and also it's higher than the previous red column.
Sell Entry
W

The indicator is a trading system for AUDUSD or NZDUSD currency pairs.
The indicator was developed for time periods: M15, M30.
At the same time, it is possible to use it on other tools and time periods after testing.
"Kangaroo Forex" helps to determine the direction of the transaction, shows entry points and has an alert system.
When the price moves in the direction of the transaction, the maximum length of the movement in points is displayed.
The indicator does not redraw, all actio

KT Forex Session shows the different Forex market sessions using meaningful illustration and real-time alerts. Forex is one of the world's largest financial market, which is open 24 hours a day, 5 days a week. However, that doesn't mean it operates uniformly throughout the day.
Features
Lightly coded indicator to show the forex market sessions without using massive resources. It provides all kinds of Metatrader alerts when a new session starts. Fully customizable.
Forex Session Timings I
Be sure to consult with me before buying.
The robot trades based on support and resistance levels. You can use weekly and monthly times for less risk. More risk in daily and 4-hour times. Be sure to disable the robot at news times.Works on all currency pairs, indices, commodities and metals. Only observing the trade at the time of news will make this robot profitable. Automatic news management will be added in future versions.
benefits:
Works on all instruments and time series,

Only 5 copies of the EA at $30! Next price --> $45 This robot works on the basis of bowling band and has stepped entrances at safe points.
benefits:
Works on all instruments and time series,
It has excellent inputs for position management that can avoid a lot of risk.
Input settings:
Volume: Selects a fixed volume for the trade that uses its own risk management if it is zero.
Risk for all positions: The amount of risk for all positions in one direction,

KT Risk Reward shows the risk-reward ratio by comparing the distance between the stop-loss/take-profit level to the entry-level. The risk-reward ratio, also known as the R/R ratio, is a measure that compares the potential trade profit with loss and depicts as a ratio. It assesses the reward (take-profit) of a trade by comparing the risk (stop loss) involved in it. The relationship between the risk-reward values yields another value that determines if it is worth taking a trade or not.
Featur

Trend Direction Up Down Indicator Trend Direction Up Down is part of a series of indicators used to characterize market conditions.
Almost any strategy only works under certain market conditions.
Therefore it is important to be able to characterize market conditions at any time: trend direction, trend strength, volatility.
Trend Direction Up Down is an indicator to be used to characterize trend direction (medium term trend):
trending up trending down ranging Trend Direction Up Down is ba

Trend Strength MA indicator Trend Strength MA is a part of a series of indicators used to characterize market conditions.
Almost any strategy only works under certain market conditions.
Therefore, it is important to be able to characterize market conditions at any time: trend direction, trend strength, volatility, etc.
Trend Strength MA is an indicator to be used to characterize trend strength:
Up extremely strong Up very strong Up strong No trend Down strong Down very strong Down extrem

Trend Direction ADX indicator Trend Direction ADX is part of a serie of indicators used to characterize market conditions.
Almost any strategy only work under certain market conditions.
Therefore it is important to be able to characterize market conditions at any time: trend direction, trend strength, volatility, etc..
Trend Direction ADX is an indicator to be used to characterize trend direction:
trending up trending down ranging Trend Direction ADX is based on ADX standard indicator.
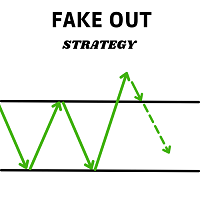
This expert advisor finds and operates the Fake out pattern, the search algorithm and its management can be adjusted from the Bot's configuration parameters.
Features: - Designed to operate with any type of asset.
- It is possible to set the time range in which the expert advisor will operate.
- Trailing stop managed internally by the algorithm.
- Partial position closing (partial profit taking), when the price has moved in favour of the position.
- Take profit automatically adjusted

The Analytical cover trend indicator is a revolutionary trend trading and filtering solution with all the important features of a trend tool built into one tool! The Analytical cover indicator is good for any trader, suitable for any trader for both forex and binary options. You don’t need to configure anything, everything is perfected by time and experience, it works great during a flat and in a trend.
The Analytical cover trend indicator is a tool for technical analysis of financial markets

According to Sir Isaac Newton's 3rd law, every action has its reaction and every movement must be compensated by an opposite movement of equal magnitude. The market cannot be oblivious to this physical principle, so when the force of gravity in the market of the big sharks hides like the sun behind the horizon, the night session allows us to see this law in all its splendor. This EA takes advantage of this movement to trade in the night session . Newton´s third law is designed to operate in the
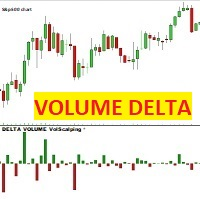
VOLUME DELTA Volscalping 该指标针对每根价格蜡烛绘制一个 Delta 蜡烛,即买入和卖出合约之间的差额。 如果买价(卖出)交易的合约超过卖价,蜡烛将是红色和负数,相反,如果卖价(买)交易的合约超过买价,蜡烛将是绿色和正数。
注意:该指标仅适用于提供真实市场数据流的经纪商,并将签订的合约分为 BID 和 ASK。 外汇、差价合约和加密货币属于合成市场,它们没有真实的市场数据流,因此该指标将不适用于它们。 AMP FUTURE 经纪商是提供真实市场数据流的经纪商,即使有模拟账户,也无需存款。 适用于在真实市场上交易的指数、商品、商品(例如 CME、EUREX、ICE ...)
VOLUME DELTA Volscalping 该指标针对每根价格蜡烛绘制一个 Delta 蜡烛,即买入和卖出合约之间的差额。 如果买价(卖出)交易的合约超过卖价,蜡烛将是红色和负数,相反,如果卖价(买)交易的合约超过买价,蜡烛将是绿色和正数。
注意:该指标仅适用于提供真实市场数据流的经纪商,并将签订的合约分为 BID 和 ASK。 外汇、差价合约和加密货币属于合成市场,
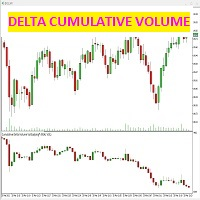
該指標檢測每根蠟燭的買價和賣價(侵略)合同之間的差異。
該指標在價格圖表下方的專用窗口中顯示蠟燭圖,蠟燭圖由買賣合約之間的差額精確給出,從而產生市場的成交量強度。
可以(從屏幕截圖中查看)如何僅選擇累積燭台 delta 圖表,甚至使用蠟燭本身的趨勢線:通過選擇第二個框 u “NONE”,不會繪製趨勢線,而通過選擇顏色,體積蠟燭的趨勢線將與它們一起出現在圖表上。
這個指標有什麼用?將價格圖表與體積delta圖表進行比較,您可以看到市場的真實實力,兩個圖表的收斂將確定價格的正確上漲/下跌,而價格與體積delta之間的背離必須是信號警報對於交易者來說,因為價格應該反轉。該指標必須與交易策略一起使用,以過濾虛假信號,消除出現在價格和數量之間背離階段的信號。
注意:該指標僅適用於提供真實市場數據流並劃分賣出/買入合約 (BID / ASK) 的經紀商。 CFD、FOREX 和 CRYPTOCURRENCIES 屬於合成市場,它們沒有真實的數據流,因此該指標不適用於這些工具- AMP FUTURE 是一家提供無存款且具有真實數據流的免費模擬賬戶的經紀商,該指標可在該賬戶上運行。
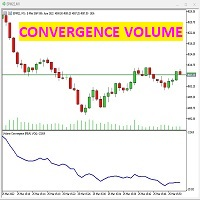
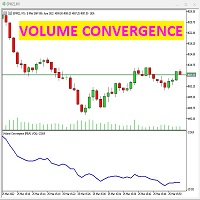
该指标显示实际成交量相对于价格的强度。 如果价格图表和成交量趋势具有相同的趋势,则表示一切正常。如果指标与价格图表背离,则意味着反转已接近。 当价格上涨而“成交量收敛”图下降时,意味着资金正在退出市场,卖家在上涨,价格应该很快就会开始暴跌。 相反,如果“成交量收敛”图上升而价格图下降,则意味着买家在下行方向买入,价格应反转上涨。 该指标必须与有效的交易策略相结合,以过滤相同的错误信号。
注意:该指标仅适用于提供真实体积数据流的经纪商,并在 BID 和 ASK 中分割合约。差价合约、加密货币和外汇属于合成的、不受监管的市场,因此它们没有这些信息,因此该指标不起作用。
AMP FUTURE 是与 mt5 兼容的经纪商,可在模拟账户上提供真实数据流,无需存款。

DreamlinerEA Live Results: https://www.mql5.com/en/signals/1459431
DreamlinerEA MT4 version: https://www.mql5.com/en/market/product/72691 DreamlinerEA is a fully automated Expert Advisor based on the author's trading strategy. During a period of low market volatility, when liquidity is not enough for the formation of a trend and breakdown of important levels, the system trades in the Channel and use small TP values (scalping) to quickly fix profit and re-enter the market, which sign
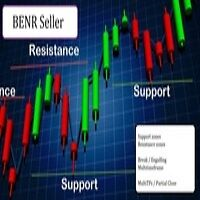
This EA allows you to manage support and resistance zones on MetaTrader 5…but not only: To your buying and selling zones (you can configure 2 sellings zones and 2 buyings zones),
you can add 3 options (2 with multiframes) to enter a position:
Option 1: this is the option that enters a position without a signal: as soon as the price reaches the zone, the robot sends a trade.
Option 2: here the robot will wait for a break in the selected timeframe. Example: you put your zones on an H4 graph
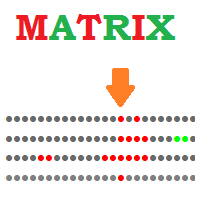
Matrix Indicator Matrix Indicator is a simple but effective indicator.
Matrix indicator displays usual oscillators indicators in a user friendly color coded indicator.
This makes it easy to identify when all indicators are aligned and spot high probability entries.
Inputs of indicator are:
Indicator: RSI, Stochastic, CCI, Bollinger Bands Param1/Param2/Param3: usual settings for the indicator ValueMin: Oversold level for oscillator ValueMax: Overbought level for oscillator The indicator
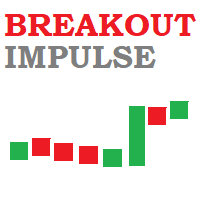
Breakout Impulse Indicator Breakout Impulse Indicator is a pattern recognition indicator for Forex, Stocks, Indices, Futures, Commodities and Cryptos.
The Breakout Impulse is a multi-bar pattern.
The purpose of the pattern is to identify a fast change in momentum.
This type of change can announce the start of a big directional move.
Inputs of the indicator are:
Distance : distance in pixel relative to top or bottom of candle to display the arrow symbol MaxBars : number of bars back u
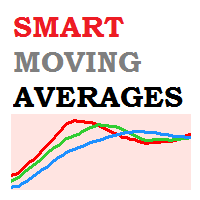
Smart Moving Averages Indicator Smart Moving Averages is an exclusive indicator for Metatrader platform.
Instead of calculating moving averages for the selected chart time frame, the Smart Moving Averages indicator gives you the opportunity to calculate moving averages independently from the chart time frame.
For instance you can display a 200 days moving average in a H1 chart.
Inputs of the indicator are:
Timeframe : timeframe to be used for the calculation of the moving average Perio
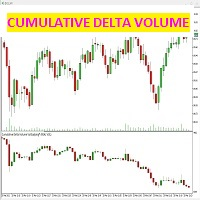
該指標檢測每根蠟燭的買價和賣價(侵略)合同之間的差異。
該指標在價格圖表下方的專用窗口中顯示蠟燭圖,蠟燭圖由買賣合約之間的差額精確給出,從而產生市場的成交量強度。
可以(從屏幕截圖中查看)如何僅選擇累積燭台 delta 圖表,甚至使用蠟燭本身的趨勢線:通過選擇第二個框 u “NONE”,不會繪製趨勢線,而通過選擇顏色,體積蠟燭的趨勢線將與它們一起出現在圖表上。
這個指標有什麼用?將價格圖表與體積delta圖表進行比較,您可以看到市場的真實實力,兩個圖表的收斂將確定價格的正確上漲/下跌,而價格與體積delta之間的背離必須是信號警報對於交易者來說,因為價格應該反轉。該指標必須與交易策略一起使用,以過濾虛假信號,消除出現在價格和數量之間背離階段的信號。
注意:該指標僅適用於提供真實市場數據流並劃分賣出/買入合約 (BID / ASK) 的經紀商。 CFD、FOREX 和 CRYPTOCURRENCIES 屬於合成市場,它們沒有真實的數據流,因此該指標不適用於這些工具- AMP FUTURE 是一家提供無存款且具有真實數據流的免費模擬賬戶的經紀商,該指標可在該賬戶上運行。

Automatic trend lines. Type 1. With two extremums. 1) From the current bar "go" to the left and look for the first (right) extremum point with the InpRightExmSide bars on both sides. 2) From the first point again "go" to the left and look for the second (left) extremum point with the InpLeftExmSide bars on both sides.

Traders Toolbox Overwatch - 是所有 Traders Toolbox 运行实例的监控实用程序。
它是一个简单的图表切换实用程序和所有 Traders Toolbox Running 图表的市场观察。
特征:
1. 可定制的按钮颜色、行和列。
2. 三种信号类型(持有 - 黄色 / 卖出 - 红色 / 买入 - 绿色)
3. 根据 Traders Toolbox 的新实例或已关闭实例动态更新按钮列表
4.单击按钮将相关图表带到前台。
5. 买入和卖出信号以与您的 Traders Toolbox 图表信号匹配的百分比显示其信号强度。
请注意:该实用程序只能与 Traders Toolbox / Traders Toolbox Lite 结合使用,不能独立运行。
单击此处加入我们自己的社交网络,通过 Traders Toolbox 交换有关交易的想法
我们还有一个推荐经纪人列表,可以在我们的链接树上找到。 Linktree here.

Magic Night is an automated trading system that uses a channel indicator and candlestick patterns to open and close trades.
Trades every day at a specific time.
Doesn't use grid, martingale or other dangerous money management methods.
Timeframe М5, currency pairs EURAUD, EURCAD, GBPCAD, GBPUSD Minimum deposit 70 usd.
Live signal https://www.mql5.com
Instructions for installing https://Blogs Magic Night
Download set files https://Sets Magic Night
Settings EA Order_Comment - Orde

Reborn is a trading robot that follows the trend and it is built on the Investment Castle Indicator . Traders can choose from different strategies built-in inside Reborn as follows: For Automated trading: SL and TP Kill and switch the direction of the next trades and recovering the previous trade closed in loss. Martingale Martingale with SL Kill and switch with martingale for switching the direction of the next series and recover the previous series as well. The Kill and switch is a game chang

It is a strategy throughout the history of trading. This since it uses a divergence between the RSI and the price. Many traders use this. The backtest is done in 4 hours, but it can work in other timeframes. It is a risk-benefit ratio of 2:1 since the stop loss is 50 pips and the target to be reached is 100 pips. All these values can be modified at the discretion of the trader. PARAMETERS: LotSize: Its use is recommended at 0.1 for accounts that operate full lots and 1 for accounts that operat

This indicator shows your daily profit for each chart. Please let me know in the comment section or via the MQL5 chat if you want find any problem, or if you want any specific features for this indicator. How to use:
Attach the indicator to the chart you want to see your profit. You can change the color of the indicators. (Currently positive figures are green, and negative are red) You can display the profit for pair it is attached, or for the whole account (all the pairs)

This EA is there to take your trade closing stress away. Quickly close as many trades as you have opened at the click of a button, INCLUDING PENDING ORDERS. This works on the MT5 platform whether it be currencies, Indices, stocks or Deriv synthetic indices. I have saved it under utilities as it is a utility, however, to install this, you have to save the file in you "EA" folder. That is; Go to "File", then "Open Data Folder", "MQL5" and then "Experts". Paste this file there. Restart MT5 and you'
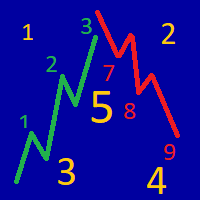
The indicator determines the strength of the trend and its possible reversal points, based on the author's arithmetic approach .
Each new peak or trough is a trend development. Such peaks and troughs are numbered so that the strength of the trend development can be seen. Attempts to change the trend are also numbered. This gives an understanding of a possible change in the direction of the trend. Indicator signals are generated when trying to change the trend .
In the settings, it i

Painel informativo para day trade. Funciona em conta NETTING ou conta HEDGE. Tem a possibilidade de separar as infomrações dos trades conforme o número mágico de cada EA. Foi desenhado para melhor funcionamento no mercado futuro da B3. Durante as operações, o painel faz a plotagem das linhas de preço, stoploss e takeprofit (gain). Possui informações de volume, preço médio, lucro e stops. Mostra o histórico de ganhos diário, semanal, mensal e anual.
Pin Bar Indicator
The Pin Bar indicator is a pattern recognition indicator for Forex, Stocks, Indices, Futures, Commodities and Cryptos.
The strategy that comes with the Pin Bar pattern is based on price action.
Inputs of the indicator are:
Distance : distance in pixels relative to top or bottom of candle to display the arrow symbol UseAlerts (true/false): enable alerts PopAlerts (true/false): enable alerts in the popup window EmailAlerts (true/false): enable email alerts PushAle
Engulfing Bar IndicatorEngulfing Bar indicator is a pattern recognition indicator for Forex, Stocks, Indices, Futures, Commodities and Cryptos.
The Engulfing Bar indicator is an enhanced pattern of the popular Engulfing Bar to keep only the best patterns produced in the market.
The strategy that comes with the Engulfing Bar is based on price action.
Inputs of the indicator are:
Distance: distance in pixels relative to top or bottom of candle to display the arrow symbol UseAlerts (true/
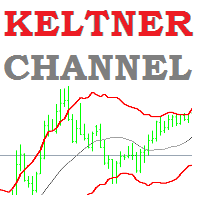
Keltner Channel Indicator Keltner Channel is an oscillator like Bollinger Bands.
Keltner Channel is a very good tool to time entries for your strategy.
Keltner Channel displays a channel where price is supposed to stay unless we are in overbought or oversold situations.
Various strategies use Keltner Channel indicator successfully to spot overbought / oversold situations and look for reversals.
Keltner Channel indicator uses ATR to determine overbought and oversold situations. Inputs of the

This EA is based on ADX strategy. Advantage: - Stable
- No grid martingale
- No scalper We recommend with following settings.
Symbol : XAUUSD
Period : 30M
Lot: recommend following rule: 100usd - 0.01 lots
1000usd - 0.1 lots or lower
2000usd - 0.2 lots or lower
10000usd - 1 lots or lower We do not recommend higher lots.
Need gold spreadless broker. Maybe VIP or Pro user with your broker.

Normalized Volume99% of indicators are based on price analysis.
This indicator is based on volume. Volume is overlooked piece of information in most trading systems.
And this is a big mistake since volume gives important information about market participants.
Normalized Volume is an indicator that can be used to confirm reversal points.
The indicator code volume with colors indicating high, normal and low volume.
You could enhance dramatically your trading system using volume analysis.

Fisher Kuskus Indicator Fisher Kuskus is an indicator used by scalpers on low time frames like M1.
The Fisher Kuskus is now available for Metatrader platform.
Inputs of the indicator are:
Period : period to be used for calculation of the indicator PriceSmoothing : value of 0.0 to 0.99 IndexSmoothing : value of 0.0 to 0.99 The indicator can be used with any time frame.
It can be used with any class of assets: Forex, Stocks, Indices, Futures, Commodities and Cryptos. Other indicators for
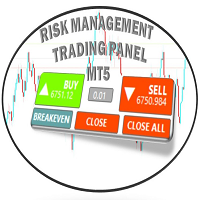
Risk Management Trading Panel calculates the volume of a position based on Account Balance , Currency , Currency Pairs , Synthetic Indices (Deriv Broker) once the user places stop-loss level ,and risk tolerance (set in percentage points of current balance). It also Displays reward/risk ratio based on take-profit and it shows recommended risk per trade based on current balance.
Trailing Stop your positions and Applying Breakeven with a push of a button has never been easier and you can also set

This EA is based on Supertrend strategy. Advantage: - Always trade with stoploss
- Stable
- No grid martingale
- No scalper We recommend with following settings.
Symbol : US100 or US30
Period : 1H
UseDynamicStoplose: true Lot: recommend following rule:
100usd - 0.01 lots
1000usd - 0.1 lots or lower
2000usd - 0.2 lots or lower
10000usd - 1 lots or lower We do not recommend higher lots.
And we do not recommend broker. When run our robot, please test wit

Elasticity - it is a Secure Automated Software for trade Forex market and indices.
This EA modifies the distances depending on the market situation, being able to shorten or increase the distances depending on how the algorithm reads the market.
The system operates market breaks. Looking for the market point of greater efficiency ris/ benefit , to minimize the risks of margin call. The system uses two different algorithms, one to follow the trend and the other to operate market pullbacks

Inside Bar IndicatorInside Bar is a very popular candlestick pattern.
Inside Bar indicator can be used to trade Forex, Stocks, Indices, Futures, Commodities and Cryptos.
The Inside Bar indicator will search for inside bar candles pattern in the chart and will generate display them.
The indicator is also able to generate alerts in your screen or sent to your phone.
Inputs of the indicator are:
Symbol: type of char symbol to be displayed in the chart to show Inside Bar patterns CustomCode:

JUST EURUSD M5 !!
That´s it! Just attach this EA to EURUSD M5 Chart and let it trade yourself. Based on a particular strategy, this EA follow trends and trades according to it. You can configure some parameters, such as lot size, magic number, spread, number of opened orders, takeprofit, stoploss, trigger filter, trade out system and a calendar trade filter. Takeprofit and Stoploss can be fixed in points (10 x pips). Please PM if you have some doubt.

It's a multi-symbol and multi-timeframe scanner for our indicator - ACB Breakout Arrows . With default settings, it scans for the buy/sell signals on 28 currency pairs and 9 time-frames concurrently.
Features
It can scan 252* combinations of symbols and time-frames from a single chart. Open the signal's chart loaded with a predefined template with a single click. Easy drag n drop anywhere on the chart. Real-time alerts with popup, sound, push-notifications and email alerts.
Input Para

This EA is based on momentum strategy. It passed 10 years backtest without huge dropdown and profitable. From today your money does not sleep and rise every week. Advantage:
- Always trade with stoploss
- Stable
- No grid martingale
- No scalper We recommend with following settings. Symbol : US100
Period : 1H
UseDynamicStoplose: true Lot: recommend following rule: 100usd - 0.01 lots
1000usd - 0.1 lots or lower
2000usd - 0.2 lots or lower
10000usd - 1 lots or

The utility is designed to save funds on your trading account. There is support for three levels of minimum equity and free margin. For each level, you can set partial (by a certain percentage) or complete closing of all market orders. The partial close percentage is applied for each order separately based on its current size (i.e. the size at the time the equity or free margin reaches the appropriate level). Upon reaching the last third level, the utility can close all charts, which will make i

· Bandas Bollinger & RSI En este producto se utiliza una estrategia de trading con uno de los indicadores comúnmente utilizados en el mercado, esto en conjunto con una sólida experiencia del mercado en la que se observa el posible cambio de tendencia debido al toque de las bandas bollinger. A su vez tiene que fijarse en el indicador RSI. Por otro lado, el Take Profit así como el Stop Loss no tendrán que posicionarse ya que el algoritmo viene diseñado para que el Take Profit se fije en

At first, I got my teeth into Phoenix Ultra Expert Advisor.
This Expert Advisor will support automatic close order if the direction is correct and perform recovery if the direction is wrong. If you enter an order: 1. The price goes in the right direction and hits the Min Profit Point , trailing stop 20% of the current profit. 2. The price goes in the opposite direction, the Expert Advisor will place the order with the volume is Recovery Volume Percent at the input, the distance to enter
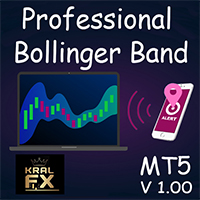
KF-BB
Professional Bollinger Bands with Alert.
Bollinger bands available in the market are mostly drawn based on simple moving average . KF-BB is the first bollinger bands that can draw the center line using all the usual methods simple , exponential, etc. A very professional indicator, it does not end here other advantages of this indicator include creating an alarm on the desktop and the mobile phone When the candlesticks hit one of the center lines or the upper and lower bands
Features in

Element is a Forex arrow indicator that implements a kind of technical analysis based on the idea that the market is cyclical in nature. Follows the market trend with good reliability, ignoring sharp market fluctuations and noise around the average price. Thus, all intersection points will be optimal points at which the movement changes taking into account the indicator period. It catches the trend and shows favorable moments of entering the market with arrows. Displays signals simply and clear

The Signal Sunrise channel indicator automatically builds a trend movement support channel. The price is in its trend movement in a certain range, and not a chaotic spread of the price is unclear in which direction. And if the price deviates within a certain range, then this means that the boundaries of these ranges are support and resistance lines and form a channel.
It is no secret that the wave theory, like many others, is based on observations, however, one of the most important patterns

Fixation of the Result is a trend indicator, a technical analysis tool that helps determine the exact direction of a trend: either an up or down price movement for a trading pair of currencies. This indicator, although a little late, is still the most reliable signal that a trader can safely focus on. Determining the market trend is an important task for traders.
The indicator is used in the forex markets. One of the main definitions for monitoring the currency market is a trend, which is why

Passage Victorious is a handy tool, and even if you are used to trading on a clean chart, sometimes you need to take a look at this indicator. If you are not sure how to determine the trend inflection point and are concerned about how to draw trend lines then this indicator is for you. From now on, you do not need to sit near the computer and analyze the price, just use this indicator.
The indicator calculates saturation levels of the price chart. A signal to exit the oversold area is a buy s

The indicator "JAC Trend Color Candle" for Meta Trader 5, was created to visually facilitate the trend for the trader. It is based on three parameters, which identifies the uptrend, downtrend and non-trending market. The colors are trader-configurable, and the average trader-configurable as well. trend parameters cannot be configured as they are the indicator's differential.

1. 这是什么 这是一个用于实时显示资金曲线的工具。MT5软件的历史订单只有表格的,当你的订单很多时,它看起来很麻烦。这个程序可以把你的历史交易订单以资金曲线图的形式画出来。这样你可以一目了然自己的交易水平怎么样,以及在哪里地方出的问题。 同时,MT5的策略回测虽然有资金曲线图,但是它并没有与价格一一匹配。所以使用起来非常麻烦。这个程序让价格曲线与资金曲线一一匹配,使用非常方便。 2. 特色 可以 把你的历史交易订单以资金曲线图的形式画出来,它可以根据不同的时间框画出不同的资金曲线。 它可以用于策略回测,用于实时显示你的EA策略怎么样。 它分为 三条资金曲线 。一条为仅显示做多,一条为仅显示做空,一条为包括所有。 以指标形式编程,不影响叠加其他的EA或指标。 3. 参数说明 InitDeposit = 5000; // Initial Deposit Inp_StartTime = 0; // History start time, 0 - all time Inp_ProfitNorm = false; // Is corrected position to 1.0 lots, de
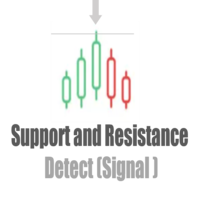
The indicator, Support and Resistance Detect Signal automatically detects support and resistance levels and trend lines, emitting a signal whenever the condition is met, as configured.
It reads support and resistance drawn manually or automatically built into the chart by other external indicators.
Note: Support and Resistance Detect Signal is compatible with almost all external indicators that draw on the chart, support and resistance levels, in addition to trend lines.
Discover
The indicator, Support and Resistance Detect Signal automatically detects support and resistance levels and trend lines, emitting a signal whenever the condition is met, as configured.
It reads support and resistance drawn manually or automatically built into the chart by other external indicators.
Note: Support and Resistance Detect Signal is compatible with almost all external indicators that draw on the chart, support and resistance levels, in addition to trend lines.
Discover our Elit
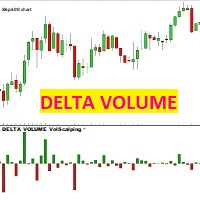
VOLUME DELTA Volscalping 该指标针对每根价格蜡烛绘制一个 Delta 蜡烛,即买入和卖出合约之间的差额。 如果买价(卖出)交易的合约超过卖价,蜡烛将是红色和负数,相反,如果卖价(买)交易的合约超过买价,蜡烛将是绿色和正数。
注意:该指标仅适用于提供真实市场数据流的经纪商,并将签订的合约分为 BID 和 ASK。 外汇、差价合约和加密货币属于合成市场,它们没有真实的市场数据流,因此该指标将不适用于它们。 AMP FUTURE 经纪商是提供真实市场数据流的经纪商,即使有模拟账户,也无需存款。 适用于在真实市场上交易的指数、商品、商品(例如 CME、EUREX、ICE ...)
VOLUME DELTA Volscalping 该指标针对每根价格蜡烛绘制一个 Delta 蜡烛,即买入和卖出合约之间的差额。 如果买价(卖出)交易的合约超过卖价,蜡烛将是红色和负数,相反,如果卖价(买)交易的合约超过买价,蜡烛将是绿色和正数。
注意:该指标仅适用于提供真实市场数据流的经纪商,并将签订的合约分为 BID 和 ASK。 外汇、差价合约和加密货币属于合成市场,
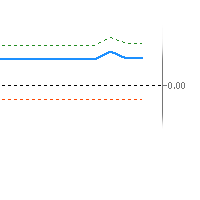
An imbalance indicator that marks imbalance on the chart with zones and gives the amount of imbalance as an oscillator value. There's one line for the amount of short imbalance, one line for the long imbalance and the combined imbalance as a thicker line. The combined imbalance goes above 0 if there's more imbalance above than below the current price and vice versa. The blue thicker line, shows (imblance above - imbalance below). The greeen dotted line shows imbalance above The red dotted line s
This is Boleta Long & Short NT-HDG, an Expert Advisor created with the function that will make operations carried out in Long & Short much easier.
> With just one click it is possible to mount a position in two assets simultaneously, further accelerating your actions right after the decision has been made.
> With it, it is also possible to operate in Hedge accounts, being able to set up positions in the same asset, for those who have strategies for this purpose.
> Can be used in multiple

三角形图案的图案浏览器,例如对称三角形、不对称三角形或直角三角形,楔形图案,例如上升楔形或下降楔形,扩展图案和趋势通道
该指标探索历史模式以及当前模式,对于那些试图通过手动绘制趋势线或三角形来节省时间并希望将其用于自动分析在图表上绘制最佳模式的人来说,它是最佳指标
特征 :
- 用于立即更改 ZigZag 扩展深度以调整并找到最佳模式的面板
- 将模式转移回之前的之字形柱以探索过去发生的事情,您可以探索趋势线是否受到尊重,了解价格走势
并通过探索以前的历史模式,使用该指标分析和学习它们,得出一个总体策略
- 从切换按钮立即从趋势通道或趋势线切换到楔形或三角形模式
- 暂停以冻结模式,因此模式不会改变并继续检查价格触摸以获取警报
- 触摸级别的多种类型的警报:邮件、推送、终端和打印通知
- 通过调整点启用早期警报,以便您在价格接近水平时提前收到警报并准备入场
- 趋势通道:启用/禁用上、中或下线警报
- 目标:对于三角形和楔形,它会自动设置目标,这是您必须买入卖出的有趣区域,如果您是突破交易者,您可以在那里预订利润或等待价格行动进行反转交易

Reservoir is a reversal indicator and is part of a special category of instruments. The indicator not only analyzes the price movement, but also indicates the points of possible reversals. This contributes to the quick and optimal opening of buy or sell orders (depending on the current situation). In this case, the historical data of the analyzed asset is necessarily taken into account. It is the correct implementation of such actions that in many ways helps traders make the right decision in t

EA Black Wolf initiate a cycle of buy or sell depending of the trend of a built-in indicator, thus the EA works according to the "Trend Follow" strategy, which means following the trend. Recommend pairs EURUSD,GBP USD, EURAUD,AUDJPY,GBPAUD,CADJPY
Time Frame M15
Recommend deposit 1000 usd or 1000 cents Recommend settings Default SETTINGS Lot type - lot type calculation (can be Constant, based on risk or Constant size per 1000) Lot size - lot size Trade Buy - allow the adviser to buy Trad

T Trader Expert #advisor
works very well on all Pairs and all Frames. Is fully automated and based on the tick to filter as many as possible winning trades. ===============================================================================================
This Robot is fully automated and has been created for everyone. The Robot works also on cent accounts. =============================================================================================== => On the lower Frames there are too many s

Crypto.com 到 MT5
从 Crypto.com websocket 到 Metatrader 5 的实时烛台流
它是 OHCLV(高开低收真实交易量)实时汇率数据
交易者,如果在一分钟图表中,OHLC 数据不正确,那么它可能会在技术图表研究中给出错误的分析,该产品确保它提供实时准确的数据,有助于手动分析
您可以在我的个人资料中查看我的其他加密产品 https://www.mql5.com/en/users/rajeshnait/seller
1. OHLCV 数据
2.支持和创建多个符号
3. 您需要添加 Crypto.com websocket 和 api URL,如工具 > 选项 > 允许来自 URL 选项卡的 Webrequest 并勾选 Allow Webrequest 复选框
- Websocket URL:stream.crypto.com
- API URL:api.crypto.com
4. 图表绘制于 GMT+0 时区(Crypto.com 的服务器时间)
5. 不进行 DLL 调用
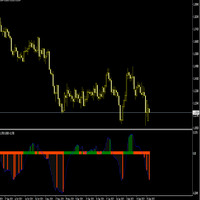
The Slope indicator measures the slope of a linear regression , which is the line of best fit for a data series. A 20-period Slope, therefore, measures the slope of a 20-day linear regression. ... In general, a positive slope indicates an uptrend, while a negative slope indicates a downtrend. How do you use slope Indicator?
By applying the slope indicator to both the price chart and the price relative , chartists can quantify the price trend and relative performance with one indicator. A po
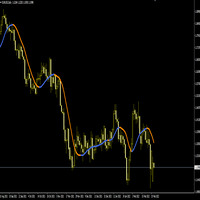
The Hull Moving Average (HMA) attempts to minimize the lag of a traditional moving average while retaining the smoothness of the moving average line. Developed by Alan Hull in 2005, this indicator makes use of weighted moving averages to prioritize more recent values and greatly reduce lag. The resulting average is more responsive and well-suited for identifying entry points. For more information, welcome to our Telegram Group. https://t.me/InfinXx
学习如何在MetaTrader AppStore上购买EA交易,MetaTrader平台的应用程序商店。
MQL5.community支付系统支持通过PayPay、银行卡和热门付款系统进行交易。为更好的客户体验我们强烈建议您在购买前测试EA交易。
您错过了交易机会:
- 免费交易应用程序
- 8,000+信号可供复制
- 探索金融市场的经济新闻
注册
登录