适用于MetaTrader 5的EA交易和指标 - 85

This is a derivative of John Carter's "TTM Squeeze" volatility indicator, as discussed in his book "Mastering the Trade" (chapter 11).
Black crosses on the midline show that the market just entered a squeeze ( Bollinger Bands are with in Keltner Channel). This signifies low volatility , market preparing itself for an explosive move (up or down). Gray crosses signify "Squeeze release".
Mr.Carter suggests waiting till the first gray after a black cross, and taking a position in

这个 DYJ PowerSignalProfessionally 是一个完整的基于ATR技术指标的交易系统。这些指标将记录每个时间框架和分析的货币对中每个力量趋势的当前状态。 DYJ PowerSignalProfessionally 通过评估这些数据,专业地创建一个趋势强度和进场点信号列表显示。如果有任何一对完全符合,将弹出一个警报指示这种情况。列表数据包括Symbol、M5 MN1、BuyPercent、SellPercent和LastEntry。LastEntry显示入口点(周期、价格、时间)。当趋势强度大于75%时,认为是强势货币对。
该指标还可以分析各品种的趋势反转点时间和最佳入场价格。 它能自动打开有新趋势的某个品种的图表窗口. 它可以显示一条白色的垂直时间线和一条白色的入场价格水平线 。
输入参数 Periods = 14-indicators Periods. Text Color = While - 常态文本颜色。 Buy Signal color = LawnGreen - 多头信号颜色。 Sell signal color = Orange

Identify Engulfing candle pattern with Arrows & Alert ( built-in RSI filter). This indicator helps you to identify Engulfing candle pattern or Outside bar (OB) on the chart with arrows, along with an alert when a new Engulfing candle appears. Engulfing candle pattern is one of the most important reversal Price Action signals. You can choose between standard Engulfing (Engulfing based on candle body) or non standard Engulfing (Engulfing based on candle high - low )
Alerts can be turned on
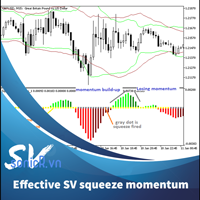
Introduced by “John Carter”, the squeeze indicator for MT5 represents a volatility-based tool. Regardless, we can also consider the squeeze indicator as a momentum indicator, as many traders use it to identify the direction and strength of price moves. In fact, this squeeze indicator shows when a financial instrument is willing to change from a trending market to another that trades in a considerably tight range, and vice versa. Moreover, it indicates promising entries as well as exit points For

The RSI2.0 indicator uses normalized price data and signal processing steps to get a normal distributed oscillator with no skew (mean is zero). Therefore, it can give much better reads than the traditional RSI. Areas/Levels of reversal: Overbought or oversold levels from traditional RSI have no statistical significance, therefore the standard deviation bands are implemented here, which can be used in similar way as possible reversal points. Divergence: As the indicator is nearly normal dist

It is a secure automated market trading software. The architecture is a fully automatic autonomous expert robot capable of independently analyze the market and make trading decisions Efficient. It is an advanced and professional trading system.
Requirements Supported currency pairs: CADJPY,GBPCHF,AUDJPY,USDCHF,EURCAD,EURNZD,NZDJPY; Best Pair CAD/JPY; Timeframe: H1; The EA may not be sensitive to spread and slippage. I advise you to use a good broker convenient for you; The adviser must work c

The Accumulation / Distribution is an indicator which was essentially designed to measure underlying supply and demand. It accomplishes this by trying to determine whether traders are actually accumulating (buying) or distributing (selling). This indicator should be more accurate than other default MT5 AD indicator for measuring buy/sell pressure by volume, identifying trend change through divergence and calculating Accumulation/Distribution (A/D) level. Application: - Buy/sell pressure: above

Panel for send/modify orders/positions by handle moved levels for take profit, stop loss, open price and expire at with lot calculations in several modes. Settings: Risk management Lot calculation mode: default: Free margin, Modes: Fixed, Free margin, Equity, Balance Minimal lot size - default: 0.01 Maximal lot size - default: 0.1 Fixed lot - default: 0.01 Percents - default: 5 Trade when have free margin (0 - disabled) - default: 30 Levels Style - default: Dash Width - default: 1 Panel Positio

Lets dabble a bit into Elliot Waves.
This is a simple indicator which tries to identify Wave 1 and 2 of Elliot Impulese Wave and then projects for Wave 3.
Ratios are taken from below link: https://elliottwave-forecast.com/elliott-wave-theory/ - Section 3.1 Impulse
Wave 2 is 50%, 61.8%, 76.4%, or 85.4% of wave 1 - used for identifying the pattern. Wave 3 is 161.8%, 200%, 261.8%, or 323.6% of wave 1-2 - used for setting the targets
Important input parameters
MaximumNumBars : To calc

The CashFlow EA works on the principle of the breakout strategy.
Introductory price 99 USD , future price 149 USD.
Description: Through stop orders, the breakouts of highs and lows, are traded. Through the adjustable trailing stop, profits are taken as high as possible and the losses as low as necessary.
It is strongly recommended to trade with a broker that offers a low spread and commission.
Please be responsible with your trading capital and only use money that you can afford to los

Торговля парами включает в себя поиск активов с высокой степенью корреляции. Цены на эти активы имеют тенденцию двигаться вместе. Когда цены отклоняются друг от друга; например, один падает, а другой нет; это создает потенциальную сделку возврата к среднему. Это также иногда называют статистическим арбитражем . Минимальное количество настроек. 1. Выбор пар 2. % Профита 3. Усреднение отклонения цены
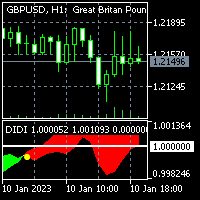
To get access to MT4 version please click here . - This is the exact conversion from TradingView: "Didi Index" by " everget ". - This is a popular version of DIDI index on tradingview. - This is a light-load processing and non-repaint indicator. - Buffer is available for the lines on chart and arrows on chart. - You can message in private chat for further changes you need. Thanks for downloading

Overview: The news bot places a buy and sell trade at the same time before economic news is released, when spreads are low. Minutes before the news, the bot places stop loss orders on both trades and adjusts them based on real-time market movements. As the news approaches, the bot stops adjusting the stop loss orders and allows them to be triggered by the market. Depending on the impact of the news, one stop loss order may be triggered and the corresponding trade closed, while the other trade re

Forex Fighter 是一种先进的多货币系统,可交易以下符号:EURJPY、GBPCHF、EURGBP、USDCAD、AUDNZD、USDJPY 和 AUDCAD。 该策略基于我自己开发的内置指标。 Forex Fighter 遵循重复的独特模式,但人脑通常无法捕捉它们。 这里的决策者是两个神经网络,它们必须就是否进行特定交易达成一致。 重复模式的概率必须高于 85%,然后才能进行交易。 该专家顾问不断扫描图表以寻找有利可图的交易,因此建议在质量不错的 VPS 上全天候 24/7 进行交易。
关于 EA: 它遵循经常重复的模式 内置了我自己开发的独特指标 在两个神经网络上运行 在 EURJPY H1 图表上运行
现场信号: https://www.mql5.com/en/signals/1822829
输入: 所有输入都按部分分类。 在第一个中,您可以更改幻数、注释和符号。 我强烈建议不要添加任何符号并保留默认符号。 尽管您可能会通过添加额外的交易品种获得一些交易,但它们将是随机的,这可能会毁掉您的账户。 在第二部分,您可以选择 EA 交易的时间。 我的建议是

Moving Level , Special indicator for hunting trends and scalping! programmed to use it in any temporality, It has the trend volume strategy by marking an arrow if it is long or short accompanied by the colors blue yellow and red when it marks the yellow line with the arrow pointing up and is accompanied by blue lines, it is an uptrend When it marks the down arrow with the yellow line and is accompanied by red lines, it is a downtrend. It is used in the synthetic index markets in all pairs, It is
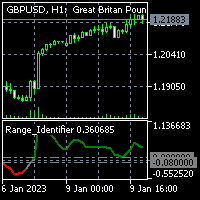
To get access to MT4 version please click here . - This is the exact conversion from TradingView: "Range Identifier" By "Mango2Juice". - All twelve averaging options are available: EMA, DEMA, TEMA, WMA, VWMA, SMA, SMMA, RMA, HMA, LSMA, Kijun, McGinley - This is a light-load processing and non-repaint indicator. - Buffer is available for the main line on chart and not for thresholds. - You can message in private chat for further changes you need.
The utility for managing open positions can work with stops (take profit and stop loss) in money, percentages or points. The built-in trailing stop starts working from profit, the size of which can be set in currency or as a percentage. Trailing stop can work in three modes and for five instruments. With the help of the built-in trading simulator, you can check how the utility works in the strategy tester. Benefits setting stop loss and take profit in the deposit currency, as a percentage of the

Sniper rank, It has a gang programmed to hunt down perfect tickets. It has two lines that are used to hunt perfect pivots when the sails of the band come out, They work for all pairs of synthetic indices, perfect for volatility and jumps It also serves for marking forex, it operates in all pairs It is used for scalping and higher temporalities! Perfect Profit!!!!

An Ultimate Tool for quick and efficient market analysis. Unique combination of solid indicators defining market direction for trend tracking and filtration designed for you to stay on the right side of the market.
Market Rider Oscillators gives you access to one of the most used from professional trades indicators on worldwide, which were not build in for MT4 and MT5 terminals . These are unique non-repainting oscillators designed to be used on all time frames for all instruments class

An Ultimate Tool for quick and efficient market analysis. Unique combination of solid indicators defining market direction for trend tracking and filtration designed for you to stay on the right side of the market.
Market Rider Tools gives you access to one of the most used from professional trades indicators on worldwide, which were not build in for MT4 and MT5 terminals . These are unique non-repainting indicators designed to be used on all time frames for all instruments classes: Fo

Critical Trading, Currency Strength This indicator allows for viewing true value changes in the 8 major currencies, this ability has many applications for simple and advanced forex trading. No need to switch to inaccurate 3rd party applications or websites. Trend catching: No need to watch 28 charts, pair up the strongest and weakest performing pairs. Optimize entries: Show the currencies of your current chart and enter on reliable pullbacks for further confluence on your trades. Currency perfo
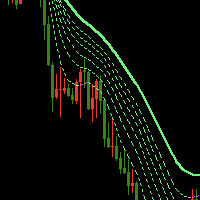
指标简介 指标改根据移动平均线设计而成,该指标没有未来函数,不漂移。 该指标有7条颜色线,形成瀑布状分布图,当趋势线上涨时候,颜色为洋红色,当趋势线下降时,颜色为草绿色,根据趋势线颜色判断市场趋势,当粗线和六条虚线趋势方向一致且向上或者向下发散开的时候,出现强劲的趋势概率较大,可以用该指标设计基于趋势的新EA,也可以根据该趋势线指标设计均线回归策略,当价格偏离此均线过远,且k线上涨过快,可以预见价格回归均线的概率较大,此时可以采取回调交易开单。 该指标具有报警功能,当粗趋势线颜色变化时候,它能够发送邮件和massages到手机客户端,同时在电脑图表窗口发送Alert警报,不用一直盯盘也可以即时获得信号提醒,每次消息提醒重复次数可以手动修改,三种类型消息提醒可以手动关闭或打开。 它适用于所有时间框架,任何交易品种。 指标的信号如图所示,在MT5客户端下载该指标进行回测可获得同样效果。

The problem with trading candlestick patterns becomes obvious, after some experience in live markets. Hypothetical branching of candlestick patterns, are not necessary for successful trading. As a Price action trader, my principle is to keep things simple and consistent. My focus is on buying and selling pressure, which is visible in market structure. Trade Management and discipline are my secondary core elements. This indicator detect 4 Simple but Effective Price action Patterns! Yellow = Insi

The EA MuliIndy Swing Trade uses a swing trade system + martingale system + neural network system + indicator strategy (AWESOME OSCILLATOR (AO),STD,ATR) working together to find the best profit and low drawdown for trading. using historical data statistics probability. Let's give the weight of each indicator, which gives good results when the graph fluctuates up and down. without looking at trends alone For EURUSD M15 best default setting EA, it can be used Optimization Backtest to trade other

The EA Trend Pivot Point uses pivot values to choose a buy or sell trade and uses two indicators, STD and ATR, to measure market volatility and choose if market volatility is high not to trade. If the market volatility is less, then trading is allowed. Use pivot point calculations alone for probabilistic weighting of 10 AI pivot values. Based on a 20 year retrospective data backtest Resulting in the weight of this pivot value, for default it is for trading EURUSD Timeframe M15 which user can fin

The EA MultiIndy Hybrid Trend used to a trading system that combines 11 indicators 1. BOLLINGER BAND 2.RSI 3.MA 4.AO 5.MACD 6.CCI 7.MOMENTUM 8.FRACTAL 9.PARABOLIC SAR 10.STD 11.ATR and then AI to find the probability of each indicator as its weight value. Common use of martingale Then backtest twenty years to become this automated trading system. EA can send alerts through the program line, can adjust the risk. or turn off the martingale according to user requirements or can trade any currency

The EA AI Trend Price Action uses a trading strategy of Price Action and AI combined with Martingale The results of the backtest data 2003-2023. Using 100% reliable tick data, choose safe trades with very low risk even with martingale. But limiting the risk, not too high which can be set by the user himself as well. Requirements Supported currency pairs: EURUSD Timeframe: M30 The minimum deposit is $200 for a 1:400 leverage

Swing Trade MA is auto trading Use a system of MA Fast crossover with MA Slow and in the AI(neural network) to measure the probability weights of 10 MA lines and using the Martingale system. Backtest tick data 100 % from 2003-2023 by default setting trading EURUSD Timeframe M15. Requirements Supported currency pairs: EURUSD Timeframe: M15 The minimum deposit is $5 00 for a 1:400 leverage EXPERT DESCRIPTION Variable Description Stop Loss Stop Lost Take Profit Take Profi

Gāi zhǐbiāo yòng yú jiāoyì fánróng hé bēngkuì, shì chāojí qūshì zhēntàn. Dāng shìchǎng chǔyú shàngshēng qūshì shí, lìyòng qiáng xìnhào bǔzhuō jiānfēng, dāng chǔyú xiàjiàng qūshì shí, shǐyòng chángguī xìnhào bǔzhuō gèng duō jiānfēng. Gāi zhǐbiāo běnzhí shàng shì jùyǒu yīdìng shùxué luójí de jiàgé xíngwéi jīchǔ. Tā jǐn yòng yú bǔzhuō jiān cì. Gāi zhǐbiāo jùyǒu yǐxià shūchū 1. Xìnhào qiáng 2. Chángguī xìnhào 3. Yóujiàn tíxǐng 3. Zhōngduān Alert de Alert Power

Stochastic Strategy Revealer This EA uses Stochastic Oscillator to generate strategies for almost all markets and trade them using this EA. How will this EA help you? We all know trading is hard, and creating a strategy is even harder, so this EA will let us sit back and let the strategies reveal themselves to us and select the ones we like. this ea was made to get rid of wondering and headaches and you will only search for good markets. Positions Sizing This EA uses the basic position sizing m
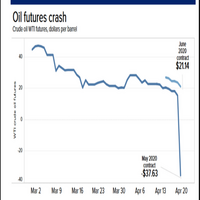
在测试和使用之前优化 EA。
原油期货是根据 2022 年 1 月至 2022 年 12 月 1 小时时间范围内的真实期货市场数据构建的。测试这些日期以进行回溯测试和分析。 需要时进行优化。
从真实的期货市场进行交易,或者如果交易任何石油衍生品,请测试参数,看看它如何适合您正在使用的数据和经纪商。 期货是集中的数据,所有数据对于所有人来说都是相同的。
输入用于 EMA、固定手数系统以及 ATR SL 和 TP 水平。
在测试和使用之前优化 EA。
原油期货是根据 2022 年 1 月至 2022 年 12 月 1 小时时间范围内的真实期货市场数据构建的。测试这些日期以进行回溯测试和分析。 需要时进行优化。
从真实的期货市场进行交易,或者如果交易任何石油衍生品,请测试参数,看看它如何适合您正在使用的数据和经纪商。 期货是集中的数据,所有数据对于所有人来说都是相同的。
输入用于 EMA、固定手数系统以及 ATR SL 和 TP 水平。

The Trend Snatcher is a multi-timeframe indicator that detects swings on the price market chart. Important levels, such as Supply and Demand levels, Trendline touches, reversal patterns, and others, can also be added as confluence when making trading decisions.
The indicator employs two lines that aim for the highest selling and lowest buying levels. When the two lines cross, a signal is generated.
All trading instruments are compatible, including currency pairs, synthetic indices, metals
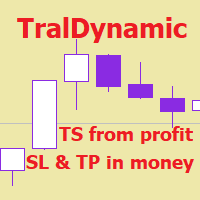
The utility for managing open positions can work with stops (take profit and stop loss) in money, percentages or points. The built-in trailing stop starts working from profit, the size of which can be set in currency or as a percentage. With the help of the built-in trading simulator, you can check how the utility works in the strategy tester. Benefits setting stop loss and take profit in the deposit currency, as a percentage of the account balance or by points; adding stop loss and take profit

Sniper2 , It has points of lines, with colors that are showing you an entrance, that work as support and resistance! green dotted lines green shows entry for sale, the red dotted lines show a buy entry, pay attention to the supports that work as a break to catch long candles in a longer period of time. works for forex all pairs works for synthetic indices all pairs ! indicator on sale!
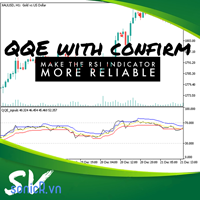
New QQE with confirm The relative strength index (RSI) is a technical indicator of momentum that measures the speed and change of price on a scale of 0 to 100, typically over the past 14 periods. Cause RSI measures the speed and change of price, trader normally use this indicator in two way: + Buy when oversold, sell when overbougth. + buy or sell when identifying divergence from rsi with price. In two way, it wrong when rsi in overbouth (for example) for long time or divergence. Even price ju

Multipound Scalper MT5 is a multicurrency Expert Advisor that works with a customizable trading time filter, Moving Averages and Bollinger Bands Indicators to determine the market entry and exit points. ONLY 7 out of 10 copies left going at 62$ . NEXT PRICE : 98$ . SETUP The following is an overview of the settings used in this Expert Advisor: EA Comment = Comment of the order placed by the EA (Multipound Scalper). Fixed Lot size = 0.1 Use Risk = true (true means risk % will be used and false m
What is Double Top and Bottom Double top and bottom patterns are chart patterns that occur when the underlying investment moves in a similar pattern to the letter "W" (double bottom) or "M" (double top). Double top and bottom analysis is used in technical analysis to explain movements in a security or other investment, and can be used as part of a trading strategy to exploit recurring patterns. you can fin MT4 version hier
Indicator shows you 2 Level target and stop loss level. Stoploss level
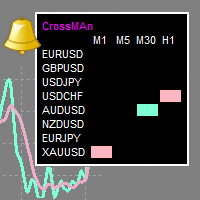
"CrossMAn" is a table indicator that gives signals about the intersection of two moving averages, on selected instruments and time periods.
The intersection of moving averages is one of the most popular signals on the stock exchange.
The signal is displayed as colored rectangles in the table. Thus, you can assess at a glance which tool should be paid attention to.
(Crossman does not add moving averages to the chart.)
The indicator table can be dragged with the mouse.
The size of the table

The diamond top and bottom are reversal patterns. It represents a rally to a new high with a drop to a support level followed by a rally to make a new high and a quick decline, breaking the support level to make a higher low. The bounce from the higher low is then followed by a rally, but making a lower high instead. Once this behavior is identified, prices then break the trend line connecting the first and second lows and start to decline further. You can find MT4 version hier
Indicator show

This z-score indicator shows the correct z-score of an asset, as it uses the normalized price data for calculation, which is the only correct way. Z-score is only applicable for normal distributed data, therefore not the actual price is considered, but the normalised returns, which were assumed to follow a normal distribution. Returns are mean reverting and assumed to follow a normal distribution, therefore z-score calculation of returns is more reliable than z-score on price, as price is NOT m

Trend Following Strategy Generator The following Expert Advisor helps to generate robust trend-following strategies using price action and a few parameters. the story behind the expert Advisor is to unfold market behavior for an instrument and choose how we can trade it best. After finding your favorite strategy you can save the parameters and start trading the strategy in no time. There is no limit to how many strategies you can generate. How will this EA help you? We all know trading is hard,
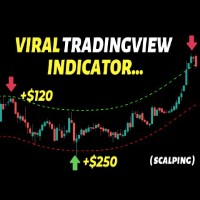
This indicator builds upon the previously posted Nadaraya-Watson Estimator. Here we have created an envelope indicator based on kernel smoothing with integrated alerts from crosses between the price and envelope extremities. Unlike the Nadaraya-Watson Estimator, this indicator follows a contrarian methodology. Settings
Window Size: Determines the number of recent price observations to be used to fit the Nadaraya-Watson Estimator.
Bandwidth: Controls the degree of smoothness of the envelop

Build your own model to predict averages of turning points of the Triple Moving Average Oscillator. It is simple. Rate me with stars. Just load the indicator Triple Moving Average Oscillator in you platform and choose the period. Scroll through to observe the averages of the highs and lows over a period of time. Add the levels for a buy and a sell on the Triple Machine and this will show the average of highs and lows to look for buys and sell. You can load multiple copies with multiple levels.
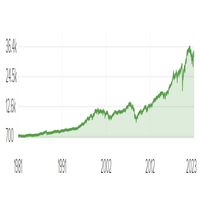
EA 从 2022 年 1 月起可优化和优化。
Dow Jones Lot Trader 是通过机器学习制作的,使用固定手数在 1 小时图表上交易道琼斯期货。 EA 是根据微型道琼斯的真实期货数据制作的。
如果您正在交易道琼斯指数的衍生品,您可能需要进行回溯测试,看看它是否与真实的期货数据一致。 sl 和 tp 基于平均真实范围。
EA 中的逻辑是它交易范围,最高和最低。 逻辑设置为仅在日内交易,不会在周末或隔夜交易。 这可以在输入中更改。 EA 建立在 2022 年数据的基础上。 使用范围进行测试。
EA 从 2022 年 1 月起可优化和优化。
Dow Jones Lot Trader 是通过机器学习制作的,使用固定手数在 1 小时图表上交易道琼斯期货。 EA 是根据微型道琼斯的真实期货数据制作的。
如果您正在交易道琼斯指数的衍生品,您可能需要进行回溯测试,看看它是否与真实的期货数据一致。 sl 和 tp 基于平均真实范围。
EA 中的逻辑是它交易范围,最高和最低。 逻辑设置为仅在日内交易,不会在周末或隔夜交易。 这可以在输入中更改。 EA 建立在 2

Fibonacci retracement levels—stemming from the Fibonacci sequence—are horizontal lines that indicate where support and resistance are likely to occur. Each level is associated with a percentage. The percentage is how much of a prior move the price has retraced. The Fibonacci retracement levels are 23.6%, 38.2%, 61.8%, and 78.6%. While not officially a Fibonacci ratio, 50% is also used. The indicator is useful because it can be drawn between any two significant price points, such as

此 EA 具有可优化的输入。
Nice Little Bot 在 1 小时图上交易 GBP/USD。 它使用 Keltner 通道、布林带和 LWMA 进行逻辑交易。 它是通过机器学习创建的,是一个不错的小机器人。
如果您发现,有些输入可以优化或更改。 资金管理使用按比例缩放的余额百分比。 有余额百分比和最大手数。 尝试回测开始
从 2013 年开始。
此 EA 具有可优化的输入。
Nice Little Bot 在 1 小时图上交易 GBP/USD。 它使用 Keltner 通道、布林带和 LWMA 进行逻辑交易。 它是通过机器学习创建的,是一个不错的小机器人。
如果您发现,有些输入可以优化或更改。 资金管理使用按比例缩放的余额百分比。 有余额百分比和最大手数。 尝试回测开始
从 2013 年开始。

EMA BASEd ON EMA, ICHIMOKU-Kejun-sen line and MACD input group "RSI Setting" input int Inp_RSI_ma_period = 7; // RSI: averaging period input ENUM_APPLIED_PRICE Inp_RSI_applied_price = PRICE_WEIGHTED; // RSI: type of price input double Inp_RSI_LevelUP = 60; // RSI Fast and Slow: Level UP input double Inp_RSI_LevelDOWN = 40; // RSI Fast and Slow: Level DOWN input string

二元交易面板是一款非常有用的工具,用于在 MT4/MT5 平台上进行二元期权交易。不再需要在 MT4/MT5 之外设置插件。这是 MT4/MT5 图表上简单方便的面板。 二元交易面板对于使用 MT4/MT5 平台交易二元期权的交易者来说是一个有用的工具。它是一个简单方便的面板,允许交易者直接从 MT4/MT5 图表进行二元期权交易,无需设置外部插件或浏览多个屏幕和菜单。 二元交易面板专为与提供 MT4/MT5 交易平台的二元期权经纪商合作而设计。 话虽这么说,如果您更喜欢二元期权交易的工作方式并希望继续与常规经纪商以这种方式进行交易,二元交易面板旨在为交易者提供与二元期权交易类似的体验,即使所使用的经纪商不是二元期权经纪人。 二元交易面板安装和输入指南 如果您想获取有关 EA 的通知,请将我们的 URL 添加到 MT4/MT5 终端(参见屏幕截图)。 MT4版本 https://www.mql5.com/en/market/product/48886 MT5版本 https://www.mql5.com/en/market/product/91749
主要特点:

The indicator ‘Probability Range Bands’ gives a prediction of the amount, how much the asset is moving from its current price. The range bands give probabilities, that the candle close will not exceed this certain price level. It is also called the expected move for the current candle close. This Indicator is based on statistical methods, probabilities and volatility. Asset price is assumed to follow a log-normal distribution. Therefore, log returns are used in this indicator to determine the
Pack Dragon , Indicator 3/1, Dragon signal It has the strategy of an oscillator programmed to grab supports and resistances to take advantage of every candle in the market, and it gives you to take your time and a simple analysis it is simple where you mark the green dots at the bottom gives you input for long And when it does not mark anything, it is giving you a short warning! works for all seasons for forex markets and synthetic indices !

Pack Dragon, Indicator 2/3 Legend Moving It has the barrier pass strategy as well seen in the photo, where there is a dot on the yellow line, when there is a downtrend, there are red dots when it falls giving perfect entries in short, the same when the market is bullish, it marks another navy blue line, where it gives perfect entries over the green dots for long , It is available for all seasons and for markets of Forex and synthetic indices !

Pack Dragon. indicator 3/3 Dragon machine, has the perfected support and resistance strategy, indicates the floors and ceilings with the naked eye can be seen, giving signal to each circle pink giving entry to the rise and the green circle gives entry to the low wing, where the support of the green and red lines helps. Works for synthetic indices and forex all pairs, ideal for operating crash and boom. !
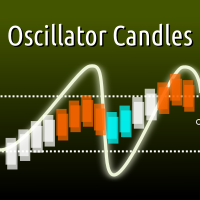
With this indicator you can colorize the candles on your chart based on the output of any oscillator indicator. Supporting both built-in and custom indicators, with the ability to set up to 5 custom parameters, custom color scheme, and upper/lower threshold values. Most built-in indicators in MT5 will be found under "Examples\\" path. For example, to use default RSI indicator, set your indicator path to "Examples\\RSI" in the inputs dialog. Input01-05 sets the custom parameters of your indicator

Package Yacht indicator 2/3 Oscillator yacht, has the strategy of breakouts with the oscillator in the levels, 1.05, 0.50, 0.00, 050 and 1.05 are 5 levels where the volume no longer gives in the period of 1.05 on the lower side, the red candle begins to form, rising ay gives long signal, where it verifies it with 3 yellow, green and red dots, the same is for short when it breaks the green level, and breaks the line changing color starts entry works for forex markets and synthetic indices all tem

Package Yacht indicator 3/3 Fibo Yacht, has the fibonacci strategy but better hunting the rebounds / pivots. As seen in the photo, setbacks can be calculated at any time, works very well for synthetic indices, and forex too! It is designed for volatility and jump pairs. also works on crash and boom! the indicator is placed and it is already operated! Wolrd inversor.

I developed this vwap with more settings in order to be customized as much as possible. VWAP is a really strong indicator for your trading. It can be used to check if the market is in balance or ranged, and also you can use the levels as support/resistence/target. In the pictures you can see the main settings, and you can select the use of real volume from the broker.
Hope you will find it useful. Many thanks in advance.

Black Card Pack indicator 5/1 point black It has the strategy of professional bollingers where each arrow gives you a different entry signal. It is used to operate in m1 and in d1 It is used for scalping and intraday, modified for forex markets ! suitable for all pairs modified for synthetic index markets suitable for all pairs! Ideal for volatility and jumps!

Black Card Pack Indicator 5/2 Macd Divergence Black It has the strategy of the cross of emas and the different lines as well seen in the photo! works for all seasons works for forex markets and synthetic index markets ideal for volatility 75, volatility 100, volatility 25 and volatility 50 pairs for all jumpers! for forex works on all pairs! eur/usd , usd/jpy , eur/aud etc !

Black Card Pack indicator 5/3 Green power It has the high and low breakout strategy giving the signal with the red or green dot the red dot for short and the green dot for long , perfect for forex markets and synthetic index markets, works for all seasons It is used for scalping and intraday! Ideal for Crash and boom markets!! Volatilitys y jumps !! Micro y macro en forex !

Pack Black Card, Indicator 5/4 Channel black, It is an indicator that has the strategy of grabbing pivots on an already programmed channel. as seen in the photo is perfect for scalping taking it in timeframes of m30, m15, m5 and m1 to grab profit rebounds. Although it works for all temporalities, it is designed to make short films, works for forex markets and synthetic indices all the pairs are able to operate!

Black Card Pack indicators. Bars Black indicator 5/5 of the pack It has a strategy of breaking bars as the indicator is called, It is very easy to use, although you can see it in the photo when you break the ema bars down to get into position up is the same! It works for all temporalities, it is used to hunt big trends and scalp suitable for forex and synthetic indices works on all pairs of both!
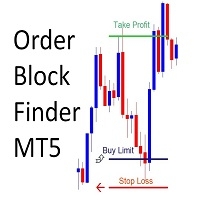
!! FLASH SALE !! Over 80% off !! For ONE week only. Now only $47 - normally $297! >>> Ends on 30 June 2023 - Don't miss it!
Sends Alerts – On MT5 To Your Phone To Your Email
Does not repaint .
Works on any Forex pair, any timeframe.
10 Activations allowed so you are free from limitations >> MT4 Version Here Spreads from 0.1pip RAW/ECN Accounts, click here . Check out my Waka Esque EA signal here: >> High Risk Settings or Medium Risk Settings .
What Is An Order Bl

MetaTrader 5 上可定制化的期间分隔线 内置的期间分隔线功能不允许用户指定时间间隔,所以你可以使用这个指标来创建可定制的期间分隔线。
在日内图表上,你可以在特定的时间放置期间分隔线,你也可以选择在周一的特定时间放置额外的分隔线,以标记一周的开始。
在其他时间周期图表上,该指标的功能与内置的期间分隔线相同。
在日线图上,期间分隔线被放置在每个月的开始日。
在周线图和月线图上,期间分隔线被放置在每年的起始日。
输入 period_separator_hour period_separator_minute period_separator_color period_separator_width period_separator_style week_separator_hour week_separator_minute week_separator_color week_separator_width week_separator_style MT4 版本: https://www.mql5.com/en/market/produc

Fibo Ruby indicator 5/5 pack ruby fibo ruby has the strategy of a programmed fibonacci to capture the bullish trend as bass player ideal for grabbing rebounds at the points of 23.6, 38.2, 50.0 and 61.8 It adapts to any temporality, be it for scalping or intraday. works for forex markets, all pairs It is used for synthetic index markets, all pairs great for boom and crash!

Channel Zone indicator 4 of the ruby pack channel zone has the strategy where the channel channel breaks for the green color gives a short signal where it breaks for the red channel gives a long signal, It is very simple and easy to use. ideal for holding long tendencies as seen in the photo ideal for intraday works for forex markets all pairs for synthetic index markets all pairs! and for all time periods.

Trend Ruby, indicator 3 of the ruby pack. trend ruby has the strategy of breaking the structure or trend line How well do the lines mark and gives you the signal of breaking or following the trend? and bounce! works for any temporality, It is used for scalping and also intraday It works for the forex markets all the pairs, also for synthetic indices all pairs ideal for volatility and jumps! also crash and boom!

Macd Ruby , ruby pack flag 2 It has the strategy of the crossing of moving averages, where is the first cross for the rise or for the downside, get into position It serves to catch long trends also in other temporalities, and to scalp at low times, works for forex markets all pairs It works for the synthetic indices markets all pairs! works great on volatility and jumps!

ZigZag Ruby , Indicator 1 of 5 The ruby zigzag consists of a pivot strategy where he finishes giving a signal, the next pivot is easily grabbed, as seen in the photo It is used to hunt long trends in h1, h4 and d1 timeframes, ideal for scalping, works for forex markets, all pairs! works for synthetic index markets! all pairs ideal for volatilitys , jumps , crash y boom
RSI Bot, send alert to mobile, buy when RSI<=20, send alert sell when RSI>=80 you can set parameter RSI in setting Inp_RSI_ma_period = 14; // RSI: averaging period Inp_RSI_applied_price= PRICE_WEIGHTED; // RSI: type of price Inp_RSI_LevelUP = 60; // RSI Fast and Slow: Level UP Inp_RSI_LevelDOWN = 40; // RSI Fast and Slow: Level DOWN Inp_RSI_stringUP ="Signal Sell";// RSI Fast and Slow: Level UP label Inp_RSI_stringDOWN ="Si

Ticks Candles Chart indicator build equi-volume candles and designed for Oracle Strategy The Period in ticks is set directly on the chart Tick chart opens in a separate window Recommended to use tick periods from 50 and above Works on real time only
Input Parameters Ticks_In_Bar - default period in ticks Counting_Bars - how many tick bars of history to build Custom_Symbol_Suffix - additional suffix for symbols
MetaTrader市场是 出售自动交易和技术指标的最好地方。
您只需要以一个有吸引力的设计和良好的描述为MetaTrader平台开发应用程序。我们将为您解释如何在市场发布您的产品将它提供给数以百万计的MetaTrader用户。
您错过了交易机会:
- 免费交易应用程序
- 8,000+信号可供复制
- 探索金融市场的经济新闻
注册
登录