适用于MetaTrader 5的EA交易和指标 - 45

This is a simple indicator that shows the spread in points. It is useful for those like trade scalper, in addition to be customizable.
Functions:
Color - I don't need to explain :) Font type - I don't need to explain :) Font size - I don't need to explain :) First text - text in front of spread number Second text - aditional text after the spread number. Corner - specify the corner where the spread will be written. Horizontal distance - horizontal distance from the edge. Vertical distance -
FREE

*Display all text information you need on your charts.*
This will help you on displaying text on the chart, to note everything , for example: strategy.
* BUY SIGNAL
- rule 1 - rule 2 - rule 3 - etc * SELL SIGNAL
- rule 1 - rule 2 - rule 3 - etc
This will remind you to follow the discipline and trading strategy set by you.
The Discipline to Follow Rules is the Mark of a Top Trader
Safety first, then profit will come.
FREE

For those Price Action traders who love to trade strong Price points, like today's Opening Price (or even yesterday's Price), here is an indicator to ease the identification of those values, drawn directly on your chart! Opening Price will automatically draw a line showing you this point for you, AND, if you like any OPENing price in the past, not just today's price. A must-have in your Price Action toolbox!
SETTINGS
How many past days do you want to be drawn? Do you want to draw the current
FREE
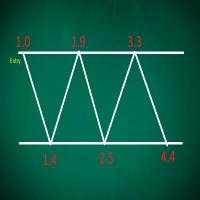
This EA performs with a Hedging strategy by which Buy and Sell signals are from the MACD indicator.... The lot sizes in the input are Custome for you to adjust as you pleased, so you are able to improve your hedging style. Inputs. Close Money- this option is basically the take profit in ($), for example if you set the close money at $20 the EA will automatically close all trades when your overall profit is $20. Nearby Hedge Pips- this basically determine the distance of pips between yo
FREE

This indicator shows the value of returns in the selected time frame
They are calculated as logarithm of returns , rather than price or raw returns. For small returns, arithmetic and logarithmic returns will be similar. The benefit of using returns, versus prices, is normalization. It is possible measures all variables in a comparable metric despite originating from price series of unequal values
Inputs You can display data both as a Histogram or a Line It's also possible to display the
FREE

EA to prevent inactivity violations on prop firms.
This EA will scout for your most recent trade and if it is older than the number of days defined, will enter a micro lot position size 0.01 on the pair defined. It is recommended to use a tight spread pair like EURUSD. This EA will not act as long as you have at least one trade in the last X days (defined on config).
This EA will not place other trades or modify existing position.
FREE

The Expert Advisor is based on the indicator "Oscillator of RSI" . It is suitable for currency pairs such as EUR/USD on the M15 timeframe. Each trade is protected by a Stop Loss and Take Profit. The EA uses a Martingale that is set to 2.0 (so be careful). By default, the lot is set to 0.05, you can change it in the EA settings. Below are the test results for the last 3 years. Initial balance = 10,000 $ Net profit = 6,983 $ Drawdown = 17% Other products: https://www.mql5.com/ru/users/yura1994
FREE

Session Volume Profile is an advanced graphical representation that displays trading activity during Forex trading sessions at specified price levels. The Forex market can be divided into four main trading sessions: the Australian session, the Asian session, the European session and the favorite trading time - the American (US) session. POC - profile can be used as a support and resistance level for intraday trading.
VWAP - Volume Weighted Average Price.
ATTENTION ! For the indicator to

The Display N Bars utility is a simple tool designed to help identify candles.
If a trader tries to share knowledge with a colleague but it is difficult to pinpoint exactly the desired candle, just say the corresponding candle number.
The candle count is reset every day.
Seeking to offer a good customization the inputs are:
Display type -> Display only odd, only odd, or both candles?
Direction -> Horizontal or Vertical?
Display multiples of: (display frequency) -> Displa
FREE

The M Extensions are variations of the Golden Ratio (Fibonacci Sequence). It is the World's first technique developed for Candle Projections.
Advantages:
Easy to plot. Candle anchoring; High and accurate precision as support and resistance; Excellent Risk x Return ratio; Works in any timeframe; Works in any asset / market. The M Extensions are classified into:
M0: Zero point (starting candle) RC: Initial candle control region M1: Extension region 1 M2: Extension region 2 M3: Extension r
FREE

欢迎使用 KMeans Price Zones Detector,这是一款创新的 MetaTrader 指标,利用机器学习的强大功能来识别关键的价格区间。该工具使用 KMeans 聚类算法动态检测价格数据中的中心点,突出显示价格更可能遇到支撑、阻力或整合的区域。 创新的 KMeans 算法 KMeans Price Zones Detector 之所以出众,是因为它先进地使用了 KMeans 聚类算法,这是一种在模式识别中以其效率和准确性而著称的机器学习技术。通过分析历史价格数据,指标识别代表显著价格水平的集群或中心点。然后利用这些中心点计算支撑和阻力区,为交易者提供关于潜在价格反转、突破和整合的重要信息。 主要特点 动态区域检测: 指标根据最新的市场数据不断更新价格区域,确保交易者始终掌握最相关的信息。 适用于所有时间框架: 无论您是在 1 分钟图表上进行短线交易还是在日线图表上进行长期投资,KMeans Price Zones Detector 都能无缝适应,提供准确的区域检测。 兼容所有外汇对: 该指标设计用于任何外汇对,为交易多种货币的交易者提供了灵活性和多功能性。 全面的 A
FREE

The Multi Asset Monitor Panel is a game-changer for traders who need to keep an eye on multiple markets simultaneously. This innovative panel allows you to monitor any symbol and any timeframe you need, all within a single, organized interface. With up to three lists of symbols and customizable MT5 templates, you can tailor your monitoring setup to fit your specific trading strategy. What sets the Multi Asset Monitor Panel apart is its flexibility and customization options. You can control the s

The Emerald is a Comprehensive utility integrated with a number of tools including the Currency Strength Meter, Trade/directional signal, signal strength, Current bar countdown timer, Forex market sessions time converter and many more.
Can be used in all time frames and all markets The currency strength meter helps you identify which currencies are strong and which currencies are weak. All the 10 major currencies are monitored in real-time. The Emerald can used to predict currency movements wh
FREE

This indicator displays breakouts on Point-And-Figure-like or Kagi-like custom symbol charts, generated by special expert advisers, such as PointFigureKagiCharts . This indicator is applicable only for custom instruments generated in appropriate way (with time-invariant bars which are multiples of a predefined box size). It makes no sense to apply it to other charts. The breakouts in up or down direction are marked by arrows. The breakout price is found at crossing of one of imaginary lines of
FREE

It adds the symbols listed on Binance Spot to the Metatrader5 market clock. With this free file you can list the entire list in seconds. You can easily upload it to your demo account. It is the first file uploaded for Binance Spot Tick and is available for free. Tools menu / Options / Expert Advisors / You need to select Use WebRequest for listed URL You can watch videos to add Metatrader.
FREE

The Relative strength index is an oscillator that follows price, it was introduced by Welles Wilder, who went on to recommend the 14 period RSI. This adaptive version is based on the indicator described by John Ehlers, in the book 'Rocket Science for Traders'. The indicator uses the homodyne descriminator to compute the dominant cycle. To apply the homodyne descriminator, real and imaginary parts have to be calculated from the Inphase and Quadrature components. (Inphase and Quadrature components
FREE

Добро пожаловать в новую эпоху торговли с индикатором AI Moving Average, передовым индикатором MetaTrader 5, разработанным для предоставления трейдерам предсказательной информации о движениях рынка. Этот инструмент сочетает в себе мощь ИИ с надежностью экспоненциального скользящего среднего без запаздывания для точных и своевременных прогнозов будущих ценовых тенденций. Инновационная модель линейной регрессии Индикатор AI Moving Average использует модель машинного обучения линейной регрессии для
FREE

Lite Hamster Scalping (Very Fast EA no Graphics)
The Lite Hamster Scalper is a Trading Robot with no use of Classic martingale. Schedule scalping Options. it uses some Indicators as a filter to maximize Correct entries.
Please to check The version 1.4 of Hamster Pro : Hamster_PRO_MT4 && Hamster_PRO_MT5 Recommendations : Lot : 0.01. Balance : 100 USD. Pair : EURUSD. TimeFrame : 5Min. Spread : 30. Broker : Trusted Brokers Inputs descriptions : Period Indicator1 - period of the fi
FREE

Level Assistant is an expert assistant for manually setting support and resistance levels.
Traders often form their own levels. If there are many charts of different periods, the level will be multiplied by all charts.
When placing a horizontal line on a chart, the Assistant suggests converting this line into a level. At the same time, he himself will determine the color and thickness of the line, depending on the period of the instrument and where it is relative to the price. Mark the leve
FREE

SparkLight EA is a fully automated expert advisor that uses advanced algorithms for the price analysis of the latest trends. Every order has StopLoss and every order is placed based on the primary or the secondary trend analysis algorithm. This EA does NOT use Martingale or Arbitrage strategy. It can trade more orders at the same time but every order has the same Lot size if using FixedLotSize. SparkLight EA is NOT a minute scalper or tick scalper that produces high number of trades per da
FREE
Easy to use EA designed to auto trade. Works in every market condition. It uses reliable levels of MACD indicator combined with unique logic to perform fully automatic trading operations. *For MT4 version please go here! *If you don't like automated system and only need an alert system to help you in trading. Please check this arrow with alert system here!
FEATURES: Dangerous methods like martingale, hedge, grid or scalping are NOT used. Each position has Stop Loss and Take Profit. Positional
FREE

This Price indicator aid you to read prices of a bar without using native MT5 instuments like crosshair.
The indicator gives you the OPEN HIGH LOW CLOSE and 50% bar prices of the current or one of the previous bar.
Parameter setting are: TimeShift: Used for bar selection (0 stand for current 1 for previous 2 for 2 bars ago) Other parameter are using for esthetics. Each Label can be moved away from its initial position.
FEEL FREE TO REPORT BUG AND REVIEW THIS INDICATOR. THANKS
FREE

RUBFX Trend histo mt5 , indicator works on synthetic indices, Currencies , Indices ,Stocks Gold etc , good for follwoing trend on the markets suitable for scalping Buy Rules; When the histo changes to Blue you place buy order ,stop loss just below the previous swing low Sell Rules; When the histo changes to Red you place sell order ,stop loss just below the previous swing high Trade on a timeframe which best suits your trading style

Media Móvel Grátis para uso em conjunto ao Diamond Indicator Atenção. Essa é a mm para conjugar ao indicador. Esse não é o indicador. Comprem o indicador que está tendo ótimos resultados. A seguir informações sobre o indicador: Indicador Para Opções Binarias. Usa dois gales. Instalar em mt5 Esse indicador é para ser usado no tempo de vela de 5 minutos e em M5. Este também funciona em M1, porém é mais eficiente em M5. Só descompactar e copiar os arquivos na pasta de dados do seu MT5. Arquivos
FREE

The indicator calculates the inclination angle between the Highs, Lows and Closes of adjacent bars. The angle can be measured in degrees or radians. A linear graph or a histogram is drawn in a subwindow. You can set the scale for the calculation — floating or fixed. For use in Expert Advisors or indicators, you need to specify a fixed scale.
Parameters Angular measure — degrees or radians. Scale mode for calculation — scaling mode. Free scale — free transformation, the indicator will calculate
FREE

Spire - показывает трендовый, сигнальный, свечной прорыв в сторону верхней или нижней границы канала, а так же временную или долгую консолидацию в виде прямоугольного канала. Сигналы тренда не перерисовываются. В основу идеи индикатора входит Bollinger Bands.
Изменяемые параметры Signal trend -изменение цветовой гаммы сигнального символа тренда Lower limit - изменение цветовой гаммы нижней границы канала Upper limit - изменение цветовой гаммы верхней границы канала Internal field -изменение
FREE

verview: Our custom Kalman Filter indicator is a sophisticated, adaptive tool designed for MetaTrader 5 (MT5), offering traders a dynamic approach to analyzing financial markets. This indicator is based on the Kalman Filter algorithm, a powerful statistical method used for linear dynamic systems estimation. It's tailored for traders who need an advanced, responsive tool to track market trends and make informed decisions. Key Features: Dynamic Trend Analysis: The Kalman Filter continuously adjust
FREE

The new version of MirrorSoftware 2021 has been completely rewriten and optimized.
This version requires to be loaded only on a single chart because it can detect all actions on every symbol and not only the actions of symbol where it is loaded.
Even the graphics and the configuration mode have been completely redesigned. The MirrorSoftware is composed of two components (all components are required to work): MirrorController (free indicator): This component must be loaded into the MAST
FREE

When creating, modifying and moving a trend line, two anchor points will be selected: high / low, open / close, median or weighted from the candlestick prices.
For high / low, open / close, if the anchor point is above the candlestick, the upper price will be taken, below the candlestick - the lower one. If the point is inside the candlestick, then if the first point is higher than the second, then the first one goes up, the second goes down. Conversely, if the second is higher than the first
FREE

Imagine what results you could achieve in your manual trading if you had a tool that notifies you of a possible price reversal for all the symbols you are interested in at the same time (futures, stocks, forex or cryptocurrency)?
VSA screener is just the right tool. It was created for traders who value their time and make their own trading decisions on opening or closing a position. The software monitors the presence of trading patterns on the preselected tickers under several timeframes (up t
FREE

下午好。. 我们为交易者和市场分析师准备了一个新产品。 我们的volumespreadtompson指标旨在查看机构市场参与者对当前价格的影响。 该指标显示每单位时间点差的变化水平,当其值较高时。 实践表明,交易量的变化与投机活动的警告和提前有关, 特别是在关键时刻:美联储新闻,石油新闻,国家领导人的演讲等。 Practice shows that the change in volumes is associated with the warning and advance of speculative activity, especially at key moments: Fed news, oil news, speeches by leaders of the IDR countries. We are very happy to present new developments. Thanks.
FREE
Daily Drawdown Control is most easy and effective EA to protect your account from over Daily Drawndown limit of Prop Firm. - This EA is used for MT5 only. - Initial Balance is balance at the moment of Daily Drawdown limit reseted, it doen't care about floating profit/loss. - You just input Drawdown litmit percentage and resetting time. - If actual loss is over setting value, EA will close all positons and delete all orders immediately ( Reach DD : true)
FREE
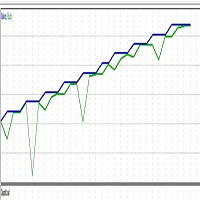
Trading is a skill where you can have your own skill and your own process. So, he advice that you try do what work for you. Trading is not a get rich quick scheme. when you stick to it long enough, it could change your live. Psychology and emotion is very important. Taking basic long and short trades automatically based on MACD and bear power. The robot is a test project by chrisdgenius aim to increasing profitablility.
FREE

The Commodity Channel Index computes the deviation of the typical price of each bar from the average price over a particular time period. Multiplying the median deviation by 0.015 facilitates normalization, which makes all deviations below the first standard deviation less than -100, and all deviations above the first standard deviation more than 100. This adaptive version is based on the indicator described by John Ehlers, in the book Rocket Science for traders. The indicator uses the homodyne
FREE

BeST_Trend Exploiter is a Metatrader Indicator based on a smart proprietary algorithm which can detect the market Median Trend while it filters out the noise providing Buy and Sell Signals and also wherever it is applicable it provides us with TP Levels of High Probability. Additionally as it has Built Inside all the necessary features it can be used as a Complete Strategy of very Impressive Results. Essential Advantages of the Indicator
Clear and Easily Understandable trading rules. Real

Please check the " What's new " tab regularly for a complete and up-to-date list of all improvements + parameters. FREE indicator for my trading utility Take a Break . This indicator allows you to manage multiple other EAs with just one Take a Break EA instance. Simply specify the corresponding Chart Group in the indicator(s) and Take a Break EA settings and you are good to go.
Setup example (Indicator + EA)
You want Take a Break to manage 3 other EAs: EA1 on EURUSD, EA2 on EURGBP, EA3 on G
FREE

Functional in the Forex market. Functional in the B3 market - Bolsa Brasil Balcão.
Motivation The technical Fibonacci retraction indicator for many is essential and the basis for all market movement forecasts. The name of the tool comes from the Italian mathematician Leonardo de Pisa (13th century).
This DEMO version will work in Meta Trader with Demo and Strategy Tester.
To purchase the Full version that works on a Real account, click on: https://www.mql5.com/en/market/product/38089
FREE

This is a non-trading expert which transforms unstructured web-pages into structured data tables. It downloads and parses an HTML file, then creates DOM ( Document Object Model ) for it, and finally applies specified CSS ( Cascading Style Sheets ) selectors for required fields and extracts data for them. You may consider it as a powerful and highly customizable HTML to CSV ( Comma-Separated Values ) converter. The EA can process web-pages from remote sites (using MetaTrader's WebRequest ) or loc

專業的交易工具 - AO 和價格之間的背離指標,讓您及時接收趨勢反轉的信號或捕捉價格回調(取決於設置)。指標設置允許您調整由於 AO 峰值的斜率和價格變化的百分比而導致的背離強度,從而可以微調信號的強度。作為 EA 的一部分,指標代碼經過非常快速的優化和測試。
指標不會重新繪製,交易方向的箭頭正好位於信號出現的位置 - 在柱的開盤處。 FastPeriod_P = 5 ; //Fast period SlowPeriod_P = 34 ; //Slow period LeftBars_P = 1 ; //LeftBars RightBars_P = 1 ; //RightBars IndDivForce_P = 15.0 ; //Divergences force of indicator PriceDivForce_P = 0.01 ; //Divergences force of price Price_P = PR
FREE

DoubleMACD DoubleMACD DoubleMACD DoubleMACD DoubleMACD DoubleMACD DoubleMACD DoubleMACD DoubleMACD DoubleMACD DoubleMACD DoubleMACD DoubleMACD DoubleMACD DoubleMACD DoubleMACD DoubleMACD DoubleMACD DoubleMACD DoubleMACD DoubleMACD DoubleMACD DoubleMACD DoubleMACD DoubleMACD DoubleMACD DoubleMACD DoubleMACD DoubleMACD DoubleMACD
FREE

The RSI (Relative Strength Index) scanner is a powerful technical analysis tool designed to help traders and investors identify potential trading opportunities in the forex, stocks, and cryptocurrency markets. RSI is a popular momentum oscillator that measures the speed and change of price movements and helps determine overbought or oversold conditions in an asset. The scanner takes advantage of this indicator to streamline the process of finding trading signals and opportunities. The RSI value
FREE

ProFactor is an indicator generating signals based price on the famous profit factor formula. The calculation is simply defined as gross GREEN BARS divided by gross RED BARS.
That's it in a nutshell, but sometimes the simplest things hold the most value.
So let's imagine your trading system's gross profit for the past year was $40,000 and your gross losses were $20,000. Your Profit Factor would be 2. The ProFactor calculation works on the price of the asset instead of the strategy out
FREE

This is a multi-timeframe indicator that detects and displays support and resistance (S&R) lines using the ZigZag indicator.
Features
The support and resistance lines are not redrawing. The indicator is capable of adding new support and resistance levels as they appear. Each S&R line has a tooltip that displays the price level and start time. Shows the start time, price level and number of touches of all S&R lines when pressing the shortcut Shift+I Save time for multi-timeframe analysis on

Measures the average price and Maximum Stop Loss accepted, adjustable Measures too the projected average price (For Pending entrys), in case you have a open position and pending orders to scale in shows how much it will increase or decrease the average price after fullfilling that pending orders! It shows too the Stop Loss based on the projected average entry, how much it has to be stoped out to fullfill your risk management, after fullfilling that pending orders
FREE

you can close all your positions in profit or lost when you use this robot. 1.you set your max profit and max lost for all your positions. 2.the robot show you in a window beside your chart. 3.when your equity reach your target close all your positions. 4.you can use one of them or both (profit or lost)togather. 5.this robot close all your positions. ((if you have any idea or want somthing i can help you)) i hope you win in all your times of life. best regard
FREE

The Squeeze Index aims to measure the action of price being squeezed, and is expressed as a percentage, with higher values suggesting prices are subject to a higher degree of compression.
Settings
Convergence Factor: Convergence factor of exponential envelopes.
Length: Period of the indicator.
Usage
Prices being squeezed refer to the action of price being compressed within a tightening area. Prices in a tight area logically indicate a period of stationarity, price breaking out of
FREE

The ICT Unicorn Model indicator highlights the presence of "unicorn" patterns on the user's chart which is derived from the lectures of "The Inner Circle Trader" (ICT) .
Detected patterns are followed by targets with a distance controlled by the user.
USAGE (image 2) At its core, the ICT Unicorn Model relies on two popular concepts, Fair Value Gaps and Breaker Blocks. This combination highlights a future area of support/resistance.
A Bullish Unicorn Pattern consists ou

The tool is intended to help traders who cannot look at the chart all the time, or who use several charts, the trader can mark regions of interest as supports and resistances and as soon as the price approaches these regions an audible warning and on the screen will be presented for the trader to take some action, in addition the tool can automatically mark the highs and lows of the day and time.
FREE

The VR Orders History script is designed to upload a trade report to a csv file. This format is intended for additional analysis of trading history in programs such as EXCEL, Openoffice, and Libreoffice. Thanks to the script, it is now much easier for a trader to analyze their trading history. The program facilitates the analysis of the trading history for the MetaTrader 5 terminal. The trader sees structured trading. The entire report is based on the following principle: Position > Order on the
FREE

A unique professional tool is a divergence/convergence indicator between AC and price, which allows you to receive a signal about a trend reversal in a timely manner or catch price pullback movements (depending on the settings). It is indispensable for those who trade divergences manually or with an Expert Advisor. The indicator settings allow you to adjust the strength of the divergence /convergence due to the angle of the AC peaks and the percentage change in price, which makes it possible to
FREE

SSACD - Singular Spectrum Average Convergence/Divergence This is an analogue of the MACD indicator based on the Caterpillar-SSA ( Singular Spectrum Analysis ) method. Limited version of the SSACD Forecast indicator. Limitations include the set of parameters and their range.
Specificity of the method The Caterpillar-SSA is an effective method to handle non-stationary time series with unknown internal structure. The method allows to find the previously unknown periodicities of the series and mak
FREE

1. Торговая стратегия Что делает советник: Советник следит за некотоными индикаторами и при определенном условии (или условиях) помещать торговый запрос (на продажу или покупку) в зависимости от условий. Стратегия:
Используем индикатор Moving Average (скользящие средние) с периодом 8 (вы можете выбрать любой период, но в данной стратегии мы будем использовать период 8). Советник покупает, если 8-периодная скользящая средняя (далее для удобства будем называть ее MA-8) возрастает и текущая цена з
FREE

Volume is a widely used indicator in technical analysis, however there is a variation that is even more useful than Volume alone: the Moving Average of Volume.
It is nothing more than a moving average applied to the popular Volume indicator.
As the name says, Volume + MA serves to display the transacted volume (purchases and sales executed) of a certain financial asset at a given point of time together with the moving average of that same volume over time.
What is it for? With the Volume
FREE

如果您喜欢这个免费工具,请留下 5 星评级! 太感谢了 :) “风险管理助手”EA 集合是一套全面的工具,旨在通过有效管理各种市场条件下的风险来增强交易策略。 该系列由三个关键组件组成:平均、转换和对冲专家顾问,每个组件都针对不同的交易场景提供独特的优势。
该 EA 是市场上标准风险管理策略的发展
https://www.mql5.com/en/blogs/post/756961
1.“平均助手”EA: MT4: https://www.mql5.com/en/market/product/115468 MT5: https://www.mql5.com/en/market/product/115469 2.“切换助手”EA: MT4: https://www.mql5.com/en/market/product/115478 MT5: https://www.mql5.com/en/market/product/115428 3.“对冲助手”EA: MT4: https://www.mql5.com/en/market/product/115466 MT5: https
FREE

SYMPHONY 8a is an advanced speculation system developed by 8aSistemas that uses intelligent input/output and management algorithms with sophisticated filtering methods.
There is nothing special here, no Holy Grail testing, just a strict rules-based trading approach, which allows you to maximize returns while keeping risks under control.
RECOMMENDED Currency Pairs: EURCAD
IT CAN DEVELOP IN ANY CURRENCY PAIR AS LONG AS IT IS OPTIMIZED IN EACH PAIR.
SYMPHONY OPERATES WHEN THE MARKET IS
FREE

Breakouts with strong momentum are challenging to catch. The purpose of the Super Breakouts Monitor is to identify such market conditions. This indicator is inspired by a concept from renowned Technical Analyst Tushar Chande, who combines two highly adaptive indicators, VIDYA and the Dynamic Momentum Index (both his creations), to capture the early stages of a successful breakout. At Minions Labs, we've added our unique enhancements to adapt these great ideas for modern markets like stocks, cryp
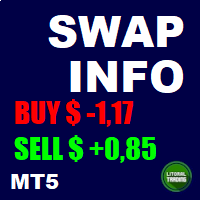
This is a script based tool that informs the swap from all the currency pairs (gold and silver too). It is possible to highlight pairs with a specific currency and whether the swap is positive or negative. In addition it is possible to complement the name of the symbols depending on the broker. The informations are showed in the Experts tab of the Toolbox (Ctrl+T). If you have any doubt or suggestion, please, contact us. Enjoy!
FREE

RSI Scanner, Multiple Symbols and Timeframes, Graphical User Interface An indicator that scans multiple symbols added from the market watch and timeframes and displays result in a graphical panel. Features: Multi symbol Multi timeframe Alerts and Notifications Live Monitoring Sorting modes One click to change symbol and timeframe Inputs for RSI and scanner settings
FREE

This indicator shows the strength of each currency compared to the US dollar by calculating the rate of change in price over a specified time period. When you open the indicator, you'll see a list of different currencies on the price chart. Each currency will have a numerical value indicating its strength level compared to the US dollar, where: If the value is higher than the US dollar, it will be displayed in green, meaning that currency is stronger than the dollar. If the value is lower than t
FREE

A simple indicator/tool to display the current timeframe in the center of the chart. The object is automatically moved to the center of the chart whenever the chart size is changed by the user.
Input Parameters :
Font (default is Arial Black) Font Size (default is 50) Font Color (default is Silver, for light theme graphics, change to black or another dark color) Font Transparency (default is 90%)
FREE

i-Orders is a simple indicator to monitor your own trade/analyze others' trades. I use it for a long time and do not imagine a chart without these arrows, lines and trade result numbers. The features allow you to: change the size and location of the control buttons ( Control buttons size , Control buttons corner ), disable display of opened and closed positions ( Show OPENED , Show CLOSED , Show PENDING ), change colors of arrows and lines for profitable and unprofitable buy and sell positions s

MA Alert Indicator
You do not need anymore to constantly and tediously look at the chart . If your strategy uses any type of moving average with any settings, just add this indicator to the chart according to your required settings
You will be notified whenever the price hits your MA , whether touch or candle close by crossing it. Also, an arrow symbol will be displayed on the chart based on movement.
If you d o not have access to your computer, just set your MetaTrader notification by t

Convenient information line on the chart.
Displays the cost of the point depending on the selected volume (selection in the settings) Displays a swap of short and long trades depending on the selected volume. Shows a triple swap and indicates the day of the week on which it is charged Displays the current spread for the current instrument Displays the remaining time until the next bar on the current timeframe. In the settings you can choose the color, font size, placement and volume.
FREE

This indicator is a basic RSI but comes up with a useful feature.
You can set zones within the RSI and these zones can be displayed with different background colours. (You can see on the pictures below) You need to set the zone ranges and their colours at the input parameters. Six different zones can be set.
Should you have any questions or comments, feel free to contact me.
FREE

Posh Sessions is indicator which displays sessions in broker time or your local time. You can set up to 5 sessions, assign name, start time, end time and color of each session. There is session's range to help you make a chart analysis.
Settings for a session: Show: To show or not the session on chart Title: The title/name of the session Timezone: Select between broker or local time to implement the session's period Start time: The session start time End time: The session end time C
FREE

它是用于处理实时 Binance Futures Ticks Data 和 Real Time Binance Spot Ticks Data 的实用程序。 它旨在更快地提取数据并保持在 Binance Future 的范围内。
工作逻辑:全局变量记录它从币安检查服务器时间接收的时间信息。
在其他程序中,他们通过使用此时间信息更快、更有效地完成工作。
您应该允许来自工具菜单 >> 选项 >> 智能交易系统的 WebRequest 并添加 URL: https://api.binance.com 如果在安装过程中或售后出现任何问题,请随时与我们联系。 如果在安装过程中或售后出现任何问题,请随时与我们联系。 如果在安装过程中或售后出现任何问题,请随时与我们联系。
FREE

The Average Cross System indicator is a versatile tool designed for traders using the MetaTrader 4 (MT4) platform. This indicator provides a straightforward yet effective way to identify potential buy and sell signals based on moving average crossovers, a widely used technical analysis strategy. Key Features: Moving Average Crossovers: The heart of the Average Cross System is the detection of moving average crossovers. It automatically identifies when a shorter-term moving average crosses above
FREE

This is a demo version of the Candle Absorption Full indicator. It has limitations on operation. This indicator detects the Engulfing candlestick pattern and draws the corresponding market entry signal.
Features It works only with EURUSD on timeframes M1 and M5. The indicator analyzes a combination of 2 or 3 candlesticks depending on settings. The number of pre-calculated bars (signals) is configurable. The indicator can send an alert to notify of a found signal. Signal can be filtered by sett
FREE

成功的关键永远是一个好的优化。
该系统有很多变量,在这种情况下,它的简单性是其成功的关键。
系统会寻找不同的 "缺口 "作为入市失败的原因,然后通过一系列移动平均线进行调试,决定是否入市。 这是一个简单但功能强大的系统。
变量如下。
Lot: 定义手数。
TakeProfit: 定义获利点数
Stop Loss:定义了止损的点数。定义止损,单位为点。
这三个变量特别重要,因为它们将决定交易系统的性能和功能。
敏感度。它是交易机器人用来执行销售的差距大小,在这种情况下,数值越小,它将执行更多的行动。
一个数值为负数的缺口将决定买入行动,而一个数值为正数的缺口将决定卖出行动,然而它们将由移动平均线来分析决定是否入市。
在这种情况下,缺口,是市场大变动的标志,出现了不规则的价格情况,在这种情况下,交易机器人会进行分析,并进行对我们有利的交易,以确定我们在这种情况下是否积极进行交易。
时间框架(Thetimeframe)。这是一个预定义的值,用于寻找变量 "敏感 "的差距,因为对于移动平均线来说,这个数字越低,将执行更多的行动。
移动平均线周期
FREE
This script downloads economic news data, required for Economic news calendar with history indicator. It downloads data from fxstreet.com to Common folder of MT5 in CSV format. How to use it (watch video below on how to test demo version): Add http://calendar.fxstreet.com/eventdate / to Allowed URLs section in MT5 settings Download and Install script and indicator from mql5.com Open chart with required currency pair Find script in Navigator panel and drag&drop it to the chart. Find correspond
FREE
MetaTrader市场提供了一个方便,安全的购买MetaTrader平台应用程序的场所。直接从您的程序端免费下载EA交易和指标的试用版在测试策略中进行测试。
在不同模式下测试应用程序来监视性能和为您想要使用MQL5.community支付系统的产品进行付款。
您错过了交易机会:
- 免费交易应用程序
- 8,000+信号可供复制
- 探索金融市场的经济新闻
注册
登录