适用于MetaTrader 5的EA交易和指标 - 178

How To Determine If The Market is Strong Or Weak?
Strength Meter uses an Adaptive Algorithm That Detect Price Action Strength In 4 Important Levels! This powerful filter gives you the ability to determine setups with the best probability.
Features Universal compatibility to different trading systems Advance analysis categorized in 4 levels Level 1 (Weak) - Indicates us to WAIT. This will help avoid false moves Weak Bullish - Early signs bullish pressure Weak Bearish - Early signs bearish pre

Pipfinite creates unique, high quality and affordable trading tools. Our tools may or may not work for you, so we strongly suggest to try the Demo Version for MT4 first. Please test the indicator prior to purchasing to determine if it works for you. We want your good reviews, so hurry up and test it for free...we hope you will find it useful.
Combo Channel Flow with Strength Meter Strategy: Increase probability by confirming signals with strength Watch Video: (Click Here)
Features Detects ch
Pipfinite creates unique, high quality and affordable trading tools. Our tools may or may not work for you, so we strongly suggest to try the Demo Version for MT4 first. Please test the indicator prior to purchasing to determine if it works for you. We want your good reviews, so hurry up and test it for free...we hope you will find it useful.
Combo Swing Control with Energy Beam Strategy: Confirm swing pullback signals Watch Video: (Click Here)
Features Detects overall bias and waits for ove
Pipfinite creates unique, high quality and affordable trading tools. Our tools may or may not work for you, so we strongly suggest to try the Demo Version for MT4 first. Please test the indicator prior to purchasing to determine if it works for you. We want your good reviews, so hurry up and test it for free...we hope you will find it useful.
Attention This trading tool is specifically designed to help grid, martingale, averaging, recovery and hedging strategies. If you are not familiar with t

Pipfinite creates unique, high quality and affordable trading tools. Our tools may or may not work for you, so we strongly suggest to try the Demo Version for MT4 first. Please test the indicator prior to purchasing to determine if it works for you. We want your good reviews, so hurry up and test it for free...we hope you will find it useful.
Combo Energy Beam with Swing Control Strategy: Confirm swing pullback signals Watch Video: (Click Here) Energy Beam with Trend Laser Strategy: Confirm Tr
Did You Have A Profitable Trade But Suddenly Reversed? Exiting a trade is equally important as entering! Exit Scope helps maximize your current trade profit and avoid turning winning trades to losers.
Attention Exit Signals are NOT to be used in entering a trade! Exit means closing your trades to avoid correction/reversal which can wipe out existing profit or haunt break-even orders. Please watch presentation (Click Here)
Features Generates instant exit signals based on price action, volat

The Pioneer Of Trend Detection! A Powerful Indicator That Avoids Whipsaws And Uncertain Market Noise. Functions mainly as a filter to help you trade in the direction of the trend. It works in any pair or timeframe.
Features Advanced trend detection software using complex algorithms that can be used as the supporting tool or system. Unique trend detection that avoids whipsaws and uncertain market noise Analyzes statistics of maximum profits and calculates possible targets for the next signal Fl

Pipfinite creates unique, high quality and affordable trading tools. Our tools may or may not work for you, so we strongly suggest to try the Demo Version for MT4 first. Please test the indicator prior to purchasing to determine if it works for you. We want your good reviews, so hurry up and test it for free...we hope you will find it useful.
Combo Razor Scalper with Trend Laser Strategy: Scalp in the direction of the trend Watch Video: (Click Here)
Features Scalping indicator using a confir

The standard Commodity Channel Index (CCI) indicator uses a Simple Moving Average, which somewhat limits capabilities of this indicator. The presented CCI Modified indicator features a selection of four moving averages - Simple, Exponential, Smoothed, Linear weighted, which allows to significantly extend the capabilities of this indicator.
Parameter of the standard Commodity Channel Index (CCI) indicator period - the number of bars used for the indicator calculations; apply to - selection from
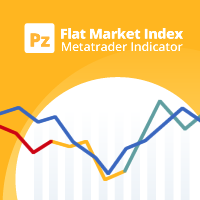
该指标计算代号相对移动了多少才能找到趋势或平淡的市场。它显示最新价格范围的定向百分比。 [ 安装指南 | 更新指南 | 故障排除 | 常见问题 | 所有产品 ] 零值表示市场绝对平稳 值100表示市场完全处于趋势 蓝线表示价格区间健康 红线表示价格范围窄 移动平均线是平坦市场指数(FMI) 它具有直接的交易含义。 当线条为蓝色且在FMI上方时,使用趋势交易策略 当线条为红色且低于FMI时,请使用范围交易策略 根据FMI执行仪器选择 该指标对于避免EA交易平淡交易特别有用。
输入参数 最大历史记录条数:加载时回顾过去的条数。 回顾:研究平盘市场指数的柱线数量。 周期:计算索引的平均周期。 ATR周期:指标中用于计算移动单位的ATR周期。
ATR乘数:ATR的乘数,用于计算索引的移动单位。
作者 ArturoLópezPérez,私人投资者和投机者,软件工程师和Point Zero Trading Solutions的创始人。

该指标预测价格反转,分析市场的看涨和看跌压力。购买压力是一定天数内所有累积柱的总和乘以交易量。卖压是相同数量条上所有分配的总和乘以交易量。 [ 安装指南 | 更新指南 | 故障排除 | 常见问题 | 所有产品 ] 指标比率使您可以衡量购买压力占总交易量的百分比,该值应在0到100之间波动。它执行两个移动平均值(快和慢),以识别压力趋势的变化并相应地寻找交易。 比率50表示市场均衡 比率超过70表示市场超买 比率低于30意味着市场超卖 红色虚线是当前比率 蓝线是信号线 橙色线是主线 它具有直接的交易含义。
市场超卖时寻找购买机会 市场超买时寻找销售机会 如果信号线高于主线,则压力看涨 如果信号线低于主线,则压力看跌
输入参数 周期:研究计算压力的条数 快速MA:直方图的快速平均周期 慢的MA:直方图的平均周期慢
作者
ArturoLópezPérez,私人投资者和投机者,软件工程师和Point Zero Trading Solutions的创始人。
该指标基于一定数量的柱线的真实高/低比率来分析当前市场波动的效率。 [ 安装指南 | 更新指南 | 故障排除 | 常见问题 | 所有产品 ] 比率是市场运动的有效性 比率低于1意味着市场无处可去 比率大于1意味着市场开始显示方向性 比率大于2表示市场正在显示有效的波动 高于3的比率表示市场移动太多:它将停止或回调 它具有直接的交易含义。 当线是红色时寻找位置机会 当比率为橙色时寻找区间交易机会 当比率为蓝色时寻找趋势交易机会
指标如何计算? 指标显示在期望的柱数期间市场移动了多少典型真实区间。典型的真实范围是从最后一根柱线开始的平均真实高-低范围,然后将其与同一时间段内的绝对市场走势进行比较。指标比率可以衡量范围和市场走势之间的比率,从而衡量市场效率。零表示市场效率低下,无处可去。
设置 该指标只有一个参数:指标周期,这是要回算的柱线数量。
作者 ArturoLópezPérez,私人投资者和投机者,软件工程师和Point Zero Trading Solutions的创始人。

The library is dedicated to help manage your trades, calculate lot, trailing, partial close and other functions.
Lot Calculation Mode 0: Fixed Lot. Mode 1: Martingale Lot (1,3,5,8,13) you can use it in different way calculate when loss=1 ,when profit=0. Mode 2: Multiplier Lot (1,2,4,8,16) you can use it in different way calculate when loss=1 ,when profit=0. Mode 3: Plus Lot (1,2,3,4,5) you can use it in different way calculate when loss=1 ,when profit=0. Mode 4: SL/Risk Lot calculate based on
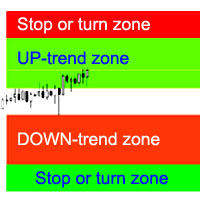
該指標計算最有可能的趨勢止損/逆轉區域,以及趨勢走勢的信心區域。
考慮到以下幾點:
價格變動率; 圖的相對偏差角度; 價格變動的平均範圍; 價格退出其“舒適區”; ATR 指標值。 當價格進入止損/反轉區域時,該指標可以發出警報。
設置 Draw the entire length? - 是否將區域繪製到圖形的末尾; Show Stop UP-trend - 顯示上升趨勢停止/反轉區域; Show UP-trend - 顯示自信的上升趨勢區域; Show DOWN-trend - 顯示一個自信的下降趨勢區域; Show Stop DOWN-trend - 顯示 DOWN 趨勢的停止/反轉區域; Alert in the area change - 當價格進入止損/趨勢變化區域時啟用警報; 接下來是每個交易區域的顏色設置。

This is a trend-following indicator that is most efficient in long-term trading. It does not require deep knowledge to be applied in trading activity. It features a single input parameter for more ease of use. The indicator displays lines and dots, as well as signals informing a trader of the beginning of a bullish or bearish trend.
Parameter Indicator_Period - indicator period (the greater, the more long-term the signals).

Mean Reversion Supply Demand Indicator Mean Reversion Supply Demand is the indicator to detect the important supply demand zone in your chart. The concept of supply demand trading relies on the quantity mismatching between buying and selling volumes in the financial market. Typically, supply demand zone serves to predict the turning point. The wave pattern, for any supply demand zone to work as an successful trade, looks like the price must touch the base zone, move away and then return to zone

Trend Hunter 是外汇、加密货币和差价合约市场的趋势指标。 该指标的一个特点是,它可以自信地跟随趋势,当价格略微刺穿趋势线时不会改变信号。 指标不会重新绘制;收盘后会出现入市信号。 当沿着趋势移动时,指标会显示趋势方向上的其他入场点。 根据这些信号,您可以使用较小的止损进行交易。 趋势猎人是一个诚实的指标。 当您将鼠标悬停在指标信号上时,会显示该信号的潜在利润和可能的止损。 当出现新信号时,您可以收到以下通知: 警报 推送通知 通过电子邮件通知 电报中的通知 图表的屏幕截图也会发送到 Telegram,因此您无需打开终端即可做出交易决定。 指标信号可以在电报频道中在线查看 https://www.mql5.com/zh/market/product/11085#!tab=comments&page=13&comment=50356403 趋势猎人扫描仪可帮助您评估其他货币对和时间范围的趋势方向。 您还可以使用扫描仪接收其他仪器的入场信号。 要自动化交易,您可以使用使用指标信号进行交易的顾问 该指标通过位于图表下方的便捷面板进行控制。 MT4 版本 https://www.

Two Dragon is an advanced indicator for identifying trends, which uses complex mathematical algorithms. It works in any timeframe and symbol. Indicator is designed with the possibility to customize all the parameters according to your requirements. Any feature can be enabled or disabled. When a Buy / Sell trend changes the indicator will notify using notification: Alert, Sound signal, Email, Push. Product reviews are welcome. We hope you will find it useful. МetaТrader 4 version: https://www.mq

Trend indicator. Displays a two-colored line on the chart, which shows the market direction. The blue color shows the uptrend. The red, respectively, shows the downtrend. It is recommended to use on charts with the M30 timeframe or higher. Simple strategy: When the line changes its color to blue, buy. When it changes to red, sell.
Parameters Trend Uncover period - period of the indicator;

The indicator displays points showing a symbol trend. Bullish (blue) points mean buy signals. Bearish (red) points mean sell signals. I recommend using the indicator in conjunction with others. Timeframe: M30 and higher. Simple strategy: Buy if there are two blue points on the chart. Sell if there are two red points on the chart.
Parameters Trend points period - The main period of the indicator; True range period - The auxiliary period of the indicator; Points calculation method - Calculation

The Expert Advisor modifies the Stop Loss orders of positions opened for the instrument of the current chart based on the custom indicator values. It is possible to use both the default settings or your own. Integrates NRTR (Nick Rypock Trailing Reverse) , Moving Average indicators and linear regression channel. Attention! To use the adviser, you must have minimal knowledge! Namely, to be able to look into the indicator code. You need to know the indicator buffer number in which support values a

Trend indicator. Designed for long-term trading. It is recommended to use on a chart with the M30 timeframe or higher. When the red line crossed the green line below the zero mark, and the green line, respectively, crosses from above, then it is a buy signal. When the green line crossed the red line above the zero mark, and the red line, respectively, crosses from above, then it is a sell signal.
Parameters Indicator period - period of the indicator. (The greater the period, the more long-term
This innovative technical indicator was created to detect quiet market period before the beginning of the high volatile market. Like many good technical indicators, this Market Activity Index is very stable and it is widely applicable to many financial and non financial instruments without too much restriction. The Market Activity Index can be used best to visualize the alternating form of low and high volatile market. It is very useful tool to pick up the quiet market but ironically this is the

The calculator of signals operates directly from the MetaTrader 5 terminal, which is a serious advantage, since the terminal provides a preliminary selection and sorts out signals. This way, users can see in the terminal only the signals that ensure a maximum compatibility with their trading accounts. The calculator of signals gives the answer to the one of the questions most frequently asked by users of the Signals service: "Will I be able to subscribe to the signal NNN, and what volume of the

If you wish to draw Support and Resistance lines, view: daily market opening, classical pivot levels, Fibonacci pivot levels, trend lines, Fibonacci levels, the remaining time to candle closing, and current spread. If you seek to place your orders with the exact lot that meets your desired stop loss risk. If you wish to do all this and more with just one click, then this is the perfect tool to use. This tool will allow you to feel more relaxed when deciding to open orders, as well as predicting

Partial Close Expert 是一种将许多功能组合到一个自动化系统中的工具。该 EA 可以通过提供多种选项来管理风险和最大化潜在收益,从而帮助交易者更有效地管理他们的头寸。 使用 Partial Close Expert,交易者可以设置 部分关闭 水平锁定利润,一个 追踪止损 水平,以保护利润和限制损失,一个 收支平衡 水平,以确保即使价格对他们不利,交易也会中断,以及其他几个功能。 通过使用这个多合一的智能交易系统,交易者可以节省时间和精力,因为他们不需要持续监控他们的交易。相反,EA 将根据市场情况执行预设指令,为交易者提供更大的灵活性和对交易的控制。 附加部分关闭专家, 按键盘上的“p” ,更改设置,然后就可以开始了。 部分关闭专家 安装和输入指南 如果您想获得有关 EA 添加 URL ( http://autofxhub.com ) MT4/MT5 终端的通知(见屏幕截图)。 MT4版本 https://www.mql5.com/en/market/product/14965 MT5版本 https://www.mql
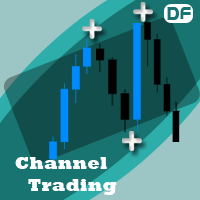
This Expert Advisor follows your channel lines that you draw. and when the price reaches these support and resistance trend lines, EA send open or close order automatically. You must draw two trend line with same color for EA to work, not equidistant channel line. and this color must be specified in ChannelColor parameter Strategies:
Inside Channel Strategy: If the price reaches bottom trend line, the EA will place a buy order. and when the price reaches the top trend point, EA send close orde

面板形式的多币种监控工具,可在单独的窗口中显示交易者选择的任何工具的图表。允许交易者对几种不同工具和不同时间段的价格走势进行可视化分析,从而在所选工具之间快速切换。 TradePad 產品描述頁面上提供了演示版本: https://www.mql5.com/en/blogs/post/751207 包含在另一个快速交易实用程序- TradePad 中 参量 Indicator UID - 是唯一标识符。每个运行的副本必须具有其自己的唯一ID。 to open a chart in the... - 参数设置打开工具图表的规则: current window - 当前图表窗口; new window - 新图表窗口。 Broker company label - 用于推式通知的公司名称,例如: ( MQ MT5 ) - 'EURUSD,Daily: Possible change trend direction on uptrend!' 。如果输入-?符号,将使用默认的公司名称;否则,将使用默认公司名称。 Allow changing chart bac

The Supply and Demand Zones indicator is one of the best tools we have ever made. This great tool automatically draws supply and demand zones, the best places for opening and closing positions. It has many advanced features such as multi timeframe zones support, displaying the width of zones, alert notifications for retouched zones, and much more. Because of market fractality, this indicator can be used for any kind of trading. Whether you are a positional, swing, or intraday trader does no

Fibo Trader is an expert advisor that allows you to create automated presets for oscillation patterns in reference to Fibonacci retracements values using fully automated and dynamically created grid. The process is achieved by first optimizing the EA, then running it on automated mode. EA allows you to switch between automatic and manual mode. When in manual mode the user will use a graphical panel that allows to manage the current trading conditions, or to take control in any moment to trade ma

Fibo Trader is an expert advisor that allows you to create automated presets for oscillation patterns in reference to Fibonacci retracements values using fully automated and dynamically created grid. The process is achieved by first optimizing the EA, then running it on automated mode. EA allows you to switch between automatic and manual mode. When in manual mode the user will use a graphical panel that allows to manage the current trading conditions, or to take control in any moment to trade ma

The Gravity EA is a multifunctional tool for automatic and semi-automatic implementation of Pairs Trading strategies. If you do not know what Pairs Trading is, look it up on the Internet to avoid misunderstandings.
The EA comprises: the ability to enable/disable the manual trading mode. You can open and close positions yourselves, based on the indicator values, or it can happen automatically. automatic money management automatic calculation of the optimum delta, the ability to manually specify

独特的“剥头皮”趋势指标,具有对结果线进行多层平滑和多种参数选择的功能。它有助于确定趋势的可能变化或几乎在运动开始时的修正。切换的交叉箭头固定并出现在新柱的开盘处,但是,如果有足够的经验,一旦指标线在未完成的柱上相交,就可以寻找入场机会。信号出现限制级别作为附加过滤添加到指标中。 参数: PeriodMA - 主要移动平均线计算周期 MethodMA - 主要移动平均计算方法 PriceMA - 主要移动平均线计算应用价格 BasePeriod - 基本趋势周期 BaseMethod - 基本趋势线的平均方法 BasePrice - 基本趋势线的应用价格 PowerPeriod - 趋势强度计算周期 PowerPrice - 趋势强度计算价格 PeriodBaseSmooth - 趋势线额外平滑的周期 BaseLineSmoothMethod - 附加平滑趋势线的方法 PeriodPowerSmooth - 强度线额外平滑的周期 PoweLineSmoothMethod - 强度线的附加平滑方法 ShowArrows - 启用交叉箭头的显示 Levels - 显示交叉箭头时的附加过

Elliott Wave Counter 是一个面板,用于快速和用户友好地手动标记 Elliott 波浪。可以选择一种颜色和一个级别的标记。还有用于删除最后一个标记和工具制作的整个标记的功能。一键制作标记。点击五次 - 有五波!艾略特波浪计数器对于艾略特波浪的初学者和专业分析师来说都是一个很好的工具。 艾略特波浪计数器安装和输入指南 如果你想得到 关于 EA 添加 URL ( http://autofxhub.com ) MT5 终端的 通知 (见截图)。 MT4版本 https://www.mql5.com/en/market/product/14016 MT5版本 https://www.mql5.com/en/market/product/15081 一般输入: 波形类型按钮: 此按钮允许用户选择他们想要在图表上突出显示的波形类型。可用的选项包括推动波、调整波和其他自定义波模式。 波级按钮: 这个按钮 允许用户选择他们想要在图表上突出显示的波形级别。可用的选项包括初级、中级和次级波级别。 波浪颜色: 这个 按钮 允许用户选择他们想要在图表上突出显示的波浪图

Introduction to Support Resistance Indicator Support and Resistance are the important price levels to watch out during intraday market. These price levels are often tested before development of new trend or often stop the existing trend causing trend reversal at this point. Highly precise support and resistance are indispensable for experienced traders. Many typical trading strategies like breakout or trend reversal can be played well around these support and resistance levels. The Precision Sup

一键式分析工具是 基于键盘快捷键的对象创建 和 MetaTrader 的复制工具。只需单击一下,即可轻松使用 MetaTrader 中的分析工具。使用我们的工具,您可以在图表上快速绘制支撑和阻力位、斐波那契位、形状、通道、趋势线和所有其他对象。只需单击按钮,移动鼠标,一键式分析工具将为您完成剩下的工作。这可以节省您的时间并使您的图表分析更有效率,让您可以专注于根据您的分析做出明智的交易决策。 除了对象创建之外,一键式分析工具还包括 对象复制器 ( c hart sync) ,允许您轻松地将对象从一个图表复制到另一个图表。如果您打开了多个图表并且需要在它们之间复制对象,这会特别有用。 一键式分析工具允许您 对所有符号使用一个图表 在元交易者中。这意味着您可以在同一窗口中查看不同的图表,而无需在多个图表之间切换。当您切换到不同的符号时,一键式分析工具会自动从其他符号中隐藏对象,并在您返回第一个符号时再次显示它们。这可以帮助您节省时间并提高交易效率,让您可以轻松地在同一窗口上比较和分析不同的图表。 一键分析 安装和输入指南 如果您想获得有关 EA 添加 U

The indicator plots three consecutive channels by Close prices and checks if they match the scheme shown in the screenshots. The length of each channel is not fixed and is selected by the program within the range ChMin and ChMax . When the match is found, a signal is formed (an appropriately colored arrow). A possible stop loss level is displayed as a diamond. A signal may be accompanied by a pop-up window, a push notification and/or an email. The indicator works by Open prices.
Parameters ChM

The indicator detects and displays М. Gartley's Butterfly pattern. The pattern is plotted by the extreme values of the ZigZag indicator (included in the resources, no need to install). After detecting the pattern, the indicator notifies of that by the pop-up window, a mobile notification and an email. The pattern and wave parameters are displayed on the screenshots. The default parameters are used for demonstration purposes only in order to increase the amount of detected patterns.
Parameters

The indicator detects divergence signals - the divergences between the price peaks and the MACD oscillator values. The signals are displayed as arrows in the additional window and are maintained by the messages in a pop-up window, e-mails and push-notifications. The conditions which formed the signal are displayed by lines on the chart and in the indicator window.
The indicator parameters MacdFast - fast MACD line period MacdSlow - slow MACD line period MacdSignal - MACD signal line period Mac

The multi-timeframe indicator of the levels of the Pivot Points. Every closed daily period has its own so-called reference point - Pivot Point, which sets the levels for smaller intraday timeframes for the following day. The Pivot Points indicators existing in the codes have no method of showing the dynamics of the pivot point changes on the historical data of the price chart. Pivot Point calculation formula. Pivot=(High + Low + Close) /3 High — the maximum of the previous day; Low — the minimum

COSMOS4U Adaptive MACD indicator is a very simple and effective way to optimize your trade decisions. It can be easily customized to fit any strategy. Using COSMOS4U optimized AdMACD parameters, you can ensure confirmed buy and sell signals for your trades. In addition, the AdMACD displays divergence between the security and MACD trend, in order to provide alerts of possible trend reversals and it is also enhanced with a Take Profit signal line. We suggest trying out the optimized parameters tha

HiLo Activator is one of the most used indicators to determine trend. Find it here with the ability to customize period and colors. This indicator also plots up and down arrows when there is a change on the trend, indicating very strong entry and exit points. HiLo fits well to different types of periods for day trading. You can easily understand when it is time to buy or sell. It works pretty good also for other periods like daily and monthly signalizing long-term trends. The use of the indicato

The Smooth Price technical indicator is used for plotting a smoothed line as close to the price of the financial instrument as possible, and serves to eliminate its noise components. The indicator is part of the Monarch trading system, but here it is presented as an independent technical analysis tool. The indicator is based on the cluster digital filter , which, unlike the ClusterSMA , is applied directly to the price time series. Smooth Price does not redraw (except the very last, zero bar) an
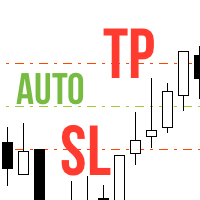
Never forget to set Stop Loss or Take Profit! This little EA automatically sets predefined Stop Loss and Take Profit levels on every new pending or market order. You can specify Stop Loss and Take Profit distances in pips in the EA settings dialogue. Please note that there is only one EA necessary for all charts of the same symbol. The EA works with all symbols within Metatrader 5.

Advanced ideas of the popular MACD indicator: It detects and displays classic and reverse divergences (two methods of detecting divergences). It uses different color to highlight an uptrend and a downtrend. Two methods of determining a trend: а) MACD crosses the 0 level (classic signal); б) MACD crosses its own average (early signal). This is a multi-timeframe indicator: it can display MACD data from other timeframes. Two methods of drawing: classic histogram and line. It generates sound and vis

HWAFM (the harmonic wave analysis of the financial markets) Harmonic trading involves searching for certain price patterns (specimens) and Fibo numbers in order to define highly probable price reversal points. The method is based on the assumption that trade patterns or cycles repeat themselves just like in real life. The main objective is to identify these patterns, as well as position entries/exits. The analyzer is based on a high degree of probability, which is confirmed by the price movement
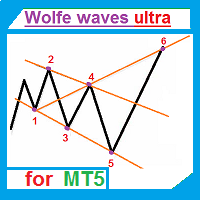
The indicator automatically draws Wolfe waves. The indicator uses Wolfe waves found in three timeframes. This indicator is especially accurate because it waits for a breakout in the wave direction before signaling the trade. Recommended timeframe: М1.
Indicator features Amazingly easy to trade. The indicator is able to recognize all the patterns of Wolfe waves in the specified period interval. It is a check of potential points 1,2,3,4,5 on every top, not only the tops of the zigzag. Finds the

This indicator shows the time before the next bar or candle opens. Examples of the remaining time until a new bar opens: Example for the М1 timeframe: 05 = 05 seconds. Example for the Н1 timeframe: 56:05 = 56 minutes, 05 seconds. Example for the D1 timeframe: 12:56:05 = 12 hours, 56 minutes, 05 seconds. Example for the W1 timeframe: W1(06): 12:56:05 = 6 days, 12 hours, 56 minutes, 05 seconds. МetaТrader 5 version: https://www.mql5.com/en/market/product/13564 Settings color_time - Text

The Correct Entry indicator displays specific relatively correct points of potential market entries on the chart. It is based on the hypothesis of the non-linearity of price movements, according to which the price moves in waves. The indicator displays the specified points based on certain price movement models and technical data.
Indicator Input Parameters: Сorrectness – The parameter characterizes the degree of accuracy of the entry signals. Can vary from 0 to 100. The default is 100. Accura

Every indicator has its advantages and disadvantages. Trending ones show good signals during a trend, but lag during a flat. Flat ones thrive in the flat, but die off as soon as a trend comes. All this would not be a problem, if it was easy to predict when a flat changes to a trend and when a trend changes to a flat, but in practice it is an extremely serious task. What if you develop such an algorithm, which could eliminate an indicator's flaws and enhance its strengths? What if such an algori

The indicator looks for flat zones, where the price remained within a certain range for quite a long time.
Settings History - history for calculation/display in bars FlatBars - flat area width in bars FlatRange - flat area height in pips IncludeSmallBar - calculate using internal flat bars CalcFlatType - calculate flat zones by (HIGH_LOW/OPEN_CLOSE) DistanceForCheck - distance (in pips) from the flat level, at which the check is enabled CountSignals - amount of signals per level AutoCalcRange

The draws trend lines with adjustable trend width, with trend breakout settings and notifications of trend breakout (Alert, Sound, Email) and of a new appeared arrow. Arrows point at the direction of the order to open (BUY, SELL).
Parameters MaxHistoryBars - the number of bars in the history. Depth (0 = automatic settings) - Search area. width trend ( 0 = automatic settings) - Trend width. (true = closed bars on direction trend),(false = just closed bars for line) - true = closure of candlesti
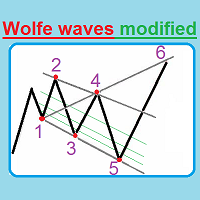
This unique indicator automatically builds Wolfe Waves and features a highly efficient trading strategy. Use If number 5 appears, wait till the first candle is closed behind Moving Average, then look at the three center lines showing what lot volume should be used if the fifth dot crossed the line 25%. The candle is closed behind Moving Average, and then we open a trade with the lot: = (Let's apply the lot of, say, (0.40), divide it into four parts and open a quarter of the lot (0.10)). If the
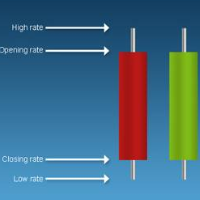
'Info body and shadow candles' indicator colors the candle bodies and shadows according to the settings. For example, if the 'Size body candles' parameter is 10, the indicator looks for the candles having a body size of 10 or more. Candle shadows are calculated the same way. Detected candles can be colored (body color, shadow color). The indicator can be adjusted for both four- and five-digit quotes. МetaТrader 4 version: https://www.mql5.com/en/market/product/12618 Parameters Use candle searc
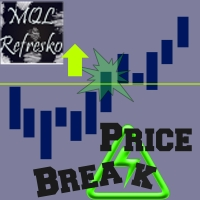
The "Price Break" indicator is a powerful tool for any trader. If the price breaks the levels the indicator shows, there is aproximatelly a 77% chance it will go in the same direction. If it exceeds the blue line, there are many possibilities for the price to rise. On the contrary, if it passes down the red line, it means that there are many possibilities for the price to drop. We should always consider the latest indicator signal, so we should rely only on the last blue arrow and the last red a

This oscillator was developed exclusively by xCalper in 2015 based on moving averages calculations to indicate and try predicting oversold and overbought levels. The fast line (white, by default) oscillates basically between values -0.5 (oversold) and +0.5 (overbought). Whenever this line crosses upward value -0.5, it means an oversold price level. When it crosses downward value +0.5, it means an overbought price level. When fast line crosses value 0.0 and returns, it is a strong pull-back indic
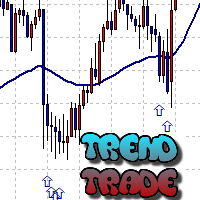
The Trend Trade indicator displays assumed turning points of the price on the chart in the direction of the trend after correction. It is based on the data of the Prise Reversal oscillator with the period 6 and indicators which characterize strength and availability of the trend. When the value of Prise Reversal is in overbought or oversold area (area size is set by a user), and the current trend is confirmed, the Trend Trade indicator draws an arrow pointed to the further assumed price movement
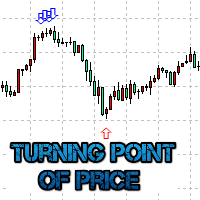
The Turning point of price indicator displays assumed turning points of the price on the chart. It is based on data of the Prise Reversal oscillator and standard ADX. When the value of Prise Reversal is in overbought or oversold area (area size is set by a user), and the value of the ADX main line exceeds the preset value, the Turning point of price indicator draws an arrow pointed to the further assumed price movement. This idea is described in the article Indicator of Price Reversal .
Inputs

The indicator is similar to https://www.mql5.com/en/market/product/12330 . However, it considers the MQL5 platform features. Peaks and bottoms are calculated based solely on external bars. After a swing is formed, the indicator does not redraw providing opportunities for traders working on horizontal level breakthroughs. Traffic can be reduced by changing the amount of calculated bars in the MinBars variable (default value is 500). All you need is to select the output options, so that you can se

The indicator is based on the two-buffer scheme and does not require any additional settings. It can be used on any financial instrument without any restrictions. The indicator is a known ZigZag, but it does not redraw . The indicator allows to easily detect significant levels on the price chart, as well as demonstrates the ability to determine the probable direction of a price movement. The calculations are based on the candles' Close prices, thus improving the reliability of the levels.
Para

Bober Real MT5 is a fully automatic Forex trading Expert Advisor. This robot was made in 2014 year and did a lot of profitbale trades during this period. So far over 7000% growth on my personal account. There was many updates but 2019 update is the best one. The robot can run on any instrument, but the results are better with EURGBP, GBPUSD, on the M5 timeframe. Robot doesn't show good results in tester or live account if you run incorrect sets. Set files for Live accounts availible only for c
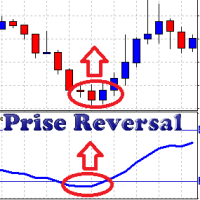
The oscillator uses data of standard indicators and some patterns of price movement. Using this data, it forms its own (more accurate) signals of a change in the direction of the price movement. Prise Reversal helps to identify reversal points during the flat, and the price extremums during the trend. At these points, you can enter counter trend with a short take profit. Besides, it indicates time intervals when it is too late to open a trend-following deal. After a few days of using the indicat
This indicator works only 5 digits Brokers. It is impossible to talk about the study of the Forex market or any market without considering of that market statistics. In this case, our indicator "price statistics" we have a new way to study our chart, giving information of the price in a range of pips you want to study for example, can we know how many times the price closes or opens into spaces 10, 20, 30, 50, 100 pips or more; and know them not only in numbers but also draws this relationship a
BuyLimit and SellLimit Buttons opens any combination of Buy Limit and Sell Limit pending orders and closes all existing pending orders.
Inputs Before placing all pending orders, the input window is opened allowing you to modify all input parameters: DeleteAllPendings ; if true , all pending orders (for the current currency) can be deleted. BuyLimit ; if true , Buy Stop orders can be opened. SellLimit ; if true , Sell Stop orders can be opened. InitLot ; initial lot size. LotCoeff ; next lot si

When looking at the information of On Balance Volume indicator, a question arises: is it a strong or weak movement? Should it be compared with previous days? These data should be normalized to always have a reference.
This indicator presents the followings parameters: Normalization period (Max-Mins absolute) Smoothing period (-1 off) Tick/Real Volume Maximum number of bars to calculate (-1 off) Upper value normalization Lower value normalization Calculation: normOBV = (value - absMin) * (relMa

The "Five Candle Pattern" indicator is a novel way to see the market, because with it we can compare and/or seek training or the pattern of the past 4 or 5 Candles, and identify them in the same graph, to view your behavior at an earlier time. The indicator creates a pattern of those 4 or 5 candles and searches backward, identifies, and marks the same formation or pattern. With that information you adjust the strategy that is operating, or create a new one, because you can compare the past devel

The indicator colors bullish, bearish and doji candles. Also, the amount of candles (bullish, bearish and doji) for the last N days is calculated. You can select colors for both bodies and shadows of candles, as well as enable coloring of only candle bodies МetaТrader 4 version: https://www.mql5.com/en/market/product/11624 Parameters color bulls = color of bullish candle bodies color shadow bulls = color of bullish candle shadows color bears = color of bearish candle bodies color shadow bears =
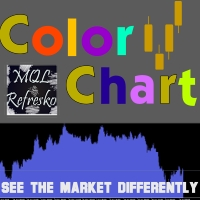
Visualize your charts differently in MetaTrader 5. The product is good for comparing the prices, since the indicator draws High, Close, HLC, etc. It is useful when applied with other indicators (like MACD). This simple indicator colors the entire space below the chart allowing you to see the market with greater clarity. You will see the actual price, trends, and the market behavior.
Indicator parameters Applied_Price : From this option you can select the type of price you want to draw with the

COSMOS4U Volume indicator facilitates your trade decisions. It gives confirmation of the running movement and market trends. It highlights current and past accumulation and distribution volumes, comparing them to moving average volume and the highest volume. In addition, it identifies and marks nuances as well as convergence and divergence patterns of bears and bulls in order to provide the market trend and price ranges. The supported features are as follows: Fast Volume Moving Average Slow Volu

This is a well-known ZigZag indicator. But it differs by the fact that its plot is based on values of the middle line which is set by a user. It can display Andrews’ Pitchfork and standard or Bobokus Fibo levels. NO REPAINTING.
Parameters Period МА — middle line period. Default value is 34. Minimum value is 4. Maximum value is set at your discretion. Used to calculate price — type of price used for the midline calculations. The averaging method — type of smoothing for the middle line. Turning
MetaTrader市场提供了一个方便,安全的购买MetaTrader平台应用程序的场所。直接从您的程序端免费下载EA交易和指标的试用版在测试策略中进行测试。
在不同模式下测试应用程序来监视性能和为您想要使用MQL5.community支付系统的产品进行付款。
您错过了交易机会:
- 免费交易应用程序
- 8,000+信号可供复制
- 探索金融市场的经济新闻
注册
登录