适用于MetaTrader 5的新EA交易和指标 - 73

UR時刻
UR Momenter 完美地計算了與以震盪指標表示的價格走勢耗盡相關的價格動量。 因此,這為我們提供了潛在逆轉或回撤的真正早期信號。 這個公式是在 2018 年市場泡沫破裂後發現的。
使用 UR Momenter 的優勢:
無參數 您有 2 條線描述價格走勢 - 白線是與價格移動平均偏差相關的價格動量,表示為振盪器(藍線) 直方圖是價格動量背景下最大偏差的可視化 該界面展示了兩個極端(上部紅色區域和下部綠色區域)的任一條線的耗盡 最大優勢:簡單且可適應所有資產。 有一個特殊的電報聊天,您可以在其中了解最新的工具更新,如果您覺得缺少什麼,也可以發送請求!
為什麼選擇 UR Momenter?
該指標可用作獨立的進入或退出指標。 由於它對價格的依賴 - 它可以應用於每個圖表,其偏差計算算法基於多年的經驗和觀察。
如何使用 UR Momenter?
請參閱下面的描述以更熟悉它:
設置 沒有任何 展示
價格平均主線(白色):價格的動量 價格震盪指標(藍色):價格與其移動平均線的偏差。 直方圖:顯示動量的偏差。 極端區域:價格將耗盡並

其中一个数字序列称为“森林火灾序列”。它被公认为最美丽的新序列之一。它的主要特点是该序列避免了线性趋势,即使是最短的趋势。正是这一属性构成了该指标的基础。 在分析金融时间序列时,该指标试图拒绝所有可能的趋势选项。只有当他失败时,他才会认识到趋势的存在并给出适当的信号。这种方法可以让人们正确地确定新趋势开始的时刻。然而,误报也是可能的。为了减少它们的数量,该指标添加了一个额外的过滤器。当新柱打开时会生成信号。在任何情况下都不会发生重绘。 指标参数: Applied Price - 应用价格常数; Period Main - 指标的主要周期,其有效值在 5 - 60 之间; Period Additional - 附加周期,此参数的有效值为 5 - 40; Signal Filter - 附加信号滤波器,有效值 0 - 99; Alerts - 启用后,指示器会在出现新信号时提醒您; Send Mail - 允许指标向电子邮件发送消息; Push - 允许您发送 Push 消息。

還剩 10 份 - 下一個價格是 600 美元。
價格將上漲,直到達到 2500 美元。
購買後想收到禮物請私信我!
Bayraktar 是一個創新的隔夜剝頭皮 EA
EA 交易是為交易貨幣對而設計的。
參數說明:
START_LOT - N 個餘額單位的初始批次 (FROM_BALANCE)。如果 FROM_BALANCE = 0,則使用固定的起始手數; STOPLOSS_PCT - 最大損失; TAKEPROFIT_PCT - 獲利; LOT_MULTIPLIER - 手數乘數; MAX_LOT - 最大手數; STEP_ORDERS - 訂單之間的距離; STEP_MULTIPLIER - 距離乘數; MAX_STEP - 最大距離; MAX_ORDERS - 最大訂單; OVERLAP_PIPS - 重疊訂單的點數; MAGIC_NUMBER - 幻數; ONE_AT_TIME - 多重交易;

Description :
A utility to create and save screenshots automatically and send to a chat/group/channel on telegram.
The saved/sent image file will include all objects that exist on the chart and also all indicators are displayed on the chart.
Features: Save screenshot of chart including all objects, indicators, ... Send screenshots to a telegram chat/group/channel
Wide range options to select when create screenshots
Logo and text adding feature
Inputs and How to setup the EA :
Variou

Market Profile 3 MetaTrader 5 indicator version 4.70— is a classic Market Profile implementation that can show the price density over time, outlining the most important price levels, value area, and control value of a given trading session. This indicator can be attached to timeframes between M1 and D1 and will show the Market Profile for daily, weekly, monthly, or even intraday sessions. Lower timeframes offer higher precision. Higher timeframes are recommended for better visibility. It is als
FREE

** All Symbols x All Timeframes scan just by pressing scanner button ** ***Contact me to send you instruction and add you in "RSI scanner group" for sharing or seeing experiences with other users. Introduction RSI divergence is a main technique used to determine trend reversing when it’s time to sell or buy because prices are likely to drop or pick in the charts. The RSI Divergence indicator can help you locate the top and bottom of the market. This indicator finds Regular divergence for pullba

Flag Pattern pro is a Price Action (PA) analytical tool that scans the continuation patterns known as "Flag and Pennant Patterns" .
Flag and Pennant patterns are continuation patterns characterized by a move in a previous trend direction after a shallow retracement usually below 50% of the original move . Deep retracements can however be sometimes found at the 61.8 % levels. The original move is know as the flag pole and the retracement is called the flag.
Indicator Fun

This indicator scans the 1-3 Trendline pattern . The indicator is a 100 % non repaint low risk breakout system . The patterns are formed around swing high and swing lows which make them a low risk pattern with high reward.
PATTERN BACKGROUND The 1-3 Trendline Breakout pattern is formed by four(4) points which are composed of three (3) primary points and the pattern neck. A trendline is always formed by the point 1 and the neck of the pattern . When price breaks out of the trendline formed ,
TRACKINGLEVELS (SUPPORTS AND RESISTANCES)
TrackingLevels is a useful indicator that saves considerable time when a trader starts analyzing a chart. This indicator draw on the chart all the resistances and supports that the market is creating. The resistance and support levels are very important, this levels define areas where there can be a considerable accumulation of sell or buy orders. These are a key areas that every trader must know and keep in mind all the time. This indicator helps the
Hello friends. I wrote this utility specifically for use in my profile with a large number of Expert Advisors and sets ("Joint_profiles_from_grid_sets" https://www.mql5.com/en/blogs/post/747929 ). Now, in order to limit losses on the account, there is no need to change the "Close_positions_at_percentage_of_loss" parameter on each chart. Just open one additional chart, attach this utility and set the desired percentage for closing all trades on the account. The utility has the following fu
FREE

Drawdown Limit EA Prop Firm trading MT5
If you found this EA, it's probably because you want to get a funded account with a prop firm, but you see a rule that most of traders fear : Maximum Daily Drawdown. I've been through this problem myself as I'm a prop firm trader and I've made a bot to solve this rule, and you can get it to solve this problem too.
How does it work ?
When you first setup this EA, you need to input the initial deposit which corresponds to the size of your funded accoun

The currency strength momentum has a lot of similarities with currency strength meter presented in the previous page, but the difference are much more pronounced. You can try putting both in the same chart and see the difference in results. Currency strength momentum measures strength of a currency based on (you guess it) it's momentum relative to other currencies, while currency strength meter measures the strength of a currency based on pips it has moved in a certain direction.
FREE

LAZY TRADER MT5
LIVE SIGNAL - CLICK HERE
SETTING FILES FROM LIVE SIGNAL - CLICK HERE
PRICE WILL INCREASE EVERY 1 TO 2 WEEKS. GETTING IT EARLY GETS YOU THE BEST PRICE.
Lazy Trader was designed to do all of the complex trading for you, so you can you relax on your couch, or sleep the night away. There is no reason to learn how to trade Forex when using Lazy Trader.
YOU DO NEED TO UNDERSTAND RISK AND MONEY MANAGEMENT HOWEVER...... Ok to Be Lazy and Smart, but PLEASE not Lazy a
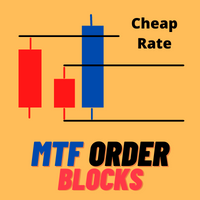
30% OFF ONLY 10 COPIES HURRY UP! 8 LEFT COPIES Very precise patterns to detect High Accurate Order Blocks: It Draw zone after market Structure Breakout with a high Accuracy, institutional orders with the potential to change the price’s direction and keep moving towards it, have been placed. Features Auto Order Blocks Draw MTF Order Blocks Double Signal One Alert Signal Second Long Wick Rejection Signal Market Structure BOS LINE How to show MTF order Block Go on indicator setting at the en

Hello;
This indicator provides input and output signals of real volume levels with some mathematical calculations. It is simple and safe to use. As a result of the intersection of real volume levels with averages, it creates buy and count signals.
Indicator parameter descriptions:
A-PERIOD: Indicates the number of bars to be calculated.
B-GAMMA: A fixed Fibonacci trend average of 0.618 is used.
Use C-VOLUME TYPE:Tick volume as a constant.
D-HIGH LEVEL 2: Represents the level of the

WHITE HORSE EA is a fully automated & customizable EA.
The EA's objective is to provide steady incomes with a high level of safeness .
FUNCTIONING :
The algorythm based on an auto-adaptive system, is constantly controlling the distance between orders.
The safeness is improved by 2 indicators : ADX and ATR
You can select your trading session ( Tokyo, London, New York)
You can select the news you want to trade (Low, medium or high impact)
STRATEGY:
- The curve

NEW: A Fully Automated strategy using price action and candle patterns to trade Gold (XAUUSD).
This EA can be used on any currency but recommended for XAUUSD, EURUSD and BTCUSD Safe stop loss option for FTMO and other funded accounts. REAL BACKTEST DATA - no manipulation or backtest conditioning like other EAs! 100% Modelling Quality Backtest! USE: Default settings on XAUUSD & XAUAUD on the M15 timeframe. Use ECN account for best results.
MAIN SETTINGS Setting Value Description
Automatic Expert Advisor. Night scalp system, with trend detection and pullback entry. Dynamic exit signal, for SL or TP. Every trade has fix SL. No usage of risky strategies like martingale, hedge, grid etc.
About EA Scalper strategy Technical strategy Can use with small deposits Pairs with best rezults: AUDNZD, AUDCAD, AUDCHF, EURAUD, GBPAUD, USDCHF, CADCHF, EURNZD, EURGBP, GBPCAD, GBPCHF, EURCHF Time Frame: M15 Recommendations Broker account with ECN and low spread Test it first to find out
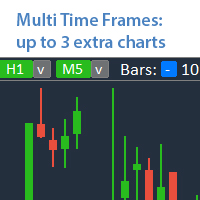
Analyze up to 3 additional charts of other timeframes , without switching the main chart. My #1 Utility : includes 65+ functions | Contact me if you have any questions The indicator opens in a separate window: The window can be moved to any place on the chart (using the [<M>] button). The window can also be minimized to save space ( [ <^>] button) In the window that appears, you can configure: The period of the 1st chart (left);
The period of the 2nd chart (center); The peri

GM Bounty Hunter MT5 is a fully automated/semi-automatic, The robot trades according to the overbought and oversold levels of the market. The EA's unique trading strategy has a high probability of winning. GM Bounty Hunter MT5 is optimized for use with low spread currency pairs. Info:
Working symbol XAUUSD, EURUSD, GBPUSD, USDJPY,.... Working Timeframe: M1, .....(The larger the timeframe, the more stable the signal) Min deposit $125 with Stop Loss settings (or equivalent in cents ) The minimu

В основе индикатора EasyBands лежит тот же принцип, что и при построении Bollinger Band. Однако, данная модификация индикатора использует вместо стандартного отклонения средний торговый диапазон (Average True Range). Соответственно, с данныи индикатором абсолютно аналогично можно использовать все стратегии, которые применяются с Bollinger Band. В данной версии индикатора используется двенадцать уровней и средняя линия (белый цвет). Индикация тренда выполнена в виде окраски свечей в зависимости
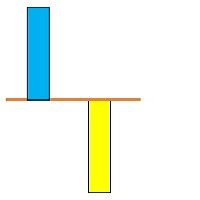
A technical Indicator Providing Price Convergence Signals along with value for experienced and professional traders. Easy to comprehend, Easy to understand.
This is a helping tool provides best signals. This indicator is designed based on the fundamentals of trade. A very good indicator you can customized its color. A best tool to find trade direction.
An adaptive indicator. It constantly adapts to the trade.

A value indicator for experienced and professional traders. It is helping tool to indicate the direction value gain. A best helping tool to trade value. This indicator is equipped with a colored line and a digital tool to indicate value numerically .
This indicator also helps to indicate value during trends. A study based on this indicator shows value of trade significantly changes during trends best tool to cash the trends.

Best helping tool for Professional and Experienced traders. A best Tool To find the trend. Instruction Manual: First Select your desired Symbol. Then attach this tool and wait till it identify the trend for you. Then it will be more feasible to trade.
Once again best tool to trade. Demo version is available you can fully test its functionality. More importantly there are always trend breaks Once Trend break is observed un-attach this tool and then re-attach to get the fresh trend. Precautions
A basic tool for traders to trade percentile of the value. It indicates both values in the for of digits appeared on the left corner of the screen.
Instructions Manual : First choose your desired symbol and then select this tool. Please be remined that this tool is just a helping tool. its upon trader what he chooses. The function of this tool is just to provide a help in trading.

动量反转是一个强大的工具,用于检测可能的反转点和修正的开始,基于对价格运动强度和柱形的分析。
_________________________________
如何使用指标信号:
指标在新的价格条出现后产生信号。 建议在价格突破指定方向的临界点后使用生成的信号。 指标不重绘其信号。
_________________________________
指标参数建议更改信号箭头的显示样式。 不提供更改用于计算的参数-这是由于我的产品的哲学:稳定性和客观性。
_________________________________
欢迎您的任何问题和建议,可以私信发送
_________________________________
提前感谢所有有兴趣的人,祝你好运征服市场!
FREE

市场调色板是一个强大的工具,过滤交易决策的惯性和加速价格波动。
_________________________________
如何使用指标信号:
指标生成三种不同颜色的直方图信号。 在标准配色方案中,当出现蓝色列时,建议只保留多头头寸,当出现红色列时,只保留空头头寸,当出现灰色列时,避免交易操作。 较高列的出现意味着形成价格变动的临界点-有很高的可能性改变列的颜色。
_________________________________
指标参数建议更改直方图显示的样式。 不提供更改用于计算的参数-这是由于我的产品的哲学:稳定性和客观性。
_________________________________
欢迎您的任何问题和建议,可以私信发送
_________________________________
提前感谢所有有兴趣的人,祝你好运征服市场!
FREE

一个简单的专家顾问交易欧元/美元货币对,而不仅仅是
由 BUX EA 引擎提供动力 https://www.mql5.com/en/market/product/82887
选择。VAR:S1 (OPT.VER: S1)
信号生成的最佳指标集 有信号/无信号、挂单的开仓/平仓交易 鞅模式(包括动态鞅) 虚拟追踪止损(对经纪商不可见)
使用策略测试器测试和优化您的交易策略
所有必要的信息都在常见问题解答中。 https://docs.google.com/document/d/1mIEhAeDSlmc5OtgwMSnlw7HSDK0Yvjk_1H36rMX7QZU/edit?usp=sharing
由 BUX EA 引擎提供动力 https://www.mql5.com/en/market/product/82887
一个简单的专家顾问交易欧元/美元货币对,而不仅仅是
精简版的 BUX SOLO
由 BUX EA 引擎提供动力
选择。VAR:S1 (OPT.VER: S1)
信号生成的最佳指标集 有信号/无信号、挂单的开仓/平仓交易 鞅模式 虚拟追踪止损(对经纪商不可见)
使用策略测试器测试和优化您的交易策略
所有必要的信息都在常见问题解答中。 https://docs.google.com/document/d/1mIEhAeDSlmc5OtgwMSnlw7HSDK0Yvjk_1H36rMX7QZU/edit?usp=sharing
由 BUX EA 引擎提供动力 https://www.mql5.com/en/market/product/82887

显示当前主要市场交易时段和开始下一个交易时段的剩余时间。
市场
纽约 伦敦 法兰克福 东京 西德尼 另外 1 个会议 自定义名称、开始和结束时间
时钟时间
格林威治标准时间/世界标准时间 本地(来自计算机) 经纪人(服务器时间) 设置上的默认时间是格林威治标准时间。 更改为本地时间或经纪人时间后,需要根据选择的时间类型手动调整每个会话的打开和关闭时间。 每个市场开 和 收市 时间可以调整
图形设置 每个会话都可以单独显示或隐藏。 这将包括: 会话名称,在打开的栏上 开盘价格线,将在交易结束前绘制 背景颜色 会话背景颜色有 2 种模式
第一条,用作分隔符 完整的会议期间,从开始到结束
* 会话颜色会在重叠时混合。 这将在图表上创建一种新的特定颜色,希望有助于轻松发现历史数据上的重叠 * 在图表上绘制太多会话可能会造成混淆 * 图表上之前可见的时段可以按天数进行限制。 增加天数将增加在图表上启动指标的时间,具体取决于使用的时间范围 * 自动对比度校正功能将在设置为开时尝试调整与图表背景颜色相关的颜色
FREE
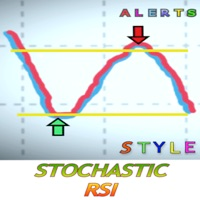
什么是随机RSI?
随机RSI(StochRSI)是技术分析中使用的一个指标,其范围在0和1之间(或在某些图表平台上为0和100),是通过将随机振荡器公式应用于一组相对强度指数(RSI)值而不是标准价格数据来创建的。这个版本包括提醒,不要错过真正的好机会。当你想接收买入信号或卖出信号时,你可以设置参数。为了接收任何信号,你必须通过MetaQuotes ID连接你的桌面版和Metatrader应用程序。MetaQuotes ID在你的MT4/5应用程序的设置>>聊天和信息中找到。在桌面上是在工具>>选项>>通知。你把ID放在桌面版上,激活通知,就可以开始了。
试试MT4版本, 这里
因为风格很重要
我知道每次都要点击属性来改变蜡烛的颜色、背景是浅色还是深色,以及放置或删除网格是多么令人厌烦。这里有一个一键式的解决方案。 三个可定制的按钮可以选择交易者想要的蜡烛样式。 一个按钮可以在白天和夜晚模式之间切换。 一个按钮可以在图表上显示或隐藏网格。 ***** 在设置中,你可以选择按钮在屏幕上的显示位置*****。
另外,请考虑查看我的其他产品 https://www

鞅。 “Constructor Simple MT5”EA 由 5 個獨立的 EA 組成 ,它們同時工作且彼此獨立: 酒吧交易。 使用 iEnvelopes 指標進行交易。 使用 iMA 指標進行交易。 使用 iIchimoku 指標進行交易。 使用 iSAR 指標進行交易。 “Constructor Simple MT5”EA 是 “Constructor MT5” EA 的簡化版本。輸入參數的數量減少到最低限度,這有助於智能交易系統的使用及其優化。 顧問特點: 字符可能會重複。 每個策略最多可以使用 4 個貨幣對。 如果您的經紀商貨幣對的符號名稱包含後綴或前綴(例如 #.EURUSD.ch ),則有必要在輸入數據中完全註冊它們。 在一個交易賬戶上,您可以安裝多個具有不同設置的“Constructor Simple MT5”(觀察條件:Magic[i+1]>Magic[i]+5)。 安裝在任何一張圖表上。 如果您的軟件功能低下,那麼在“Every_tick_based_on_real_tick”模式下測試會很困難,或者可能會在加載貨幣對報價歷史時由於內存不足而結束。 在這種情況下,

https://c.mql5.com/31/761/best-trend-indicator-logo-200x200-8493.png 该指标用一条红绿相见的实线来反映市场价格的万千变化。 绿线表明市场价格处于上 升期间 , 红线表明市场价格处于下跌期间。
实线颜色 的改变预示着市场已经发生变化行情极有可能会出现逆转! 建议您在日K线图上使用该指标。该指标不适合您做超短线交易! 众所周知,趋势线是技术分析家们用来绘制的某一证券 (股票) 或商品期货过去价格走势的线。目的是用来预测未来的价格变化。这条 趋势 线是通过联结某一特定时期内证券或商品期货上升或下跌的最高或最低价格点而形成的。它可以预测该证券或商品期货是处于上升的趋势还是处于下跌的趋势。但是,您一定要认识到每一个指标都有是有缺陷的,这个世界上没有任何一个指标可以精准的预测到市场未来的发展方向。因此,我建议您在使用这个指标的时候结合其他的技术分指标,以此获得更好 的 效果 。
This utility tool shows the ticker symbol, timeframe, and description information as a watermark on the chart. Text resizes automatically according to chart size. It is useful to identify the correct chart when multiple charts are shown on the screen. Want more control over text apperance? Check out our Chart Watermark MT5 Premium utility. See the demonstration video below!
Inputs: Font Size: Initial font size for the ticker symbol and timeframe text (Default; 50). Description text font siz
FREE

本指标 基于 Zigzag 基础上... 增加了: 1.增加了箭头指示,使图表更鲜明 2.增加了价格显示,使大家更清楚的看清价格. 3.增加了报警等设置,可以支持邮件发送 原指标特性: 1.基本的波段指标构型. 2.最近的2个ZIGZAG点不具有稳定性,随着行情而改变,(就是网友所说的未来函数) 3.原指标适合分析历史拐点,波段特性,对于价格波动有一定的指导性.
Zigzag的使用方法一 丈量一段行情的起点和终点 (1)用ZigZag标注的折点作为起点和终点之后,行情的走势方向就被确立了(空头趋势); (2)根据道氏理论的逻辑,行情会按照波峰浪谷的锯齿形运行,行情确立之后会走回撤行情,回撤的过程中ZigZag会再次形成折点,就是回撤点; (3)在回撤点选择机会进场,等待行情再次启动,止损可以放到回撤的高点。 一套交易系统基本的框架就建立起来了。 Zigzag的使用方法二 作为画趋势线的连接点 趋势线是很常见的技术指标,在技术分析中被广泛地使用。 但一直以来趋势线在实战中都存在一个BUG,那就是难以保证划线的一致性。 在图表上有很多的高低点,到底该连接哪一个呢?不同的书上画趋势线的方
FREE

M & W Pattern Pro is an advanced scanner for M and W patters , it uses extra filters to ensure scanned patterns are profitable.
The indicator can be used with all symbols and time frames.
The indicator is a non repaint indicator with accurate statistics calculations.
To use , simply scan the most profitable pair using the statistics dashboard accuracy , then enter trades on signal arrow and exit at the TP and SL levels.
STATISTICS : Accuracy 1 : This is the percentage of the times price hit

Gann 9+ 指标简介 江恩矩阵图( Gann Squares ),又称江恩四方图,或甘氏矩阵,它是江恩理论中最简易明确的技术分析,也是江恩一直致力使用的推算工具,堪称是江恩一生的精华和精髓。Gann 9+指标是使用矩阵图找出股票或期货的未来高点或低点。
指标输入 1 基数和步数可以默认设置为1; 2 倍数为-1时自动获得倍数,当然也可以自行填写;(价格除以倍数就是起算值) 3 多与空表示从起算点往上或往下算目标价; 4 表示要不要显示基准线; 5 价格除以倍数是起算值,是否对起算值进行四舍五入; 6 表示要展示多少个目标价。
交易方法建议: 1、画出来的线会有明显的支撑和压力,甚至是反转;突破后加仓,到达后减仓; 2、配合其它头皮和振荡指标,成功率大大增加; 3、尽量当主/辅助指标使用,但不能只看一个指标。
特别说明:此指标针对对江恩理论有一定了解的人使用。

Of all the tasks that a trader faces when entering a market, the main task is to determine the direction of the trend. The Artificial Power indicator will help you with this task. Whatever goal the trader sets for himself, the tool to achieve it will be mainly trend indicators.
The Artificial Power indicator without delay and redrawing is used by traders in trend strategies in trading on financial markets (Forex, CFD, binary options). This indicator is designed to detect trends in price movem

This is a buyer and seller aggression indicator that analyzes the shape of each candle and project this data in a histogram form. There are 4 histograms in one. On the front we have two: Upper - Buyer force. Lower - Seller force. At the background we also have two histogram, both with same color. They measure the combined strenght of buyers and sellers. This histograms can be turned off in Input Parameters. It is also possible to have the real or tick volume to help on this force measurement. IN
FREE

Have you ever wondered which currency is the strongest at any particular time? Or which currency pair is trending the most. Well, the currency strength meter helps with just that. It compares USD , EUR , AUD , CHF , GBP , CAD and NZD depending on the timeline you have chosen in settings, and ranks them on the number of pips each has moved compared to the rest. N/B: All currency charts of the above pairs must have loaded. You can do this by highlighting all major and minor currencies in
FREE

Presentation
Another indicator that makes scalping on tick charts easier, it displays an Heiken Ashi graph in Ticks.
It allows to detect entry points and trend reversals. Recommended number of ticks in a candle : 5, 13 or 21.
Parameters Ticks in candle: Number of ticks in a candle (default 5), Displays Trend arrows : displays a trend arrow based on EMA8 and EMA20 crossing, Displays MM50, Displays MM100, Max Candle (CPU): number of candles max to manage, low value will save ressources of
FREE
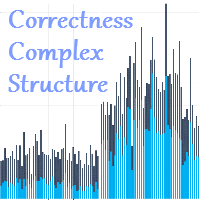
The Correctness Complex Structure indicator displays the complex structure of the bar, taking into account tick volumes in digital terms. How to interpret the information provided by the indicator. It's very simple, it's enough to analyze the chart. We will explain the work using an example, take the EURUSD instrument on the D1 timeframe, install this indicator and analyze the information provided by the indicator. The indicator works in the bottom of the chart and gives the result in the form
CalcFlat Creative is a flat indicator.
This is a more advanced version of the CalcFlat indicator. Three lines have been added for this indicator, which significantly improve the performance of the predecessor indicator. In addition to the two existing levels that the user reacted to and which were static, now the indicator has three dynamic lines on top of the main chart and interpreted as: signal line base, signal minimum, signal maximum.
These lines are formed due to the additional indica

STARGOGS PRICE ACTION EA ABOUT: This Robot is based on Price Action mostly Trendlines and Support & Restistance. The Robot Also uses 2 Strategies which you can choose from by choosing which one to use (True/False) Strategy 1: One Entry at a time with Fixed TP and SL. Strategy 2: Grid and Matingale. You can also use this EA as a Indicator by Turning Trading off also by using (True/False). You can aslo use Lot multiply on loss if you want or use fixed lotsize. MINIMUM BALANCE:
The Minimum Balan

Relative Volume or RVOL is an indicator that averages the volume of X amount of days, making it easy to compare sessions volumes.
The histogram only has 3 colors:
Green - Above average volume
Yellow - Average volume
Red - Below average volume
The default setting is 20 days, which corresponds more or less to a month of trading.
In this version is possible to choose between tick and real volumes (if you are using a broker which offers future contracts)
With the data obtaine
FREE

This indicator combines RSI(14) and ADX(14) to find out the signal that price moves strongly. When it appears signal (represent by the yellow dot), and price is going down, let consider to open a SELL order. Otherwise, let consider to open a BUY order. In this case, the strength of moving is strong (normally after sideway period), so we can set TP by 3 times of SL .
FREE

This indicator is very useful in observing the direction of the market. It allows users to enter multiple MA lines with specific display method. In addition, it is also possible to change the candle color same to color of the background of chart, so that we only focus on the MA lines. When a signal appears, represented by a red or green dot, we can consider opening a sell (red dot) or buy (green dot) order. Note: it need to set stoploss at the highest value of MA lines (with sell order) or lowe
FREE

BPS BoS - Break of Structure
BoS - Fractal mode , MTF
BoS - Zigzag mode , MTF
Show HH and LL
Alerts - Popup , Push notification and eMail Option to create screenshot on alert Enable / Disable Indicator with a button on chart to select options
Choose corner of button location
It is not a system but a indicator to help identify break of structure points
MT 4 Version : https://www.mql5.com/en/market/product/78420?source=Site+Profile+Seller Other Indicators : https://www.mql5.com/en/use
用于发送通知的自动化系统,这样您的订阅者就不会错过您交易终端上的交易事件。一种实用程序,可向 Telegram Messenger 发送有关您账户上任何交易操作的通知。 将实用程序连接到 Telegram -> HERE / MT4 -> HERE 中的频道的分步说明 优点: 简单的设置和详细的说明, 可以发送可调整的屏幕截图, 使用表情符号可定制的通知文本, 调整有关开仓、全部或部分平仓以及订单修改的通知, 默认发送通知时,会自动下载文本文件, 调整有关放置或删除挂单的通知, 通过符号和幻数方便地过滤。 输入变量: TELEGRAM BOT AND CHAT SETTINGS Telegram bot token - Enter the token number received after registering the bot in "BotFather" Telegram Chat ID - Enter the identification number received from "userinfobot"
SETTING TRIGGERS SETTINGS

趋势线是外汇交易中最重要的技术分析工具。不幸的是,大多数交易者没有正确绘制它们。自动趋势线指标是专业交易者的专业工具,可帮助您可视化市场的趋势运动。
有两种类型的趋势线看涨趋势线和看跌趋势线。
在上升趋势中,外汇趋势线是通过价格变动的最低摆动点绘制的。
连接至少两个“最低点”将创建一条趋势线。
在下跌趋势中,趋势线是通过价格走势的最高摆动点绘制的。
连接至少两个“最高点”将创建一条趋势线。
趋势线何时突破?
当看跌蜡烛收于看涨趋势线下方并且蜡烛的高点在趋势线上方时,看涨趋势线会被打破。
当看涨蜡烛收于看跌趋势线上方并且蜡烛的低点低于趋势线时,看跌趋势线会被打破。
趋势线何时删除?
当一根完整的蜡烛在看涨趋势线下方形成时,看涨趋势线将被删除。
当完整的蜡烛在看跌趋势线上方形成时,看跌趋势线将被删除。
您可以从输入参数更改看涨和看跌趋势线的颜色和宽度。

UR 趨勢疲憊
UR TrendExhaustion 是不想處理參數值或其他設置的交易者的最佳解決方案 - 它對每個人來說既簡單又直觀易懂。
使用 UR TrendExhaustion 的優勢:
無參數 您有 3 條線最能描述圖表上的情況:趨勢耗盡線、鯨魚資金線和零售資金線。 該界面展示了兩個極端(紅色區域)上任何一條線的耗盡 最大優勢:簡單且可適應所有資產。 有一個特殊的電報聊天,您可以在其中了解最新的工具更新,如果您覺得缺少什麼,也可以發送請求!
為什麼是 UR TrendExhaustion?
在我的整個職業生涯中,我一直在編寫多種指標,並達到了這樣一個地步,即我收集了我所有的知識來編寫這個簡單但最好的 (imo) 工具來進行交易,而不需要圖表上的任何其他工具。 易於理解,易於設置。 該策略的執行方式使做市商很難與它進行交易 - 將死 MM! 您與 UR TrendExhaustion 一起使用的任何其他工具都會增加您的交易,但我一直單獨使用它並取得了很好的效果。 祝你好運!
如何使用 UR TrendExhaustion ?
YT 上有一段

你的高點和低點
UR Highs&Lows 對價格變動及其波動性進行深入分析,並創建價格變動的通道。 該通道現在作為振盪器移動,並與價格偏差重疊,以表明潛在的耗盡和可能的逆轉。
使用 UR Highs&Lows 的優勢:
無參數 您有 3 條線描述價格變動 - 白線是價格的平均值,藍線是價格的極值 直方圖是價格背景下最大偏差的可視化 該界面展示了兩個極端(上部紅色區域和下部藍色區域)上任一條線的耗盡 最大優勢:簡單且可適應所有資產。 有一個特殊的電報聊天,您可以在其中了解最新的工具更新,如果您覺得缺少什麼,也可以發送請求!
為什麼是 UR 高點和低點?
該指標可用作獨立的進入或退出指標。 由於它對價格的依賴 - 它可以應用於每個圖表,其偏差計算算法基於多年的經驗和觀察。
如何使用 UR Highs&Lows ?
請參閱下面的描述以更熟悉它:
設置 沒有任何 展示
價格平均主線(白色):價格的平均值。 價格極值(藍色):價格極值的計算通道。 直方圖:顯示波動率的偏差。 極端區域:價格將耗盡並可能反轉的區域。
添加
我所有的工具
Impulse Creative is a more advanced indicator of impulses for making decisions (compared to the Impulse Change indicator). The main task of this indicator is to warn the trader about the moment of price changes and also to give a command to enter according to the current trend. To determine the trend, use any other tool, this development forms only an entry point but not the entry direction.
First, look at the screenshots and notice that we see clearly expressed figures that the indicator for

Shift Trend is an indicator of the formation of entry signals, entry points. The indicator must be selected to work for a sufficiently short period of time. But who works in short ranges, then this indicator is well suited.
Options: Length1 - The first parameter. Length2 - Second parameter; PointActivity - Parameter controlling peak levels. PointMinDist - The parameter that sets the minimum distance. AvgLengthBar - Bar averaging.
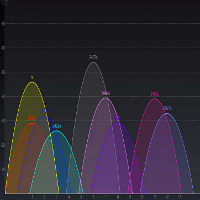
Change Analyzer - The indicator can be called an indicator of market balance. Since the indicator is on the zero line, then the market is balanced in a certain timeframe and a certain instrument.
Based on two virtual windows and their mutual placement, this graph is built. As a result of its work, the price chart normalizes relative to the zero line, which helps to draw conclusions about the price behavior. The indicator is somewhat reminiscent of the overbought and oversold system, but the a
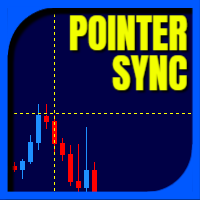
Pointer Sync is a pointer synchronizer between open charts. It makes the MT5 cross (activated by the middle mouse button) to be replicated on all open charts. In addition, it is possible to create horizontal lines (letter H) and vertical lines (letter V), very useful for studying. The appearance of the lines is customizable. Note: Synchronization is through the X and Y scale in pixels , not price and/or date. It is a simple and free utility. Enjoy!
This is a free indicator, but it took hours t
FREE
TDO is a free utility for optimizing the Trading Direction indicator. In addition to signals for trading, the indicator also has an information vector that fully provides all the statistical information on the operation of the indicator; this effect can be used to ensure that the indicator is automatically optimized. You just need to select the instrument and timeframe and specify the hourly interval in the utility settings and drop it on the chart chart. That's all, now we are waiting for the
FREE

Identification of support and resistance areas
A useful indicator for traders
completely free
Can be used in all symbols
Can be used in all time frames
It has three different trends: short term, medium term, long term
Settings:
Clr1,2: You can change the color of the lines
Type Trend: You can determine the trend
Message me for questions, criticism and suggestions
FREE

Overlay indicator on chart between 2 pairs
The Timeframe Overlay indicator displays the price action of timeframes on a single chart, allowing you to quickly assess different timeframes from a single chart. The advantage is to observe and follow the correlations of price movements in real time to help you find potential trades at a glance.
---- Symbol 1 ----
Symbol = EURUSD
Correlation Inverse = false
Display = true
Ratio
FREE
The new Royal Prince Master Non-Repaint Indicator MT5 has two control points ? What does this mean it allows you to use two different indicators to cross to see to find your signals, those two indicators also can be customized just like if you were to load them individually on a chart.
Want to see the indicator in action check the youtube video.
ALSO IT HAS ALERTS !!!!!
List of Different indicators to choose from :
1) Moving Average 2) Moving Average Convergence/Divergence 3) O

Ilan is a well known algorithmic trading system with its advantages and inconveniences. He is reputed to have good results when the prices are in a range but also to blow up the accounts in the case of strong trend. From a basic Ilan system, I added a trend filter to detect range periods, so that it trades only during these periods. I have also added a feature allowing it to adapt to economic news, it will not trade from one to several hours before and after a news depending on its importance. O

The result is visible in the first hours of operation!
The bot opens a grid of orders with a minimum lot. And it fixes a small profit, but it does it very often. Thus, the profitable zones
are always close to the current price.The Expert Advisor has a trading panel. With it, you can open positions that will be picked up by the Expert Advisor and taken into account in trading. The built-in switchable filter ensures trading in the direction of the trend.
Use a $ 1,000 depo

This indicator provides several drawing tools to assist in various methods of chart analysis.
The drawings will keep their proportions (according to their handle trendline) across different chart scales, update in real time, and multiple drawings are supported.
#
Drawing Option
Description
1 Grid box draggable boxed grid, user defines rows x colums, diagonal ray option 2 Grid partial or fullscreen grid, sized by handle line 3 Grid flex a diagonal grid, sized and sloped by handle line

Are You Better than Monkey? Prove it...
The trade of this EA is based on random output with customizable lot size (use martingale or not), stop-loss, and take-profit levels. Easy to use and Simple Great for benchmarking tests against other EAs or manual trade. Works for ECN/Non-ECN brokers and 2-3-4-5 digit symbols Support us by open My recommended broker. Exness Tickmill robot monkey uses Adx trend filter for fair game no-trade unfavorable market ( you can turn off set adx = 0) . EA starts
FREE

T5L Library is necessary to use the EAs from TSU Investimentos, IAtrader and others. It contains all the functions framework needed to Expert Advisors working properly. ツ
- The Expert Advisors from TSU Investimentos does not work without this library, the T5L library can have updates during the year - At this Library you will find several funcionalities like order sends, buy and sell, trigger entry points check, candlestick analyses, supply and demmand marking and lines, and much more.

--- Last 5 copies left free. Next there will be a price 30$ ---
DRAGON SWING EA (for EUR/USD 20 minutes) NO MARTINGALES NO CUMULATE ORDERS NO PARTIAL CLOSURES OR HEDGING NO CONFUSIONAL PARAMETERS, MULTI-CHARTS OR MULTI TIMEFRAME NOT OVER-FIT OR COMPLICATED AND RISKY STATEGIES THAT CRASH AFTER FEW DAYS
This is a healty, simple, durable and solid Expert Advisor. Suitable and simple to use also for beginners with little capital.
DESCRIPTION: The strategy of this expert advisor is to operat

It is an Expert Advisor who uses the famous Dave Landry strategy, widely used to operate swing trades in various types of markets, Forex, B3, indices, stocks and cryptocurrencies.
The Dave Landry Setup is one of the most well-known setups that operate in favor of the trend, there is a preference for the larger H4, Daily, Weekly and Monthly timeframes, due to its high hit rate, but the TsuTrader Dave Landry robot allows complete customization of the strategy .
- TSUTrader Dave Landry is the

--- ! Last 8 copies left free. Next there will be a price $30 ! --- DRAGON RALLY SNIPER EA (USD/JPY 5min) NO MARTINGALES NO CUMULATE ORDERS NO PARTIAL CLOSURES OR HEDGING NO CONFUSIONAL PARAMETERS, MULTI-CHARTS OR MULTI TIMEFRAME NOT OVER-FIT OR COMPLICATED AND RISKY STATEGIES THAT CRASH AFTER FEW DAYS DESCRIPTION: The idea behind this system is very simple: identifies break-outs in price levels and starts trade on the pull-backs . It works perfectly on the USD/JPY cross with a 5-minute tim

This indicator provides common shapes as drawing object options. The shapes are rotatable, resizable, draggable, and will keep their proportions (according to their handle trendline) across different chart scales. Multiple drawings are supported.
Shapes: Square Rhombus
Triangle (quadrilateral & isosceles) Circle (grid, overlapped grid, flexi grid, rotatable grid, concentric circles) Features: rays (all object edges will be rays) show/hide each individual drawing type, or all delete last drawn
FREE
This EA trails your stops based on percentage of current TP, for both manually and auto-opened trades. You can edit the percentage value in the inputs. Trailing stop is a more flexible variation of a normal exit order. T railing stop is the practice of moving the stop-loss level closer to the current price when the price moves in your favor. Trailing the stop-loss allows traders to limit their losses and safeguard their positive trades. It is a very popular practice. This EA will manage you
MetaTrader市场提供了一个方便,安全的购买MetaTrader平台应用程序的场所。直接从您的程序端免费下载EA交易和指标的试用版在测试策略中进行测试。
在不同模式下测试应用程序来监视性能和为您想要使用MQL5.community支付系统的产品进行付款。
您错过了交易机会:
- 免费交易应用程序
- 8,000+信号可供复制
- 探索金融市场的经济新闻
注册
登录