适用于MetaTrader 5的新EA交易和指标 - 61

The Average Daily Range (ADR) is an indicator that shows how far a currency pair can move in a day. Automatically displays the upper and lower ADR levels. Automatically calculates the percentage and distance of ADR achieved by the currency pair for the day. Notifies when the price reaches the ADR level. Changes the color and thickness of the ADR line when the price reaches it.

Optimize EA before test and buying. Euro King is for trading EUR/USD on 15 min time frames. Optimize to find the best stop loss and take profit for your risk management. This EA does not trade hundreds of times a day. In the test it traded 100 times in a year. Try other time frames to see if there optimizations for different results. The EA uses Bollinger bands, moving averages and RSI for logic in the entry and exits. Martingales are not used and all trades have a stop loss and a take pr

A version based on David Waves' description in his book 'Trade About to Happen' of his adaptation of the Wyckoff wave chart. The indicator directionally accumulates volume, adding to each brick or candle close, with color indication for up and down. it can be used it with tick or real volume, it also changes color when the accumulated value of the previous wave is exceeded, being the trade signal. Yellow color is used for doji candlestick, it will continue with accumulation without zero the sum

EA " Swing trade by porl " can use for EURUSD XAUUSD GBPUSD time frame H1 for good. The default settings can be used for saving ports EURUSD. but the minimum profit If you want high profit You can set the inputs you want. only that the value that is put into the supplied, if managing money in the port To fit, there will be a relatively stable profit. If adjusting the higher lot, the risk will be higher as well, but the profit will come according to the risk we invest. We recommend that every

Optimize before use in back test or live for better results for you and don't forget to account for spreads and slippage in optimization. This Expert is for 1 minute charts trading BTC/USD. Bitcoin on 1 minute use MACD, CCI and RSI for entry and exit logic. This EA was back tested and traded out of sample. Each trade has a stop loss and take profit. BTC compared to the indexes and Gold have huge differences, look at the example of traditional investing vs. Bitcoin. Yellow line represents

MA Slope is a simple indicator that measures the slope of a specific Moving Average. We usually say that the price is in an uptrend when it is above the moving average, or it is in a downtrend when it is below the moving average. However, this information is inadequate since most of the time the market is in range. During range-bound markets, price moves back and forth around the Moving Average giving a lot of false signals. MA Slope helps identify and validate trends as it directly measures t

This is a regression tree indicator for MT4/MT5.
This indicator classificate nodes on the time period so that the deviation becomes smaller,
and displays regression line and channel for each node.
It's free!
Attached CartDemo.ex4 and CartDemo.ex5 is a Demo version and has the following limitations:
Method is RandomForest only
Maximum number of bars is 200
Maximum number of trees is 2
Maximum tree depth is 2
Calculated waste lines are shown
Not display correlation coefficients
Fu
FREE

Double Correlation indicator (free) plots two windowed correlations in a separate window. the size of window is taken as input before the two symbols to correlate to. Two symbols are taken as an input parameters as well as period length. and the two correlations are computed with the currently shown symbol ex: input GBPJPY and AUDNZD. current symbol EURUSD then the following will be computed corr(EURUSD,GBPJPY) and corr(EURUSD,AUDNZD) The indicator can be useful to run a multi-symbol pair trad
FREE

This information indicator will be useful for those who always want to be aware of the current situation on the account.
- More useful indicators
The indicator displays data such as profit in points, percentage and currency, as well as the spread for the current pair and the time until the bar closes on the current timeframe. There are several options for placing the information line on the chart: - To the right of the price (runs behind the price); - As a comment (in the upper left corner
FREE
逐步“追踪止損”
該實用程序允許您設置在使用“追踪止損”工具時跟隨價格移動“止損”的步驟。 與“MetaTrader”終端中可用的“常規”“Trailing Stop”不同,它允許您以 1 點為增量設置“Stop Loss”移動,此“Trailing Stop”配置為任意增量。 此設置可讓您避免在錯誤的趨勢反轉期間平倉,此時價格在一個方向的長期移動之後出現小幅回調,然後再次繼續向同一方向移動。 為了方便管理具有可變“止損”移動步驟的“Trailing Stop”工具的工作,開發人員 Dmitry Fedoseev 已將實現該工具操作的腳本改編為現有的交易面板“eInTradePane”。 交易面板的源代碼可在 https://www.mql5.com/en/code/220 免費獲得。 添加了“Trailing Stop”的“eInTradePanel”交易面板的描述在“ 討論 ”選項卡上給出。
FREE
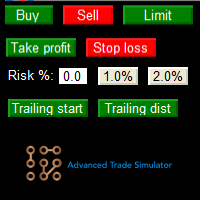
Advanced Trade Simulator for MT5
It is an indicator you can attach to any chart and then buy and sell the given symbol virtually. No actual trading takes place. You can attach it to multiple charts. Then you can buy multiple symbols.
A more detailed description here: https://www.mql5.com/en/blogs/post/750336 Features:
- buy and sell immediately on the given time frame - market , limit and stop orders - generalized OCO, more than 2 orders can cancel each other. - OSO, one sends another..

# 33% off - limited time only # ChartSync Pro MT5 is an indicator, designed for the MetaTrader 5 trading terminals. It enables the trader to perform better multi-timeframe technical analysis, by synchronizing symbols and objects into virtually unlimited charts. Built by traders for traders! Telegram Premium Support - Dd you purchase the Chart Sync indicator and need a bit of help? Send us a screenshot with your purchase and your Telegram ID so we can add you to our premium support Telegram g

Contact me after payment to send you the User-Manual PDF File. Volume Profile Indicator A functional and useful tool that can improve your trading plan.
This indicator calculates volume in price levels(typical volume indicator shows only candle volumes).
With the volume of price levels, you can identify important areas that have the potential to reverse. You can also see the volume of support and resistance levels and decide on them.
Using volume profiles along with Price Action and

Colors generated according to trading volume and market direction.
The analysis is carried out following the direction of the price and volume traded if the traded value exceeds the calculation base the system changes the color to green, informing you that the price direction is strong to buy, if the traded value is less than the calculation base the system changes to red, indicating that the price is strong for sale.
FREE

It is an indicator used to identify support and resistance points from the daily VWAP and you can use it to check the best entry and exit points.
The calculated value of the channel distance can be calculated in several ways:
- Manual Defining the value to be projected to calculate the distance of the channels.
- Automatic Select the timeframe to be used. Regardless of the graphic time that is on the screen, if the parameter is changed to H1(One hour candles), the system will c

TRAILINATOR is a unique Solution to use different Trailing-Stop Variants and change your Tradesetup via Remotecontrol. You configure your Tradesetup for a specified Symbol only once. This setting will be used for all your Positions of the same Symbol. Currently we support these Features: different Trailing-Stops: Standard: works like you use in Metatrader Terminal, starts trailing if your profit is greater than trailing stop Start after points: trailing stop will start after your defined poin

Do not buy before seeing the Danko Trend Color product, as this panel is a way to view a summary of this indicator on various timeframes.
The Danko DTC Panel utility allows you to look at the trend in up to 5 timeframes. When clicking on the timeframe texts, a new window will open with the indicator plotted on the screen so you can see the complete chart. The width of the panel, with the amount of candles you want to see, is customizable, see the images below.
Ao clicar nos textos dos timefra

The Danko Trend Color indicator is actually a candle coloring to bring practicality, ease and information to your charts.
Danko Trend Color combines PRICE AND VOLUME indicators to define the prevailing trend, so the colors are: Blue (indicates an uptrend)
Orange (indicates a downtrend)
White (indicates undefined trend)
I don't like to promise anything with my indicators, I ask you to download, test it for free (for use in backtesting) and see if the indicator can, in some way, help you

TRAILINATOR is a unique Solution to use different Trailing-Stop Variants and change your settings via Remotecontrol. You configure your Trailing-Stop for a specified Symbol only once. This setting will be used for all your Positions of the same Symbol. Currently we support these different Trailing-Stops: Standard : works like you use in Metatrader Terminal, starts trailing if your profit is greater than trailing stop Start after points : trailing stop will start after your defined points in p
FREE

Write this EA for my own use. but decided to sell it as well . The EA has a wide variety of uses. Can be set as you wish. But please understand that profits depend on the capabilities of EA users. Not just the EA alone. I try to reduce the difficulty of use. Make EA easier to use and more friendly to investors. I want everyone to try the demo before actually buying it. To make sure this EA is right for you or not. ... About setting up my EA click that youtube link.

Theory VWAP is a volume-weighted moving average, bringing greater relevance to prices. The VWAP base calculation follows the classic formula described in Investopedia ( https://www.investopedia.com/terms/v/vwap.asp ). VWAP = sum(typical price[i]*volume[i]) / sum(volume[i])
Functionalities
Orion Intraday VWAP innovates by allowing the user to choose between the conventional Daily, Weekly and Monthly periods, also having the option of calculating the Intraday indicator, as used in other platfo

Strangely enough, everyone seems to have their own idea of how you should measure support and resistance. Not every support and resistance zone is strong. The strongest support or resistance levels will more often than not be with trend . What this means is, if we are in a bull trend, pullback levels to support will more often than not be ‘stronger‘ than resistance levels above. These expert advisors use several mathematical models and statistical models to determine the strongest support and r

Hello;
This product generates buy and sell signals from the intersection of two moving averages. It uses all the capabilities of the moving averages. To generate a scalping strategy, a take profit level is determined after the signal level. To stop the loss, it uses the reverse signal. The system can increase the lot amount according to the fibonacci ratios after each loss .To disable this margintale feature, you will need to enter the low lot and high lot amounts the same. So you can work wi

- 50% off - Telegram group : https://t.me/+5RIceImV_OJmNDA0 MT4 version : https://www.mql5.com/en/market/product/84526?source=Unknown%3Ahttps%3A%2F%2Fwww.mql5.com%2Fen%2Fmarket%2Fmy
Master Pullback is a complete system that gives unique trading opportunities and a clear indication of the market: trend, signals as well as stop loss and take profit levels. This system has been designed to be as simple as possible and detects extreme overbought and oversold zones, support and resistance levels, a
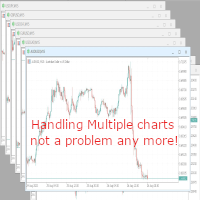
With this script you can open or close multiple charts with just one click. Please follow the instructions below; Set your desired symbols in the market watch window. Open one chart. Attach the script to the chart In the input values just select the time frame of your chart. Set open chart value to true. Click ok. To close the charts follow step 3 and 7. In input values set open chart value to false and close chart value to true

The indicator will plot a line on the chart that corresponds to the closing price of the previous day, and based on this, it will plot the percentage levels of change in the price of the asset in question. It can be used on any asset. Period: Determine whether the closing price should be daily, weekly or monthly Minimum percentage: Determine the percentage for the indicator to plot the levels and sub-levels on the chart, eg 0.5 it will plot on the chart a line for every 0.5% variation and the su

V Band is a technical analysis tool that helps smooth out price action by filtering out the “noise” from random price fluctuations. It is calculated by taking the average of a market’s price over a set period of time.
It can be applied to stocks equity indices, commodities and Forex . V Bands is used to identify trends or support and resistance levels.
They can also be used to generate buy and sell signals.
Choose a trading style and start trading!

Fundamentação teórica A VWAP é uma média móvel ajustada pelo volume, ou seja, o peso de cada preço corresponde ao volume de ações negociadas no período, dando mais importância ao período em que se tenha mais negociações. A Orion Vwap Bands permite que o usuário use plote 8 bandas que podem ser utilizadas como suportes e resistências para o preço. Cada banda é calculada a partir da Vwap Tradicional:
Ex.: Se escolhermos o valor 0.25 para a plotagem da Banda 1, pega-se o preço da Vwap e acrescen

Boom and Crash Buy and Sell Trend. Non-repaint. Can be used on all timeframes 1 minute for scalpers. 5 minute to monthly timeframe for swing trading. works on all boom and crash pairs Crash300, Crash500, Crash1000. Boom300, Boom500, Boom1000. Green histogram colour means the trend is up(bullish) Buy signal. Dark orange histogram colour means the trend is down(bearish) Sell signal.

OPTMIZE EA BEFORE BACKTEST AND USE. United States Stock Market Index US500 trades the 5 minute charts. The EA uses RSI and Stochastics for entries and ATR for exits. The building period was From 2021-03-19 to 2022-08-18. Continually optimize the EA to find best settings and don't forget to account for spreads and slippage in optimization . The EA does not use martingale and has a sl and tp on each trade with a fixed lot input. Try it out in the back test, optimize for settings.
Risk Di
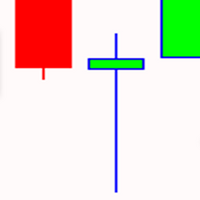
OPTMIZE EA BEFORE BACKTEST AND USE. Gold Pin Bar trade XAU/USD on 1HR charts using moving averages and pin bars. Pin bars are used to pick higher probable trades that can occur. The price is pushed up or down forming the pin bar signaling who has control over the price. Optimize for the best settings for stop loss and take profits and don't forget to account for spreads and slippage in optimization. . All order have money management and the EA doesn't use dangerous trading strategies. Rest as

Turn Stock Manager into Your New Business Opportunity – You can sell Stock Manager to your customers as a service by selling License. – The Licenses is managed in a Web Admin dashboard. – Highly flexibility structure that allows customers to host their database in Cloud or Self-hosted. – Admin/Staffs can create unlimited number of license for selling. please test me now
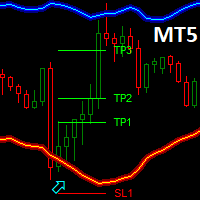
Dark Bands is an Indicator for intraday trading. This Indicator is based on Counter Trend strategy but use also Volatility. We can enter in good price with this Indicator, in order to follow the inversions on the current instrument.
Key benefits
Easily visible take profit/stop loss lines Reliable bands lines with futuristic colors, and Intuitive directional arrows Useful statistics , which indicate the win rate of the signals Plus Package available, leave a feedback to receive it for
FREE

This Expert advisor trades any Asset class, Try it on any market, When you download PM so you can be added to my channel for all support related issues. There are three trading strategies available * The Wyckoff trading strategy, Channel trading and trend trading. Input Parameters Lots - the volume of position to open; Stop Loss BUY (in points) - the stop loss of BUY positions; Stop Loss SELL (in points) - the stop loss of SELL positions; Take Profit BUY (in points) - the take profit o
FREE
Telegram Utility EA 链接到任何私人/公共机器人,可以帮助您: 通过命令立即关闭所有订单。 该命令使用您的自定义密码进行编码,只有您知道。 Telegram 机器人会告诉您所有订单何时关闭,甚至暂停您的 MT5 终端中所有其他正在运行的 EA。 只需单击一下即可暂停/恢复在终端中运行的任何其他 EA! 以点数形式或货币形式出口贸易报告。 向机器人或您的社区(电报聊天组、电报频道)发送买入/卖出信号。 您可以手动选择要发送的交易类型。 通过屏幕截图发送信号。 图表屏幕截图也可以手动选择。 在您发出命令时在您选择的任何图表上发送屏幕截图。 所有参数都易于理解和修改。
您可以留言寻求进一步支持 如何将买入卖出信号 mt5 发送到您的电报 如何在 mt5 上暂停停止其他 EA

DESCRIPTION The EasyFollowerTrader Bot1 DayTrade indicator operates only in favor of the majority trend. Thus, the indicator, at first, observe the trend of the daily chart to operate in its favor. Then the indicator watch the current chart trend. When these two charts are moving in the same direction, we have the highest probability of winnings. We will call this region the region of high probability of gain. In the region of high probability of gain, the indicator will indicate the best ent

A simple utility to copy trade volumes from one MT5 or MT4 account to another MT5 account. You can copy positions between Netting and Hedging accounts in any combination. By default, positions opened by all matching symbols with the same volumes will be copied. If the symbol names are different or the volume of copied positions should be different or not all positions should be copied, then the desired behavior can be specified in the settings described in this post . This product will expand
FREE
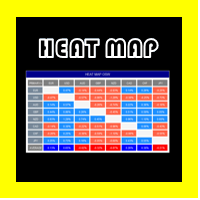
主图 OSW
该指标非常适合了解所有货币组合的当前状态并了解它们的变化。
变化是通过从当前价格到 24 小时前的价格变动百分比或菜单中配置的任何值来计算的。
要了解货币的变化,您只需查看主要货币,例如:
在欧元中,您必须垂直查看以与其他货币进行比较,最后,您会找到所有这些变化值的平均值。
当经纪人将它们放在符号或货币对上时使用前缀和后缀(例如:EURUSD.pro)后缀将是 .pro 主图 OSW
该指标非常适合了解所有货币组合的当前状态并了解它们的变化。
变化是通过从当前价格到 24 小时前的价格变动百分比或菜单中配置的任何值来计算的。
要了解货币的变化,您只需查看主要货币,例如:
在欧元中,您必须垂直查看以与其他货币进行比较,最后,您会找到所有这些变化值的平均值。
当经纪人将它们放在符号或货币对上时使用前缀和后缀(例如:EURUSD.pro)后缀将是 .pro

ESS 启发战略信号
该指标检测应用了过滤器的信封型蜡烛,该过滤器由 3 种策略共同组成,可以在可测量的参数内确定最大可能的有效性。
信号由每个方向的向上和向下箭头指示,您还可以激活或停用警报、电子邮件和将消息推送到手机。
值得一提的是,没有一个指标是100%有效的,所以应该配合技术分析或者其他指标的帮助来提高自己策略的有效性。 ESS 启发战略信号
该指标检测应用了过滤器的信封型蜡烛,该过滤器由 3 种策略共同组成,可以在可测量的参数内确定最大可能的有效性。
信号由每个方向的向上和向下箭头指示,您还可以激活或停用警报、电子邮件和将消息推送到手机。
值得一提的是,没有一个指标是100%有效的,所以应该配合技术分析或者其他指标的帮助来提高自己策略的有效性。

用於自動訂單和風險管理的實用程序。讓您從利潤中獲得最大收益並限制您的損失。由執業交易員為交易員創建。該實用程序易於使用,適用於交易者手動打開的任何市場訂單或在顧問的幫助下。可以按幻數過濾交易。該實用程序可以同時處理任意數量的訂單。
具有以下功能:
1. 設置止損和止盈水平;
2. 通過追踪止損位平倉;
3. 設定盈虧平衡水平。
該實用程序可以:
1. 分別處理每個訂單(為每個訂單單獨設置級別)
2. 處理一籃子單向訂單(所有訂單的水平設置相同,買入和賣出分開)
3. 處理一籃子多向訂單(所有訂單的級別都設置為通用的,BUY 和 SELL 一起)
選項:
STOPLOSS - 如果不使用 =-1,則以點為單位止損; TAKEPROFIT - 以點為單位獲利,不與 -1 一起使用;
TRAILING_STOP - 價格變動的點數,如果不使用 =-1; TRAILING_STEP - 每一步利潤將增加的點數;
BREAKEVEN_STOP - 將訂單轉移到盈虧平衡點的點數,如果不使用 =-1; BREAKEVEN_ST

** All Symbols x All Time frames scan just by pressing scanner button ** *** Contact me after the purchase to send you instructions and add you in "Harmonic Scanner group" for sharing or seeing experiences with other users. Introduction Harmonic Patterns are best used to predict turning point. Harmonic Patterns give you high win rate and high opportunities for trade in during one day. This indicator detects the best and successful patterns based on Harmonic Trading concepts . The Harmonic Patt

This indicators automatically draws the support and resistances levels (key levels) for you once you've dropped it on a chart. It reduces the hustle of drawing and redrawing these levels every time you analyse prices on a chart. With it, all you have to do is drop it on a chart, adjust the settings to your liking and let the indicator do the rest.
But wait, it gets better; the indicator is absolutely free! For more information: https://youtu.be/rTxbPOBu3nY For more free stuff visit: https
FREE

The Active Trend indicator helps to analyze the market on the selected time interval. It defines the mainstream. Used in trading. You can use so basic to determine the trend. The indicator works well on both short and longer trend sections. In flat it is recommended to use filters of your choice. It can accompany the position with a stop, it is recommended to set the stop at a fixed distance from the point formed by the indicator. The simplest way to use the indicator is to open a trade in the

An arrow technical indicator without redrawing Signal Breakthrough in the Forex market is able to give tips with the least errors.
Every rise and fall is reflected in your emotional state: hope is replaced by fear, and when it passes, hope appears again. The market uses your fear to prevent you from taking advantage of a strong position. At such moments you are most vulnerable. Currency pairs never rise or fall in a straight line. Their ups and downs are interspersed with rollbacks and revers
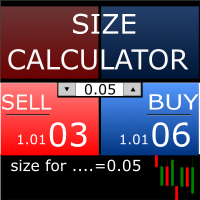
Size Calculator allow you to calculate the size you need for your position giving two parametres: the number of pips risked and the money risked, for example if you want to risk 20 USD on 200 pips, then you will need to input 200 in the case reserved for pips and 20 in the case reserved for risk, the size will appear in left top carner of the chart in your metatrader 4 platform, Size Calculator support the following symbols : EURUSD GBPUSD AUDUSD NZDUSD GOLD WTI EURJPY GBPJPY USDJPY AUDJP

It makes it easier to see where there have been consolidation zones for previous prices and allows you to highlight the histogram where there is the biggest consolidation zone.
Input parameters Intervalo de preço Is the price between the histograms
Periodo Number of candle sticks to be analyzed
Porcentagem Highlights the histogram where there is minimal consolidation in relation to the analyzed period
FREE

The fractal indicator shows the latest support and resistance levels. If the price breaks through the level and is fixed, the indicator draws a rhombus of yellow or crimson color signaling a possible continuation of the movement towards the breakdown.
Indicator Settings:
- BarCount: sets the minimum number of bars required to build a fractal.
It is better to use the indicator in conjunction with other indicators.
FREE

PRESENTATION
This EA uses several non-directional strategies that allows it to generate profits regardless of price trends. It manages a pool of positions ("session") in a totally autonomous way To avoid risks related to this strategy, several recovery functions have been implemented. This makes it a reliable and secure EA, its DD remains low.
RECOVERY MODE This EA is designed to run on several pairs simultaneously on an account. When the DD of a session exceeds a defined value, all positions

The indicator calculates the correlation coefficient of 2 instruments, shifts the chart of the 2nd instrument relative to the 1st and displays the charts of both instruments on the current chart. The maximum positive and negative deltas and the current delta as a percentage of the maximum are calculated. It is possible for signals to set a delta for entry and exit with displaying the direction of entry into trade for each instrument. The space between the charts is also filled with different col

The indicator calculates intraday levels based on the average daily price range, builds support and resistance levels that may be reversal.
Parameters Period ATR - period of the ATR indicator Shift time - time offset for the opening of the day Color opening of day - color of the opening line of the day Color 1AR, -1AS - line color 1AR, -1AS Color AR 1/2, AS -1/2 - line color AR 1/2, AS Color AR 1/4, AS -1/4 - line color AR 1/4, AS -1/4 Color AR 3/4, AS -3/4 - line color AR 3/4, AS -3/4 Colo

'Fibonacci Dimension' indicator allows display of preset or user-defined multi-timeframe Fibonacci levels. It automatically takes the previous high and low for two user-defined timeframes and calculates their Fibonacci retracement levels. It also considers the retraced level to draw the expansions on every change of price. A complete visual dimension in multiple timeframes allows deriving profitable strategies for execution. The functionalities included are: Provides an option to consider a pres
FREE

Welcome to Investment Castle products This product is exclusively available in the MQL5 market and is not available and will not be available anywehere else. The Combined indicator is a multi-time frame indicator and it is built using 3 indicators: Bands indicator which draws the support and resistance key levels using up to 5 different time frames Patterns indicator which draws the chart patterns using up to 6 different time frames Spots indicator which shows the common candlestick patterns Yo

https://www.youtube.com/watch?v=0T8Mge39Xsk&t=9s
Youtube
These EAs trade macd divergence only if there is a parabolic sar change at the same time. Sell bearish macd divergence & parabolic sar crosses above price Macd settings Threshhold is how far above / below zero divergence must occur. Timeframe used Parabolic sar settings
Only one trade in that direction can be opened at once. Trades on open bar Alerts , mt5 and mobile Stop loss and target points Stop loss is set to a % percentage of
FREE
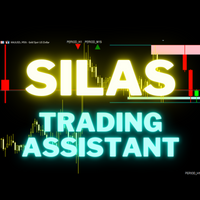
Silas is a trading assistant for multi-timeframes traders. It show on the screen, in a very clear way, all the informations needed to suits to your trading. It show : - Supply and demand zone from 2 timeframes of your choice - Setups based of market structure from 2 timeframes of your choice - Daily current high and low points - The last 2 closed candles and the current candle from an higher time frame on the right of the graph. - Actual daily candle on the left Everything is customisable !

** All Symbols x All Time frames scan just by pressing scanner button ** *** Contact me after purchase to send you instructions and add you in "Divergence group" for sharing or seeing experiences with other users. Introduction MACD divergence is a main technique used to determine trend reversing when it’s time to sell or buy because prices are likely to drop or pick in the charts. The MACD Divergence indicator can help you locate the top and bottom of the market. This indicator finds Regular div
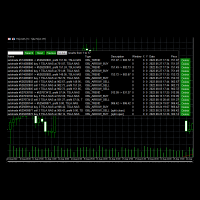
Use this software to browse through all objects within the chart and look at them comfortably. Also, you can look at the list of global variables and search and delete them . The same you can do with charts and indicators. You can search in objects names and object descriptions to find the object you are interested in. This is definitely an improvement to what is available in Mt5. You type what you are interested in , then press Search button. You can move to next and previous search results. N
FREE

How it works? This EA trades with Stochastic Signal line Cross over low and high levels. Only allows one open trade at a time on the currency you have attached this EA. if Reverse Logic is FALSE will open BUY if Stocha Signal Line Cross below Low Level will open SELL if Stocha Signal Line Cross Above High Level if Reverse Logic is TRUE will open SELL if Stocha Signal Line Cross below Low Level will open BUY if Stocha Signal Line Cross Above High Level Key difference with my other EA " Maste

Индикатор iVeles_Perfect_Oscilator является опережающим и одним из самых лучших осциляторов на сегодняшний день, использует специализированный расчет текущих цен графика. Очень качественно и своевременно показывает смену направления, очень точный подход к уровням перекупленности и перепроданности, что позволяет своевременно принять решение по сделке. Работает качественно на любом ТФ и с любым инструментом. Параметры: Period - период расчетов Average - усреднение МА Method - применяемый мето

В основу алгоритма этого трендового индикатора положен анализ веера сигнальных линий универсального мувинга I . Алгоритм вычисления сигнальных линий выглядит следующим образом. В качестве исходных данных имеем входные параметры индикатора: StartLength - минимальное стартовое значение первой сигнальной линии; Step - шаг изменения периода; StepsTotal - количество изменений периода. Любое значение периода из множества сигнальных линий вычисляется по формуле арифметической прогрессии: SignalPeriod(

Top indicator for MT5 providing accurate signals to enter Trades.
This Indicator will provide pretty accurate trading signals and tell you when it's best to open a trade by giving alerts to buy or sell. Mainly was created to target Volatility Index on Deriv broker however, the Spot Detector Arrow Indicator can be applied to any financial assets(Forex, Crypto, Indices, Volatilities) on MT5 Brokers.
HOW TO BUY Wait for signal Alert to Buy will be sent to your MT5 Terminal Blue arrow facin

Inventory Retracement Trade it is designed based on one of the most popular tradingview indicator. This is mostly combined with other popurlar trend indicator to confirm the strength of the movement. Definition Inventory Retracement Trade is quickly becoming one of the most popular ways to identify where short-term counter trend institutional inventory has subsided and when it’s time to re-enter into a trade’s original trend direction.

Angle of Moving Averages This indicator is very simple yet powerful concept which constantly calculate the slope of the current bar moving average with respect to the N bar before moving average value. This no only give a good entry and exit signal but also it shows traders the strength of the signal. It shows positive green histogram when market is moving toward upward direction and red histograms for downtrend. When large histograms found means market has very strong trend. Inputs Available
This EA utility does not trade on its own, but it only modifies the open trades to add take profit and stop loss that was opened manually or by any other expert advisors.
The distance is based on Average True Range Indicator(ATR).
How Does It Work?
If Symbol to modify is set to "All Symbol" simply attach it to one chart, and all open trades in the entire terminal will set the take profit and stop loss with the distance of Average True Range value of their corresponding symbol.
If

Waterstrider Cash Register
A High Risk trade with Martingale grid
The trend is based on the h1 chart, and scalping in m1-m15 chart.
Pair EURJPY, USDJPY, AUDUSD
8 position will open if against the position, and when the 8 position reach, a hedge position will open to increase the equity balance with small tp and re entry every 10% DD. after that the ea will calculate the open position and the hedge position and will close all in profits. No guarante for profit, you can try this with you

https://www.youtube.com/watch?v=0T8Mge39Xsk&t=9s
Youtube Sell only EA here.
These EAs trade macd divergence only if there is a parabolic sar change at the same time.
Buy bullish macd divergence & parabolic sar crosses below price Macd settings Threshhold is how far above / below zero divergence must occur. Timeframe used Parabolic sar settings
Only one trade in that direction can be opened at once. Trades on open bar Alerts , mt5 and mobile Stop loss and target points Stop loss is set

Wink IND is an indicator that tell you: -when MACD is saying buy or sell -when RSI is saying buy or sell -work on multi timeframes MT4 Version
by Wink IND: you don't need to have Knowledge about MACD or RSI don't need to check and compare MACD and RSI respectly don't need to check all of timeframes and compare the resaults don't lose time, save more time for your decisions in trading
Wink IND: multi timeframe indicator multi currency indicator show the positions by graphic shapes, arrows an

OPTIMIZE EA BEFORE TEST AND USE. Bitcoin M5 is for trading BTC/USD on 5 min charts. SL and TP should Start with 50000. OPTIMIZE BEFORE USE The trading strategy uses Bollinger Bands and Envelopes indicators to trade from. Trading to catch some breakout points of where the price breaches the bands and then exiting when the price crosses the envelopes. Every trade uses a fixed lot amount and has a SL and TP. The EA does not use martingale or hedging in the logic.

** All Symbols x All Timeframes scan just by pressing scanner button ** *** Contact me after the purchase to send you instructions and add you in "ABCD scanner group" for sharing or seeing experiences with other users. Introduction This indicator scans AB=CD retracement patterns in all charts. The ABCD is the basic foundation for all harmonic patterns and highly repetitive with a high success rate . The ABCD Scanner indicator is a scanner reversal ABCD pattern that helps you identify when the pr

快量子指标 一个 创新开创 SSC模型 实时跟踪追击趋势 , 基于 创新SSC模型和 实时跟踪追击 支撑位和阻力位的突破。 这是一个创新开创策略在所有类型的市场上交易。 快量子人工智能交易( Fast Quantum AI Expert Trading Robots )事事成( EVERYTHING IS SUCCESSFUL) Fst Quantum Indicators is a innovate initiate SSC model Real time tracking pursuit trend ,based on innovate SSC model and Real time tracking pursuit the breakouts of support and resistance levels. It's a innovate initiate traded on all types of markets. Fast Quantum AI Expert Trading Robots EVERYTHING IS SUCCESSFUL

快量子指标 一个 创新开创 SSC模型 实时跟踪追击趋势 , 基于 创新SSC模型和 实时跟踪追击 支撑位和阻力位的突破。 这是一个创新开创策略在所有类型的市场上交易。 快量子人工智能交易( Fast Quantum AI Expert Trading Robots )事事成( EVERYTHING IS SUCCESSFUL) Fast Quantum Indicators is a innovate initiate SSC model Real time tracking pursuit trend ,based on innovate SSC model and Real time tracking pursuit the breakouts of support and resistance levels. It's a innovate initiate traded on all types of markets. Fast Quantum AI Expert Trading Robots EVERYTHING IS SUCCESSFUL
MetaTrader市场是您可以下载免费模拟自动交易,用历史数据进行测试和优化的唯一商店。
阅读应用程序的概述和其他客户的评论,直接下载程序到您的程序端并且在购买之前测试一个自动交易。只有在MetaTrader市场可以完全免费测试应用程序。
您错过了交易机会:
- 免费交易应用程序
- 8,000+信号可供复制
- 探索金融市场的经济新闻
注册
登录