适用于MetaTrader 5的新EA交易和指标 - 29

我们把RSI指标的一个用法写成了指标,并用红绿柱线表示,非常的简单有效。 您只需要按照填入RSI的参数,即可获得红绿柱线的RSI指标。 将RSI指标的一个用法扩展成一个功能强大的新指标,并通过红绿柱线形式直观呈现,无疑是金融技术分析领域的创新之举。红绿柱线的设计独具匠心,使得投资者能够一目了然地掌握市场动态。当柱线呈现绿色时,表明市场处于相对稳定的阶段;而当柱线转为红色时,则意味着市场可能出现波动。这种直观的视觉效果,不仅简化了分析过程,还大大提高了决策效率。
该指标的实用性也得到了充分验证。通过回溯测试和实时数据分析,我们发现它能够准确地预测市场的转折点,为投资者提供了宝贵的交易信号。此外,该指标的参数可根据不同市场和资产类型进行调整,以适应各种投资环境。
它不仅继承了传统RSI指标的优点,还通过创新的设计和功能优化,实现了更加精准、高效的市场分析。

RSI Barometer Pro 通过使用红条和绿条表示RSI值,这一创新指标为交易员和投资者提供了对市场情绪和潜在趋势逆转的直观见解。
RSI Barometer Pro中的红色和绿色条纹设计非常注重细节,在视觉上展现了市场动态。当条形图显示为绿色时,表明RSI低于50,表明市场处于相对稳定的阶段。相反,当条形图变红时,表示RSI高于50,表明潜在的市场波动性。这种直观的视觉效果简化了分析过程,使用户能够快速掌握市场情况并做出明智的决策。
RSI Barometer Pro经过严格的测试和实时数据分析,证明了其在预测市场转折点方面的非凡准确性。这种准确性为交易员和投资者提供了有价值的交易信号,增强了他们有效驾驭市场的能力。
此外,RSI Barometer Pro提供可定制的参数,以适应各种市场条件和资产类型。这种灵活性允许用户根据其特定的交易策略和偏好对指标进行微调,确保不同投资环境下的最佳表现。
通过利用传统RSI指标的优势,并结合创新的设计和功能优化,RSI Barometer Pro为精确高效的市场分析树立了新标准。它使交易员和投资者能够全面了解市场趋势,

产品描述:
RSI动量指标是一种先进的指标,它将传统的超买和超卖信号概念从RSI(相对强度指数)转换为使用红色和绿色条的直观表示。这一创新指标旨在为交易员和投资者提供可操作的见解,提供对市场状况和潜在趋势逆转的清晰评估。
RSI动量指标的独特之处在于其颜色编码的红色和绿色条,它们有效地描述了市场中的超买和超卖情况。当条形图显示为红色时,表示出现超卖情况,表明市场可能已经成熟,可以进行潜在的向上调整。另一方面,当条形图变绿时,标志着超买状态,这意味着市场可能会出现潜在的向下修正。这种可视化表示简化了分析,使用户能够快速识别战略进入或退出的机会。
RSI动量计的实用性和可靠性已通过严格的测试和实时数据分析得到广泛验证。它准确地识别超买和超卖情况,为交易员和投资者提供有价值的交易信号,以便做出明智的决策。
RSI动量表提供可定制的参数,允许用户调整指标以适应不同的市场条件和资产类型。这种灵活性确保了在各种投资环境中的适应性,并使用户能够根据其特定的交易策略和偏好对指标进行微调。
通过利用RSI指标的优势,并结合创新的红绿条设计,RSI动量指标彻底改变了超买和超卖信号的解
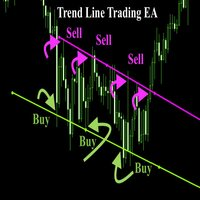
Trend Line Trade Assistant EA Semi-Automated Trading Assistant IMPORTANT : On the main/purchased program a user can click on the Trend line and change it to Buy or Sell, and drag by double clicking on it. Please keep in mind that this option is not available on demo version, due to some restrictions/limitations of Strategy Tester, some Object related operations are not available in the Strategy Tester. But, it will not prevent you from Testing, please drop an Object to chart and it wil

This is an extension indicator that allows the user to select any second time-frame from 1 to 60 second without any multiplier limitaion (ex, 7 seconds, 13 seconds ... are all allowed).
There is only one input called Interval that allows you to set the seconds timeframe you want given is in the range above. You can use indicators on that new time frame with no problems and also build your EAs based on any second timeframe. I hope this is useful, please let me know any bugs you find!
Note: Sin
FREE
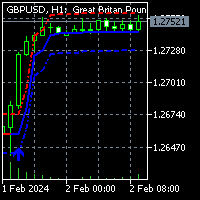
To get access to MT4 version please click here . This is the exact conversion from TradingView: "HalfTrend" by "Everget". This is a light-load processing indicator. This is a non-repaint indicator. Buffers are available for processing in EAs. All input fields are available. You can message in private chat for further changes you need. Thanks for downloading

Exclusive EA for Mini Indice (WIN) FuzzyLogicTrendEAWIN is based on strategy using fuzzy logic in which it analyzes a set of 5 indicators. Fuzzy logic and specific weights defined for each indicator are applied to the indicator values (and filters). Once the buy or sell signal fuzzy logic, a trade is opened. The signal is checked with each closed candle, this means that the graphic time is important in the decision. Parameters such as Stop Loss, Break Even among others. Recomm. Symbol: WIN (Mi

Pips on Candles shows the number of pips involved in each candle on the chart. It is possible to set 3 different ranges for counting on each single candle via the RangeType parameter: With "HighLow" you count the pips present between the minimum and the maximum. The number is shown under each candlestick on the chart. With "OpenClose" you count the pips present between the opening and closing price of the candle. The number is shown under each candlestick on the chart. With "HighDistAndLowDist"
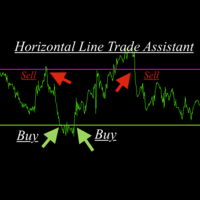
Horizontal Line Trade Assistant EA Semi-Automated Trading Assistant IMPORTANT : On the main/purchased program a user can click on the Horizontal line and change it to Buy or Sell, and drag by double clicking on it. Please keep in mind that this option is not available on demo version, due to some restrictions/limitations of Strategy Tester, some Object related operations are not available in the Strategy Tester. But, it will not prevent you from Testing, please drop an Object to chart

Exclusive Limited Time Offer! Grab this useful indicator for a lifetime at just $49. Enhance your trading experience with this amazing Metatrader indicator that tracks your live trade status. The indicator displays live take profit, stop loss & trailed stop loss, or trailed profit value with the best dashboard with account balance alert. Indicator Features:
Trade Details The indicator shows the last 5 active trades data in chronological order. Don't miss this opportunity to get your copy tod

Ever thought of your broker stop hunting your stop losses? Incognito SL and TP is exactly what you need! As promised, version 1.1 now has the SL and TP lines that can easily be adjusted by the user. ========================================== INPUTS: SL: Exact price you want the orders for the chart symbol to close when this SL price was hit. Set to 0 for no SL. TP: Exact price you want the orders for the chart symbol to close when this TP price was hit. Set to 0 for no TP. ======================
FREE

This is diamond! Contact me to send you instruction and add you in group.
Diamond Pattern is based on Read The Market(RTM) concepts. The purpose of this model is to face the big players of the market (financial institutions and banks), As you know in financial markets, big traders try to fool small traders, but RTM prevent traders from getting trapped. This style is formed in terms of price candles and presented according to market supply and demand areas and no price oscillator is used in
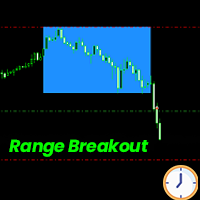
The Time Based Range Breakout Expert Advisor (EA) is a straightforward yet powerful tool designed to automate trading strategy based on intraday price range breakouts . It is suitable for traders who prioritize a disciplined and rule-based approach to trading and capitalizing on market movements within defined time windows . The EA marks the High and Low prices between the given time range and enter a trade when either the high/low of the range is breached. Suitable for trading different Fore

TRADE BOT X A trading bot for XAUUSD,GBPUSD,US-30 index. Risk levels can be adjusted using the coefficients, but also adjust the maximum drawdown as you increase the coefficients Advisable to use account sizes of USD 500 and above. Account types: Hedging accounts, Standard accounts are preferred i.e. no commissions, Use well regulated brokers eg ICMarkets. all this provides room for the strategy to work smoothly for stabilized results and removing the possibility of the model crashing. ADJUST

This Expert Advisor (EA) provides automated risk management for your trades by applying essential risk control measures. Upon execution of an order, the EA promptly sets predefined Stop Loss (SL) and Take Profit (TP) levels to safeguard your positions. In addition to SL and TP settings, you have the flexibility to establish a Break Even (BE) price level. This feature automatically adjusts the SL to the BE level once your trade has accumulated a specified number of pips in profit, ensuring that y

Are you looking for a way to make money in the forex market without risking too much? Do you want to trade with a bot that can adapt to changing market conditions and use a proven strategy to increase your profits? If you answered yes, then you need to check out Forex Martingale Bot, the ultimate trading bot that uses martingale strategy with hedging!
Forex Martingale Bot is a smart and powerful trading bot that can execute trades automatically based on your parameters. It uses the martingale

Yabai Bullet is an expert adviser (EA) built on the foundation of smart money concepts, specifically the Fair Value Gap (FVG) and the Silver Bullet strategy. Yabai is a Japanese term that can have a wide range of meanings from the good to the bad to the downright terrible. Although no developer would describe their EA as terrible, the point of this descriptive term is that this EA is customizable to such a high degree that the user has full control on just how amazingly (or terribly) it performs

This EA uses a very simple strategy by using Envelopes indicator to detect potential reversal signals filtred with n time crossover with upper and lower envelopes bands . It uses Martingale for money management . Inputs : SMA_Period : The smoothed MA period on close prices for Envelopes indicator Envelopes_deviation : the % deviation of the upper and lower envelopes bands SL_Pips : the stop loss in pips RR : the used risk reward ratio lots : the initial lot to use in martingale sequence lot

EA 的加密货币实时报价数据买价和卖价以及预订深度
可用兑换:
1.币安现货(支持活动图表窗口上的订单簿深度)和期货(支持多个订单簿深度)
2. Kucoin现货和期货,支持活动图表窗口的订单簿深度
3.Bybit期货和反向期货价格变动数据最后出价
即将推出的交易所:OKX、MEXC 等..
特征 :
1. 带有出价和要价信息的实时报价数据
2. 最佳买价和订单数量,用户可以从设置中启用/禁用深度
3. 加载历史记录:更新开盘高低收盘量和跳动量数据
4. 自动更新历史记录:重启MT5终端时填充缺失的栏
5. 您可以使用策略测试器对加密数据使用您的 EA 交易对加密交易品种的任何策略进行回溯测试
6. 该实用程序不需要加载任何外部DLL文件,并且可以在VPS上运行。
7. 自动重新连接:如果买价/卖价因网络故障而停止更新,用户可以自定义输入秒数以强制重新连接到 websocket。
注意:Webrquest 函数不支持在策略测试器上运行,因此演示将无法运行。 如果想要demo可以私信联系我
将 URL

MT4版本: https://www.mql5.com/en/market/product/90077
MT5版本: https://www.mql5.com/en/market/product/103136
“KingKong”智能交易系统 (EA) 是一种专为外汇市场设计的复杂交易算法,利用在市场流动性增加期间激活的突破策略。 该 EA 旨在利用交易量激增时发生的重大价格变动,确保在市场活动的最佳时刻执行交易。
主要特征:
突破策略:
市场流动性检测:KingKong采用先进算法实时监控市场流动性。 它确定了成交量增加的时期,这通常是价格大幅波动的前兆。
突破点识别:在这些高流动性时期,KingKong根据历史数据和技术指标来识别潜在的突破点。 EA 经过精心调整,可区分虚假突破和真正机会,确保交易执行的准确性更高。
风险管理:
平均挂单:KingKong 使用复杂的风险管理系统,其中涉及平均挂单。 这种方法通过将切入点分散在一系列价格范围内,有助于降低风险。 如果市场走势与初始仓位相反,EA 会按照预定的时间间隔下达额外订


Accurate Gold 指标是一款用户友好的工具, 无论交易者的经验水平如何,都具有直观和简单易用的特点。它专为在黄金市场上寻找M5时间框架上精确信号的交易者而设计。该指标采用先进的数学算法来分析价格波动和成交量动态,生成准确的买入和卖出信号。该指标的独特特点,包括其不重绘的性质,为交易者提供了有关潜在市场反转的宝贵见解,从而支持明智的决策。它在图表上的视觉呈现,以及听得见的警报和推送通知,提升了用户体验,使其成为寻求交易策略精准性和可靠性的黄金交易者工具包中的有价值的补充。 $ XX – 在限定时间内,前 5 位支持者的价格为 $ XX 。 ( % 已售罄)
88 美元 —— 此后,它将恢复到 88 美元的发行价,并且仅限于金色符号。
88 美元 + X ($100) – 每购买 5 次后价格就会增加 100 美元。 在此查看 MT5信号 ,论坛讨论请点击 这里 。
建议: 时间框架:仅限M5 货币对: 仅限 XAUUSD 账户类型:ECN、Raw或Razor,具有非常低的点差 经纪商时间:任何时间 经纪商:IC Market

Classic MACD
It has MACD line, Signal line, and Histogram . The Histogram has 4 colors , showing its movement direction as simple as possible. The smoothing factor in the input helps to eliminate noisy signals. Besides different price types (hlc, hlcc, ohlc, ...), there is an option to use volume data as the source for MACD calculations (which is better to be used by real volume not unreliable tick volume). While the original MACD indicator uses Exponential Moving Average, this indicator provid
FREE

Currency Strength Dynamic 貨幣強弱動態是貨幣強弱的指標。 貨幣強度是指某種貨幣所屬的大多數或所有貨幣對的趨勢方向。
該指標基於 28 種最受歡迎的貨幣對(主要貨幣對和次要貨幣對)的移動平均線之間的差異讀數,類似於 MACD 指標。
優點 獨特的振盪計算方法 可用按鈕停用或啟用特定貨幣行 資訊表 2 種類型的警報:當指標線交叉時和當指標線交叉指定水平時。 繪製的條數是可選的。
讓我們詳細看看每一點: 獨特的振盪計算方法使指標不會長時間保持在最大值,而是提前退出它們,類似於熟悉的背離和收斂效果。 該方法還包括指定的計算週期和讀數的平滑程度,這使得讀數更加平滑。 計算中不包含不必要的混亂和不必要的冗餘公式,因此減少了終端的負載。 使用按鈕來停用或啟用特定貨幣行是最方便的功能之一,因為它可以讓您擺脫未使用的貨幣,或者只是在視覺上提高您的可見性。 資訊板是該指標的另一個便利功能;它不僅反映了線條的數值讀數,還反映了高級 TF 的讀數。 此外,還有最後走勢方向的箭頭,以及指示哪些貨幣交叉的垂直配對符號。 最後的運動箭頭記錄了倒數第二根柱上的運動 - 這是一個

隆重推出 Algo Map Lite – 一款旨在彻底改变您的交易体验的尖端软件。这种先进的工具与您的交易会话无缝集成,在每种情况下提供全面的突破水平分析。
除了直观的界面和实时关卡打印功能之外,Algo Map Lite 还通过结合细致的胜率指标来强化其性能主张,从而脱颖而出。我们对透明度和可靠性的承诺体现在我们从过去 1000 笔交易的广泛数据集中得出的令人印象深刻的胜率:
- 以 1/1 的风险回报比实现 85% 以上的卓越胜率。
- 表现出惊人的 65%+ 胜率和 1/2 的风险回报比。
- 提供 50% 的强劲胜率和 1/3 的风险回报比。
- 以 1/4 的风险回报比保持稳定的 40% 胜率。
对于新手交易者来说,这些统计数据代表了他们交易决策无与伦比的准确性和信心。 Algo Map Lite 确保了安全的交易环境,让用户知道这些胜率是根据大量样本精心计算出来的。
体验 Algo Map Lite 的变革力量,旨在满足经验丰富的专业人士和新手的需求。我们的承诺不仅限于令人印象深刻的胜率; Algo Map Li

HighDaily 该专家顾问是基于HighDaily、ATR和挂单开发的,适用于EURUSD H1。它已经在超过20年的点数据上进行了99%的建模质量回测。附图显示了通过1000次蒙特卡罗分析的稳健性测试。建议选择点差和滑点较小的经纪商以获得更好的性能。无需设置任何参数,这些设置已经优化。
无需使用大额账户。我建议从200美元开始交易,每手交易量为0.01手。
蒙特卡罗测试
1000次模拟 随机化点数据,概率为30%,最大价格波动ATR为10%上下 随机化点差从0到3 随机化策略参数,概率为20%,最大变化10%
测试工作流程
内外样本测试,将测试期分为10个部分。 在不同时间框架(30M)上进行测试。 最近性测试。 蒙特卡罗模拟。
特点
每笔交易都受到止损和止盈单的保护 使用固定手数 没有马丁格尔,没有网格 不会过度消耗CPU资源 长期时间框架为H1 用户友好的设置 所有设置都经过优化
如果您有任何问题,请在购买之前与我联系。
FREE

Designed by Welles Wilder for daily commodity charts, the ADXW is now used in various markets by technical traders to assess the strength of a trend or even a trend for short- or long-term trades.
The ADXW uses a positive (DI+) and negative (DI-) directional indicator in addition to its trend line (ADX).
According to Wilder, a trend has strength when the ADX signal is above 25; the trend is weak (or the price has no trend) when the ADX is below 20. The absence of a trend does not mean that

This is one of the most popular and highly rated volatility index (VIX) indicators on the market. It provides the same readings as the VIX does for stock indexes. However, this indicator works across all asset classes. VIX Fix Finds Market Bottoms. This indicator is not for inexperienced traders. Use it for day and swing trading. MT4 Version - https://www.mql5.com/en/market/product/112238 Bernard Baruch summed it out best: "Markets fluctuate." The Chicago Board Options Exchange (CBOE) Vo
FREE

GOLD ESCAVATOR TRADING BOT A trading bot for XAUUSD. Lot size is calculated by multiplying the lot factor by each 100 USD on account. NB: These are risky strategies which give good returns over time but also pose a risk of blowing up your account. Use on your own accord. LINKS Automatic Pattern and Trendline Analyst : https://www.mql5.com/en/market/product/88794 Automatic Price Action Level Plotter: https://www.mql5.com/en/market/product/94338 MQL5 SIMPLIFIED SUMMARY; learn how to code your
FREE

Market Cycle and Trading Sessions Indicator
Introducing our Market Cycle and Trading Sessions Indicator, a tool designed to provide you with a comprehensive view of the financial market like never before. Observe the market's pulse with our exclusive indicator. Gain a deep understanding of market phases, from accumulation to distribution, to make informed, strategic decisions with a high probability.
What makes our indicator?
1. Date Range for Calculations: Customize the start and end da
FREE

Send signals to your Discord channel in a simple way. Enjoy.
All instructions on YouTube video, this don't need a large description.
I add unnecessary text that Metatrader asks me for:
Once upon a time, in a quaint little village, there lived a curious and adventurous young girl named Lily. Lily had big, bright eyes that sparkled with excitement, and she loved exploring the enchanted forest that bordered her home.
One sunny morning, Lily decided to embark on a special advent
FREE
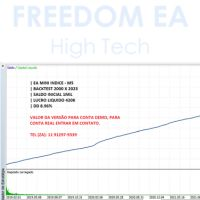
Looking to boost your financial market results?
The EA Mini Index is the answer. Tested and enhanced since 2000, this expert advisor offers operations on the M5 chart, with an initial balance of R$ 1,000 and an impressive net profit of R$ 420,000 until 2023, maintaining a drawdown of only 8.96%.
Seize this unique opportunity to increase your profitability and operate more effectively.
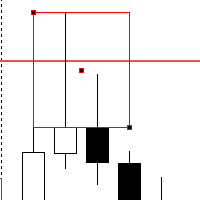
Introducing our Rejection Block Scanner – a powerful and intuitive tool designed to revolutionize your trading by effortlessly identifying key rejection zones across various timeframes. This cutting-edge scanner is crafted to cater to both beginner and experienced traders, offering unparalleled insights into potential market turning points.
**Key Features:**
1. **Multi-Timeframe Analysis:** Uncover opportunities on a grand scale! Our Rejection Block Scanner meticulously scans multiple timef
FREE

A very simple position sizing calculator to help traders calculate the right lot size per trade. It also places the order with one click. All inputs can be edited. So if you want to change the SL or TP or the lot size, you can do so before placing an order. The inputs are the following: SL - stop loss in pips (not points). set to 0 before placing an order to not add SL. TP - take profit in pips (not points). set to 0 before placing an order to not add TP. RISK - dollar amount to risk. i

O Touch VWAP é um indicador que permite calcular uma Média Ponderada por Volume (VWAP) apenas apertando a tecla 'w' no seu teclado e após clicando no candle do qual deseja realizar o calculo, clicando abaixo do candle é calculada a VWAP baseado na minima dos preços com o volume, clicando sobre o corpo do candle é calculado uma VWAP sobre o preço medio com o volume e clicando acima do candle é calculado uma VWAP baseado na máxima dos preços com o volume, voce tambem tem a opção de remover a VWA
FREE

Stat Monitor is a good information indicator.
Benefits of the indicator: The indicator provides useful information - the current spread, the cost of one lot of the symbol, trading leverage and the recommended lot size for trading. You can use the indicator on the MetaTrader 5 trading platform of any broker. The indicator provides useful information.
Version of the Stat Monitor indicator for MetaTrader 4 I wish you all good luck in trading and stable profit!
FREE

The Adaptive Market Navigator(AMN) EA is an automated trend-based trading advisor combining the advantages of ATR, Bears Power and Moving Average indicators. The used strategy is well suited for both beginners and experienced traders.
The minimum deposit is $100 for a 1:100 leverage.
I recommend to use a 1:100 ECN account with a low spread and a fast VPS.
Optimized for EURUSD pair on 1H timeframe.
Due to the simplicity and convenience of this EA every user can give it a try and choose t

The ICT Unicorn Model indicator highlights the presence of "unicorn" patterns on the user's chart which is derived from the lectures of "The Inner Circle Trader" (ICT) .
Detected patterns are followed by targets with a distance controlled by the user.
USAGE (image 2) At its core, the ICT Unicorn Model relies on two popular concepts, Fair Value Gaps and Breaker Blocks. This combination highlights a future area of support/resistance.
A Bullish Unicorn Pattern consists ou

What is this indicator? This indicator is the MACD (Moving Average Convergence/Divergence) supporting Virtual Trading mode of Knots Compositor . When the mode is turned on, the indicator will be recalculated based on the displayed candlesticks. When the mode is turned off, the indicator will be recalculated based on the original chart candlesticks.
Types of the applied price - Close - Open - High - Low - Median Price (HL/2) - Typical Price (HLC/3) - Weighted Price (HLCC/4)
KC-Indicators
FREE

What is this indicator? This indicator is the ADX (Average Directional Movement Index) supporting Virtual Trading mode of Knots Compositor . When the mode is turned on, the indicator will be recalculated based on the displayed candlesticks. When the mode is turned off, the indicator will be recalculated based on the original chart candlesticks.
KC-Indicators - KC-MA (Moving Average) - KC-ENV (Envelopes) - KC-BB (Bollinger Bands) - KC-ADX (Average Directional Movement Index)
FREE

What is this indicator? This indicator is the RSI (Relative Strength Index) supporting Virtual Trading mode of Knots Compositor . When the mode is turned on, the indicator will be recalculated based on the displayed candlesticks. When the mode is turned off, the indicator will be recalculated based on the original chart candlesticks.
Types of the applied price - Close - Open - High - Low - Median Price (HL/2) - Typical Price (HLC/3) - Weighted Price (HLCC/4)
KC-Indicators - KC-MA (M
FREE

What is this indicator?
This indicator is the Envelopes supporting Virtual Trading mode of Knots Compositor . When the mode is turned on, the indicator will be recalculated based on the displayed candlesticks. When the mode is turned off, the indicator will be recalculated based on the original chart candlesticks.
Types of the moving average - Simple (SMA) - Exponential (EMA) - Smoothed (SMMA) - Linear weighted (LWMA)
Types of the applied price - Close - Open - High - Low - Median Pri
FREE

What is this indicator? This indicator is the Stochastic Oscillator supporting Virtual Trading mode of Knots Compositor . When the mode is turned on, the indicator will be recalculated based on the displayed candlesticks. When the mode is turned off, the indicator will be recalculated based on the original chart candlesticks.
KC-Indicators - KC-MA (Moving Average) - KC-ENV (Envelopes) - KC-BB (Bollinger Bands) - KC-ADX (Average Directional Movement Index) - KC-MACD (Mo
FREE

What is this indicator?
This indicator is the Bollinger Bands supporting Virtual Trading mode of Knots Compositor . When the mode is turned on, the indicator will be recalculated based on the displayed candlesticks. When the mode is turned off, the indicator will be recalculated based on the original chart candlesticks.
Types of the applied price - Close - Open - High - Low - Median Price (HL/2) - Typical Price (HLC/3) - Weighted Price (HLCC/4)
KC-Indicators - KC-MA (Moving Averag
FREE

What is this indicator?
This indicator is the Moving Average supporting Virtual Trading mode of Knots Compositor . When the mode is turned on, the indicator will be recalculated based on the displayed candlesticks. When the mode is turned off, the indicator will be recalculated based on the original chart candlesticks.
Types of the moving average - Simple (SMA) - Exponential (EMA) - Smoothed (SMMA) - Linear weighted (LWMA)
Types of the applied price - Close - Open - High - Low - Media
FREE

What is this script?
This script deletes all objects on all charts at once. You can delete all objects on all charts at once by running the script and allowing in the message box. This script is also a plugin of MT5's FX verification software " Knots Compositor ".
How to use
1. Run the script. 2. Allow it in the message box. 3. All objects will be deleted on all charts.
FREE

Equity X è una utility che chiude tutte le posizioni ed eventuali ordini pendenti ad un importo prestabilito, è possibile fissare il bilancio del tuo conto quando il netto e uguale o superiore oppure uguale inferiore all'importo desiderato Ha integrato un sistema per la notifica mobile instantanea che genera il messaggio ad operazione avvenuta Uno strumento che permette di ottimizzare al massimo il rendimento del tuo investimento, è possibile utilizzarlo anche come gestore virtuale di take prof

The Bullish Harami candlestick pattern is formed by two candles. Here’s how to identify the Bullish Harami candlestick pattern: The first candle must be bearish and have a big body The second candle must be small and bullish The second candle is inside the body of the first candle This 2-candle bullish candlestick pattern is a reversal pattern, meaning that it’s used to find bottoms. For this reason, we want to see this pattern after a move to the downside, showing that bulls are starting to

The Tweezer Bottom candlestick pattern is formed by two candles. Here’s how to identify the Tweezer Bottom candlestick pattern: The first candle is bearish The second candle is bullish The lows from both candles should be pretty much at the same level This 2-candle bullish candlestick pattern is a reversal pattern, meaning that it’s used to find bottoms. For this reason, we want to see this pattern after a move to the downside, showing that bulls are starting to take control. When a Tweezer Bott

The Three Outside Up candlestick pattern is formed by three candles. Here’s how to identify the Three Outside Up candlestick pattern: The first candle is bearish and small The second candle is bullish and engulfs the first one completely The third candle is bullish and closes above the other ones This 3-candle bullish candlestick pattern is a reversal pattern, meaning that it’s used to find bottoms. For this reason, we want to see this pattern after a move to the downside, showing that bulls are

The Bullish Counterattack Line candlestick pattern is formed by two candles. Here’s how to identify the Bullish Counterattack candlestick pattern: The first candle is bearish and big The second candle is bullish and small There’s a gap between the close of the first candle and the open of the second candle They both close at the same level This 2-candle bullish candlestick pattern is a reversal pattern, meaning that it’s used to find bottoms. For this reason, we want to see this pattern after a

The Dragonfly Doji candlestick pattern is formed by one single candle. Here’s how to identify the Dragonfly Doji candlestick pattern: The candle has no body The wick at the bottom must be big At the top, it should have no wick, or be very small This 1-candle bullish candlestick pattern is a reversal pattern, meaning that it’s used to find bottoms. For this reason, we want to see this pattern after a move to the downside, showing that bulls are starting to take control. When a Dragonfly Doji cand

Position Manager serves as an expert advisor (EA) designed to enhance your trading experience by providing a user-friendly panel for intuitive management of your positions. This tool empowers you with a seamless interface, allowing for efficient handling of trades and improved control over your trading positions. The primary objective of Position Manager is to simplify and streamline the management of your positions, enabling you to make informed decisions with ease. Through its intuitive design
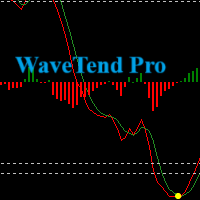
Introducing our Wave Trend Oscillator Indicator , exclusively designed for MetaTrader 5 . This advanced tool is a must-have for traders who seek precision and efficiency in their trading journey. Our oscillator is built on the principles of wave trend analysis , capturing the ebb and flow of market trends with unparalleled accuracy. It helps traders identify potential buying and selling points based on market wave patterns, enabling you to stay ahead of the market. One of the key features of ou

Subscribe to the 'MA7 Trading' channel to receive notifications about new programs, updates and other information. Ask questions in the profile on the MQL5 .
Description of work
The 'MA7 Agave' indicator is based on the standard Average Directional Movement Index (ADX) indicator. Shows the intersection of the +DI and -DI lines. Detailed information about the 'MA7 Agave' indicator.
Indicator settings
General settings: ADX period - Average Directional Movement Index indicator period.
'MA7

This indicator helps you identify support and resistance levels. Also it adds break points when level is broken. Price sometimes goes back to break point. It has 4 technical parameters and 4 buffers for expert advisors. Buffer indexes: 0 - Resistance, 1 - Support, 2 - Resistance break point, 3 - Support break point". Number of Levels: Determines how many levels are on graph ( if 3 - 3 levels of support and 3 levels of resistance) Tolerance in percentage %: This parameter is used to filter out

我们的目标,是让每一个交易者都拥有真正属于自己的交易系统。
指标 --- 红绿系列 极致简单,红涨绿跌!可以单独使用,也可以搭配其他指标使用。 这是一个两条均线交叉的红绿指标。我们还有更多,将会陆续添加, 请购买的朋友务必在购买后联系我们。
在金融交易的世界里,每个市场参与者都必须直面一个不可回避的事实,那就是不确定性。无论是市场的短期波动,还是长期的趋势变化,都充满了未知和变数。然而,对于那些深谙交易之道的人来说,处理这种不确定性的秘诀之一就是 “做减法”。 做减法,顾名思义,就是简化复杂的交易逻辑和决策过程。在瞬息万变的交易市场中,过度思考和犹豫不决往往是交易者的大敌。通过化繁为简,交易者可以更快地做出反应,更有效地捕捉市场的脉动。这种简化的过程,就像是把一张复杂的地图浓缩成一张简略的路线图,虽然舍弃了一些细节,但却能让人更快地找到目的地。 为此,我将致力于打造一个独特的红绿指标系统。这种指标并非基于传统的、复杂的金融数据分析,而是将核心的交易逻辑简化成了一目了然的红色和绿色。红色代表市场的上涨趋势,绿色则代表下跌趋势。这样的设计,不仅使得交易决策变得简单明了,而且极大地
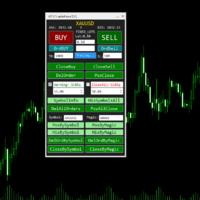
#property description " MT5TradePanel_V1 " The panel supports market and pending orders Closing of positions by order type -trade -statistics - risk management - Trailing Stop -select the variant of risk calculation -FIXED_LOTS, // fixed lots -RISK_MONEY, // lots based on money -RISK_RATIO // risk percent of account - percent of loss warning -percent od loss close all
MN1-W1-D1 Close Price Indicator to Index Trading for MT5
The indicator draws lines to the close prices of the last closed bars of monthly, weekly and daily timeframes. Observably, these prices are significant support and resistance prices at major indices, like Nasdaq, DAX. The info panel always shows the prices relative to each other in the correct order. If the current price is the highest - i.e. higher than the last monthly, weekly and daily closing price - it is in the first row. The lowest

Introducing the Accelerator Divergence Indicator, a powerful tool designed to enhance your Forex trading experience. This innovative indicator is specifically crafted to identify market divergence, providing traders with valuable insights for more informed decision-making. The Accelerator Divergence Indicator utilizes advanced algorithms to detect divergence in the market, visually guiding traders with precision-drawn lines that highlight key points of interest. Divergence occurs when the price
FREE

Introducing the Engulfing Goddess Metatrader 5 (MT5) Indicator , a revolutionary tool designed for traders who seek to harness the power of candlestick patterns in their trading strategy. This indicator is built on the principles of engulfing candlestick patterns , a popular method used by successful traders worldwide. Our Engulfing Goddess Indicator stands out with its ability to detect various kinds of engulfing patterns . It employs a range of filters, providing you with a comprehensive anal

Baby WPR opera automáticamente en base al algoritmo oscilador WPR. Es capaz de llegar a generar resultados alcistas en las pruebas realizadas con el par de FX GBPUSD en el marco temporal H1 Se puede testear en otros instrumentos ajustando sus diversas opciones. Diseñado para operar con un capital mínimo de 100 USD y un apalancamiento de 1:30 Ideal para los iniciados. Con Baby WPR no esperes grandes beneficios con la configuración conservadora por defecto, por el contrario habrán DD significativo
FREE

Exclusive FOREX account HEDGE FuzzyLogicTrendEA is based on fuzzy logic strategy based on analysis 5 indicators and filters.
When the EA analysis all this indicators, it decides, based on its fuzzy strategy, which trade will be better: sell or buy.
As additional functions, it´s possible defines spread maximum, stop loss and others.
Recomm. Symbol: EURUSD, AUDUSD, GBPUSD, NZDUSD, USDCAD, AUDCAD, EURCAD e USDJPY
Recomm. timeframe: H1.
Backtest were done on EURUSD, H1, 01/07/2023 - 26/0

Introducing The Day Trader System: Your Shortcut to Day Trading Success! Are you a day trader seeking simplicity without compromising profitability? Look no further! We present The Day Trader System – your go-to solution for identifying lucrative opportunities in the fast-paced world of Forex. Simple Yet Powerful: The Day Trader System is a straightforward yet highly effective indicator designed exclusively for day traders. Say goodbye to complexity and hello to a system that simplifies
FREE

ACCOUNT FLIPPER EA A trading bot for GBPUSD Lot size is calculated by multiplying the lot factor by each 1000 USD on account. Advisable to use account sizes of USD 1000 and above. Account types: Hedge accounts, Standard accounts are preferred i.e. no commissions, Use well regulated brokers eg ICMarkets. all this provides room for the strategy to work smoothly for stabilized results and removing the possibility of the model crashing. ADJUST The Time settings to your own time zone because the
FREE

Introducing UJ Master EA, a simple yet powerful Expert Advisor for trading the USDJPY pair! Developed, tested and traded by a team of experienced traders with trading experience of over two decades. Prop-Firms Ready Easy To Set up Not sensitive to broker conditions UJ Master EA is updated every 3 months to get the best results!
UJ Master EA utilizes a complex price action strategy and smart money concepts, following strict mechanical rules. For the best possible results, follow these st

Now, you have your own AUTO-CLOSE program ! Once your account target or drawdown hits, all open orders will be closed automatically. ========================================== INPUTS: Account target: Put the exact account target. Once the equity hits it or went above that, all orders closed. Please add buffer to consider slippage. Use fixed value or dynamic value: Choose whether you will need a fixed value or dynamic value for drawdown. DYNAMIC SETTINGS: Equity-based or Balance-based drawdo

Что показывает на графике индикатор TrendBreak? 1 — рисует линию тренда до максимальных максимумов в 100 баров. 2 — рисует линию тренда до максимальных максимумов в 30 баров. 3 — рисует линию тренда до максимальных минимумов в 100 баров. 4 — рисует линию тренда до максимальных минимумов в 30 баров. И эти линии указывают на сжатие тренда. Также индикатор выбирает 100-й бар и рисует ровную линию к максимуму и минимуму.
FREE

O Chart Control é um indicador que permite de forma rapida e pratica alterar o timeframe e ativo do grafico, possibilitando que voce possa fazer todas as suas analises em apenas um grafico sem precisar abrir vários, além disso voce pode escolher o entre os temas claro e escuro para o qual melhor se adapta a sua preferencia.
MT4: https://www.mql5.com/pt/market/product/112155
FREE

Introducing Trader's NotifierYo,ur Ultimate Trading Companion
Are you tired of missing crucial market moments because you looked away for just a moment? The frustration of waiting for that perfect confluence, only to realize you've missed it, can be overwhelming. But fear not, because Trader's Notifier is here to revolutionize the way you trade!
Seize Every Opportunity
Trader's Notifier is your vigilant ally, keeping a watchful eye on your charts so you don't have to. No more staring at t
FREE
MetaTrader市场提供了一个方便,安全的购买MetaTrader平台应用程序的场所。直接从您的程序端免费下载EA交易和指标的试用版在测试策略中进行测试。
在不同模式下测试应用程序来监视性能和为您想要使用MQL5.community支付系统的产品进行付款。
您错过了交易机会:
- 免费交易应用程序
- 8,000+信号可供复制
- 探索金融市场的经济新闻
注册
登录