适用于MetaTrader 5的新EA交易和指标 - 181

The VWAP indicator is our version of the popular Volume-Weighted Average Price indicator. The VWAP is the ratio between the value traded (price multiplied by the number of volume traded) and the total volume traded over a specific time period. As a result, it measures the average price of the instrument much better than the simple moving average. Although there are many ways to use the VWAP, most investors use it to calculate the daily average.
The indicator works in five modes: Moving - In

HiLo Activator v1.02 by xCalper The HiLo Activator is similar to moving average of previous highs and lows. It is a trend-following indicator used to display market’s direction of movement. The indicator is responsible for entry signals and also helps determine stop-loss levels. The HiLo Activator was first introduced by Robert Krausz in the Feb. 1998 issue of Stocks & Commodities Magazine.

Harmonic patterns are characteristic series of price movements with respect to Fibonacci levels, which statistically precede price reversals. This indicator searches for harmonic patterns. It is capable of recognising 26 classical and non-classical harmonic patterns : Classical Gartley Butterfly Alternate Butterfly Bat Alternate Bat Crab Deep Crab Three Drives Non-classical Shark Alternate Shark Cypher 5-0 Anti Gartley Anti Butterfly Anti Alternate Butterfly Anti Bat Anti Alternate Bat Anti Crab

This is the demo version of "All Harmonics 26" indicator . "All Harmonics 26" searches for 26 types of harmonic patterns and outputs them in a convenient way. You can check out the documentation here . This demo version has the following limitations: The indicator searches only for one type of harmonic patterns out of 26:- Gartley. The indicator outputs new patterns with a lag of 10 bars.
FREE

The Camarilla Pivots indicator is fully configurable and can be adjusted to work in different ways. If you are a manual trader and prefer a clean chart, you can configure the indicator so that it only draws camarilla pivot points for the current session. Otherwise if you are developing an expert advisor that uses pivot points, you can configure the indicator to show historical camarilla pivots as well. Another unique feature of this indicator is that, when calculating daily camarilla pivots, it

This is the forex visual orders tool & forex position size (lot) calculator with intuitive panel. Risk Reward Ratio Indicator works on all kind of symbols: currency pairs, indices, metals, commodities, cryptocurrencies, etc.
If you want to make sure that Risk Reward Ratio Indicator works on your favorite symbols contact us ( visit our profile ) and ask for 7-day free trial to test this tool without limits. If you want to place orders easier, faster and more intuitive? If you like to mark tr

Knowledge of the strength and weakness of each currency is vital for every forex trader. Our Currency Strength Meter indicator measures the strength of eight major currencies (USD, EUR, GBP, CHF, JPY, CAD, AUD, NZD) by using the Relative Strength Index indicator, also known as RSI. The Currency Strength Meter indicator shows you, simply and quickly, when a currency is oversold, overbought, or in "normal area". This way, you can identify which currency is the strongest and the weakest.
Our
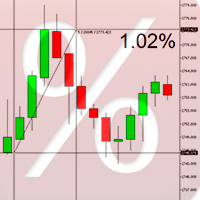
Percent Crosshair is a powerful and easy percentage measure tool. Measure the chart percentage very quick! Don't waste your time anymore! Just attach the Percent Crosshair indicator in the chart, select crosshair mode at toolbars or press "Ctrl+F" and start using the crosshair as you always do! The percent measure will be next to the indicative price. Customize your indicator the way you want! There are 4 entry parameters: Positive % color: set the desired color when % is positive. Negative % co

The Classic Pivot Points indicator is fully configurable and can be adjusted to work in different ways. If you are a manual trader and prefer a clean chart, you can configure the indicator so that it only draws pivot points for the current session. Otherwise if you are developing an expert advisor that uses pivot points, you can configure the indicator to show historical pivot points as well. Another unique feature of this indicator is that, when calculating daily pivots, it is possible to set a

The Volume indicator is an excellent tool for measuring tick volume or real volume activity. It quickly and easily helps traders evaluate the volume's current size. The indicator for classification of the volume size uses the moving average and its multiples. Accordingly, the area where the volume is located (relative to the moving average) is labeled as ultra-low, low, average, high, very high, or ultra-high. This indicator can calculate the moving average by four methods: SMA - Simple Moving

The ATR indicator is a helpful tool for measuring the range of bars. It quickly and easily helps evaluate the ATR's current spread (range), which is especially useful for VSA traders. The indicator for classifying the range of bars (candles) uses the moving average and its multiples. Accordingly, the area where the volume is located (relative to the moving average) is labeled as ultra-low, low, average, high, very high, or ultra-high. Our ATR indicator is rendered as a histogram. This indic

KL Visual Risk Manager Pro – the tool for traders for whom capital preservation is a top priority. Let me present my new revolutionary method of sending orders according to what you see on a chart, which is in full accordance with Risk Management. Sending orders without human errors, using an appropriate currency pair, without gambling a lot size and with SL and TP set on chart according your technical analysis and methodology - all these are made in four mouse clicks and in a matter of seconds.

这是一个 MTF 指标,它基于 带有价格标签的 Advanced ZigZag Dynamic 和/或 Extended Fractals 指标极值(可以禁用)。可以为 MTF 模式选择更多更高的 TF。默认情况下,级别是基于 ZigZag 指标点生成的。分形指标点也可以与 ZigZag 一起使用或代替它。为了简化使用并节省 CPU 时间,每根柱线在开盘时执行一次计算。 参数: ForcedTF - 水平计算的图表时间范围(可能等于或超过当前时间) MinPipsLevelWidth - 以点为单位的最小关卡宽度(用于非常紧凑的关卡) Use ZigZag Extremums points - 启用/禁用使用 ZigZag 峰值计算支撑/阻力水平 Fixed pips range - 计算 ZigZag 指标的最小值和最大值之间的距离 UseDynamicRange - 启用/禁用 ZigZag 指标最小值和最大值之间距离的动态计算 Dynamic volatility period - 用于计算 ZigZag 指标最小值和最大值之间的动态距离的波动期 Dynamic vola

The signal is generated using standard Gator indicator. Gator Oscillator is based on Alligator and shows the degree of convergence/divergence of its balance lines (smoothed Moving Average). The upper histogram is the absolute difference between the values of blue and red lines. The lower histogram is the absolute difference between the values of red and green lines with the 'minus' sign since the histogram moves downwards. The EA works with any Forex symbol. Optimization is performed for one wee

This is a professional robot based on the Parabolic SAR indicator set. The Expert Advisor is designed for the analysis of trending markets. On the "bull market" the indicator is below the prices, on the "bearish market" it is above the price. If the price crosses the Parabolic SAR lines, the indicator reverses, and its further values are located on the other side of the price. The EA correctly processes errors and works reliably in the market. It can work with the initial deposit of $100! It i

This indicator is based on the classical indicator RSI (Relative Strangth Index) and will be helpful for those who love and know how to use not a visual but digital representation of the indicator. All TimeFrames RSI MT5 indicator shows values from each timeframe. You will be able to change the main input parameters for each RSI for every TF. Example for M1: sTF1_____ - label (string) of M1 TF. Period1 - number of bars used for the indicator calculations. Price1 - price used. Can be any of the p

The product works with any Forex pair. The Expert Advisor is designed for intraday trading. The signal is generated by means of the AC indicator using different combinations of signal generation according to the indicator data. Optimization is performed for one week on a minute chart. The predicted time before re-optimization is one week as well. The screenshots show examples of optimization and forecast. The first parameter (the top one when sorting by the result) is selected for the used param

The Candle Length Indicator Alarm generates a sound alert, sends a push notification and an email when the size of the current candlestick changes. The size of the current candlestick can be measured in two ways: The first method: the size of the candlestick is measured from the beginning of the candlestick (from the OPEN price). The second method: the size of the candlestick is measured from current price. The indicator has the following settings: sound — a sound file from the folder: "...\Meta

This is a ready-made professional position tracking system. It works on all currency pairs and timeframes. The product processes the errors correctly and works on the market efficiently. The trading robot applies basic concepts - breakeven and trailing. The trailing is based not on indicators but on the last bar of the specified time interval ( TrailingStep Period ) or points ( Trailing Stop =0). Parameters: Deviation – requotes. Sleeps – waiting for position modification. Trailing Period – the

The Relative strength index is an oscillator that follows price, it was introduced by Welles Wilder, who went on to recommend the 14 period RSI. This adaptive version is based on the indicator described by John Ehlers, in the book 'Rocket Science for Traders'. The indicator uses the homodyne descriminator to compute the dominant cycle. To apply the homodyne descriminator, real and imaginary parts have to be calculated from the Inphase and Quadrature components. (Inphase and Quadrature components
FREE

The Commodity Channel Index computes the deviation of the typical price of each bar from the average price over a particular time period. Multiplying the median deviation by 0.015 facilitates normalization, which makes all deviations below the first standard deviation less than -100, and all deviations above the first standard deviation more than 100. This adaptive version is based on the indicator described by John Ehlers, in the book Rocket Science for traders. The indicator uses the homodyne
FREE

Complete Pending Orders Grid System opens any combinations of Buy Stop, Sell Stop, Buy Limit and Sell Limit pending orders and closes all existing pending orders. You just need to drop this script on the chart of a desired currency pair. Before placing all pending orders, the input window is opened allowing you to modify all input parameters: DeleteAllPendings – if 'true', then all pending orders (for current currency) are deleted. BuyStop – if 'true', Buy Stop order is opened. SellStop – if 'tr

BuyStop_SellStop_Grid script opens BuyStop and SellStop pending orders and deletes all existing pending orders. You just need to drop this script on the chart with a desired currency pair. Before placing all pending orders, the input window is opened allowing you to modify all input parameters: DeleteAllPending - if TRUE, then all pending orders are deleted; BuyStop - if TRUE, BuyStop order is opened; SellDtop - if TRUE, SellStop order is opened; InitLot - initial lot; LotCoeff - if 1, all pen

BuyLimit_SellLimit_Grid script opens Buy Limit and Sell Limit pending orders. You just need to drop this script on the chart with a desired currency pair. Before placing all pending orders, the input window is opened allowing you to modify all input parameters: DeleteAllPending – if 'true', all pending orders are deleted. BuyLimit – if 'true', Buy Limit order is opened. SellLimit – if 'true', Sell Limit order is opened. InitLot – initial lot. LotCoeff – if 1, all pending orders have the same lot

This indicator is based on the classical indicator Parabolic SAR and will be helpful for those who love and know how to use not a visual, but digital representation of the indicator. All TimeFrames PSAR MT5 indicator shows values from each timeframe (M1, M5, M15, M30, H1, H4, D1, W1 and MN1). You will be able to change the main input parameters for each Stochastic from every TF. Example for M1: sTF1 = M1 pStep1 = 0.02 pMax1 = 0.2

Bollinger Bands Technical Indicator (BB) is similar to envelopes. The only difference is that the bands of Envelopes are plotted a fixed distance (%) away from the moving average, while the Bollinger Bands are plotted a certain number of standard deviations away from it. Standard deviation is a measure of volatility, therefore Bollinger Bands adjust themselves to the market conditions. When the markets become more volatile, the bands widen and they contract during less volatile periods. This ada
FREE

The indicator plots two lines by High and Low prices. The lines comply with certain criteria. The blue line is for buy. The red one is for sell. The entry signal - the bar opens above\below the lines. The indicator works on all currency pairs and time frames It can be used either as a ready-made trading system or as an additional signal for a custom trading strategy. There are no input parameters. Like with any signal indicator, it is very difficult to use the product during flat movements. You
FREE

This indicator is based on the classical indicator CCI (Commodity Channel Index) and will be helpful for those who love and know how to use not a visual but digital representation of the indicator. All TimeFrames CCI MT5 indicator shows values from each timeframe. You will be able to change the main input parameters for each CCI for every TF. Example for M1: sTF1_____ = "M1"; Period1 = 13; Price1 = PRICE_CLOSE.

This indicator is based on the classical STOCHASTIC indicator and will be helpful for those who love and know how to use not a visual, but digital representation of the indicator. All TimeFrames Stochastic MT4 indicator shows values from each timeframe (M1, M5, M15, M30, H1, H4, D1, W1 and MN1). You will be able to change the main input parameters for each Stochastic from every TF. Example for M1: sTF1_____ = M1 K_Period1 = 5 D_Period1 = 3 S_Period1 = 3 Method1 = MODE_EMA

The script allows to close all opened positions if Sum of Profit from all opened positions is greater than value of the input parameter: SumProfit .
Input parameters SumProfit = 100 You can change SumProfit to any positive value ( in dollars , not in the points!). This script will close all positions for a given currency pair only. Keep in mind that you have to " Allow automated trading " on the "Expert Advisors" tab (Tools->Options).

Many indicators are based on the classical indicator Moving Average . The indicator All_TF_MA shows crossing of 2 MA from each TimeFrames . You will be able to change main input parameters for each MA for every TF. Example for M1 TF: Period1_Fast = 5 Method1_Fast = MODE_EMA Price1_Fast = PRICE_CLOSE Period1_Slow = 21 Method1_Slow = MODE_SMA Price1_Slow = PRICE_TYPICAL

The Zig-Zag indicator is extremely useful for determining price trends, support and resistance areas, and classic chart patterns like head and shoulders, double bottoms and double tops. This indicator is a Multi Time Frame indicator. The indicator is automatically calculate the 3 next available TF and sows ZigZag from those TimeFrames. You cannot use this indicator for the TF greater than D1 (daily). You have to have ZigZag indicator in the Indicators/Examples tab.

This is an unusual representation of the Average Directional Movement Index. The indicator has been developed at the request of a trader and for the purposes of learning the development of indicators in MQL5. The line shows the same as the standard Average Directional Movement Index (ADX); The upward histogram shows the difference between +DI and -DI, when +DI is above -DI; The downward histogram shows the difference between +DI and -DI, when +DI is below -DI.
FREE
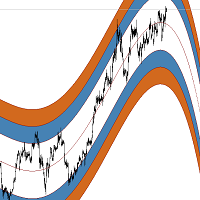
ExpertRegression is a professional trading robot, which implements the classic trading strategy inside a channel based on regression signal. The signal is formed at a breakthrough of the upper and lower limits of the regression range. If the price pierces the upper border of the regression and the price is fixed above this border, it is the signal for buying. If the price pierces the lower border of the regression and the price is fixed below this border, then it's the signal for selling. Can wo

This indicator calculates support and resistance prices in multi-timeframe with different formulation and draw them on the chart that style do you choose. And If you want, Indicator can alert you when the current price arrive these pivot levels. Formulations: Classic, Camarilla, Woodie, Demark, Floor, Fibonacci
Alert Options: Send Mobil Message, Send E-mail, Show Message, Sound Alert
Levels: PP, S1, S2, S3, S4, S5, R1, R2, R3, R4, R5, TC, BC and Middle Points Why do you need this indicator:

The idea of enhancing the free Slider utility appeared after the release of a lite version of the EA trade panel Trading Chaos Expert Lite , which operates in the Current Chart mode without the possibility to maintain trades of several symbols in a single window. The purpose of Slider profy Ease search for trading signals by automatic display of charts of currency pairs from the "Market Watch" one by one at a specified interval of time in seconds. Automation of one-click placing of pending ord

This indicator calculates the next possible bar for each currency pair and timeframe. If the next possible Close will be greater than Open, the next possible bar will be in Aqua color. If the next possible Close will be less than Open, the next possible bar will be in Orange color. Of course, the next possible bar will not show the big price movement. This indicator is most useful in the quiet time.

信号在动量的方向产生。法官正确处理错误,工作可靠,在市场上。 100元的营运资金!此外,该信号可以被反向。专家还内置逐行排序函数的优化,这是可取的,以优化使用模式“自定义最大值”。
参数:
OnOptimizationSharp - 当优化rezhyme“自定义最大”是一个可选的koefitsient夏普。
工作时间 - 这对于专家的工作时间。
风险 - 进入该市场的风险,其定义为存款项目的总损失的百分比是指相对于止损和允许损失止损时。
LotRounding - 四舍五入很多(以小数)。
偏差 - 重新报价。
卧具 - 等待打开,关闭或修改的位置。
止损 - 止损。
止赢 - 平仓。
信号周期 - 在该指示灯熄灭的时间。
SignalBar - 酒吧,其中一开始就看(1 - 这是第一个完全形成的吧)。
反转 - 输入信号的反转。
优化:止损15年1月3日
止赢15年1月3日
PeriodSignal M1
M5
SignalBar01月15日
反转
以
期限33年3月1日
AppliedP

This indicator is designed for M1 timeframe and shows: sum of ticks when the price goes up divided by sum of ticks when the price goes down (red color); sum of points when the price goes up divided by sum of points when the price goes down (green color). The correlation between the number of ticks and the number of points for each and every minute will give enough data for scalping.

News Trader Pro is a unique robot that allows you to trade the news by your predefined strategy. It loads every piece of news from several popular Forex websites. You can choose any news and preset the strategy to trade it, and then News Trader Pro will trade that news by selected strategy automatically when the news comes. News release gives opportunity to have pips since the price usually has big move at that time. Now, with this tool, trading news becomes easier, more flexible and more exciti

Trade Receiver Free is a free tool to copy trades/signals from multiple MT4/MT5 accounts. The provider account must use copier EA to send the signal. This version can be used on MT5 accounts only. For MT4 accounts, you must use Trade Receiver Free . Reference: - For MT4 receiver, please download Trade Receiver Free .
- For MT5 receiver, please download Trade Receiver Free MT5 .
- For cTrader receiver, please download Trade Receiver Free cTrader .
- If you only need copy from MT4 accoun
FREE

Introduction to Harmonic Pattern Scenario Planner
The present state of Forex market can go through many different possible price paths to reach its future destination. Future is dynamic. Therefore, planning your trade with possible future scenario is an important step for your success. To meet such a powerful concept, we introduce the Harmonic Pattern Scenario Planner, the first predictive Harmonic Pattern Tool in the world among its kind.
Main Features Predicting future patterns for scenari

This is a utility created to ease charts watching on tablet PCs. The indicator allows you automatically alternately display "slide show" of all currency charts from "MarketWatch". The user can set the display time interval (in seconds) between charts in indicator settings. In addition, there is an option of selecting the angle of Start/Stop button which starts and stops the display of charts. This function is very useful if a trader noticed a trading signal and would like to study it in more det

This indicator shows the ratio of the number of buyers'/sellers' orders for the Russian FORTS futures market. Now, you can receive this information in real time in your МetaТrader 5 terminal. This allows you to develop brand new trading strategies or improve the existing ones. The data on the ratio of the orders number is received from the database (text CSV or binary one at user's discretion). Thus, upon completion of a trading session and disabling the terminal (or PC), the data is saved and u
This indicator shows the ratio of the volume of buyers'/sellers' orders for the Russian FORTS futures market. Now, you can receive this information in real time in your МetaТrader 5 terminal. This allows you to develop brand new trading strategies or improve the existing ones. The data on the ratio of the volumes of orders is received from the database (text CSV or binary one at user's discretion). Thus, upon completion of a trading session and disabling the terminal (or PC), the data is saved a

The indicator is designed for easy construction of synthetic charts based on data of various financial instruments. It will be useful both arbitrage and pair trading, as well as for analysis purposes. Its main advantage is simplicity and clarity. Each chart is given as a common mathematical formula. For example, if you want to plot the spread (difference) between EURUSD and GBPUSD with coefficients 4 and 3, then set the following formula: EURUSD * 4 - GBPUSD * 3 The resulting chart is shown in t
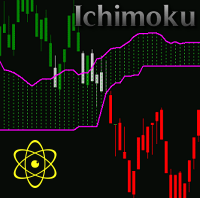
专业的机器人,它实现了经典的交易策略指标RobotIchimoku。
信号在一目变化趋势时产生的。要做到这一点,我们将分析转换森和基准森的交集。当转换森穿越基准森从下往上买的信号。自上而下是一个卖出信号。
法官正确处理错误,工作可靠,在市场上。 100元的营运资金!选择老本行,或在两个方向,或者只购买或出售是很重要的。此外,该信号可以被反向。
专家使用的基本概念,盈亏平衡点,拖网,止损和止盈,以及关闭相反的信号。和一个重要的功能,正确计算的风险。
没有输出功能单元很多,使用风险的概念,将止损是强制性的,因为它是从许多测量相对于允许的损耗对于一个给定的风险。
任谁在使用一个固定的大量优化,没有风险的专家,会给显然是不正确的结果。优化窃取起来,这将增加在初始间隔历史的平衡的参数时起。然后,一切都很简单,具有大量供应平衡,固定的工作很多,就能够通过任意数量的故事!但同时通过在不同的地方运行的专家,在历史上,这是很容易下沉。因此,在优化风险的概念,以及工作所需!在这种情况下,一个工程风险 - 1%的定金。
专家还内置逐行排序函数的优化,这是可取的,以优化使用模式“自定义

News Loader Pro is a tool that automatically updates every economic news in real time with detailed information from several online data sources. It uses the unique technology to load data with full details from popular Forex websites. An alert will be sent to your mobile/email before an upcoming news release. Moreover, it also marks the news release points on the chart for further review and research. In Forex trading, news is one of the important factors that move the market. Sticking with ne

该算法基于货币功率计指标的思想。在此版本中,显示值的数量不受限制,其代码更加紧凑和快速,可以通过指标缓冲区获取当前柱的值。 指标显示的内容 :货币前的细条带和上方数字显示最近 N 小时的相对强弱指数(N 在变量“小时”的参数中设置),较宽的条带显示每日指数。您在输入参数中指定的使用该货币的货币对越多(假设您的经纪商为这些货币对提供报价),该指数的权重就越大(但要小心“非主要”或外来货币对,它们可以扭曲整体画面)。例如,如果您只指定了 EURUSD,则欧元的相对指数将仅基于此对计算,如果您添加 EURGBP,则欧元指数将基于两个对计算并获得更加权的值。 如何使用数据 :在没有重要新闻的情况下,指数值越低/越高,技术修正或趋势延续的可能性就越大。
FREE
专业的机器人,实现贸易和过境价格滑动的经典策略。
当穿越移动和价格买入或卖出的信号之间形成的。该信号的方向被设置在该设置。
法官正确处理错误,工作可靠,在市场上。 100元的营运资金!选择工作的方向或双方,或只是购买或出售是很重要的。
专家使用的基本概念,盈亏平衡点,拖网,止损和止盈,以及关闭相反的信号。
参数概述:
魔术 - 魔术数字,任意整数。
工作周期 - 在其上专家的工作时间。
风险 - 即进入市场的风险,定义为存款项目的总损失的百分比是指相对于止损和允许亏损时止损。
LotRounding - 四舍五入很多(以小数)。
偏差 - 重新报价。
卧具 - 等待打开,关闭或修改的位置。
止损 - 止损。
止赢 - 平仓。
结尾句点 - 运行拖网的时间。
尾随盈亏平衡 - bezubytka0级 - 关闭。
尾部开始 - 级开始拖网0 - 关闭。
追踪止损 - 0级拖网 - 拖网下车点,较积极的拖网时期
TrailingStep时期 - 二尖瓣时期
禁止新系列 - 如果你想完成的当
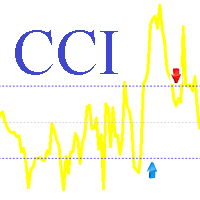
This is a professional trading robot, which implements the classical CCI based trading strategy. The signal is produced upon exiting of CCI from the overbought/oversold areas; the levels of those areas will be levels with the values of LevelMax and LevelMin . We buy, as CCI falls lower then level LevelMin and then rises above it. We sell, as CCI rises above level LevelMax and then falls below it. Also, the signal can be inverted. The EA correctly processes errors, and works reliably in the marke

The indicator determines and marks the short-term lows and highs of the market on the chart according to Larry Williams` book "Long-term secrets to short-term trading". "Any time there is a daily low with higher lows on both sides of it, that low will be a short-term low. We know this because a study of market action will show that prices descended in the low day, then failed to make a new low, and thus turned up, marking that ultimate low as a short-term point. A short-term market high is just

This is a professional trading robot, which implements the classical Envelopes based trading strategy. A signal is generated when prices rolls back from the boundaries of the Envelopes. If the price pierces or touches the upper border of the Envelopes channel and then returns back, it's the signal to sell. If the price pierces or touches the lower border of the Envelopes channel, it's the signal to buy. The EA correctly processes errors and works reliably in the market. It is important to choose
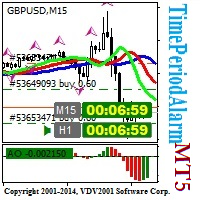
The TimePeriodAlarm indicator shows time till closure of a bar. If the 'Time period' is specified explicitly (i.e. not 'current'), the indicator displays the time till bar closure of the current period and the explicitly specified period. Ten seconds before the closure of the bar (at the period specified explicitly), a preliminary sound alert is played and a color alert is generated, then the main signal (can be set by the user) in the parameter 'Sound file(.wav)' is played. The sound file shoul

热图指示器 此热图指标允许您显示在市场报价中选择的所有代码的“热图”。在此版本中,它显示了 相对于上次每日收盘价的价格变化百分比 ,可以快速了解市场概况。 这是一种工具,可帮助交易者确定一种货币相对于所有其他货币对的强度。这是一个可视化工具,不能在“EA 交易”中使用。从这个意义上说,它更像是一种自由交易者的工具,而不是自动交易者。因此,对于那些有兴趣使用此工具进行自动交易的人来说,很遗憾这是不可能的。 它对股票或期货市场特别有用,例如巴西交易所 Bovespa。
设置 热图指示器中有几个设置需要自定义: <头> 设置 可能的值
描述
隐藏图表? 真 /假
您可以完全隐藏图表或保持原样。当指标从图表中移除时,图表将恢复。
在前景中绘制的图表? 真/ 假
如果之前的设置为 True,您可以选择在前景 (true) 或背景 (false) 中显示图表。
自动排列热图? 真 /假
如果为 true,所有尺寸和排列都会自动完成。否则必须选择进一步的设置。
刷新时间(毫秒) >=1000
数据默认每 5 秒刷新一次。最小值为 1,000(1 秒)。
上色 任何颜色
默认

This is a multiple timeframe version of the classic Parabolic SAR indicator (stands for "stop and reverse"). PSAR follows price being a trend following indicator. Once a downtrend reverses and starts up, PSAR follows prices like a trailing stop. You can choose the timeframes for displaying PSAR on the chart. Of course, you can see PSAR only from the current and higher timeframes. Input parameters: bM15 - PSAR from M15 bM30 - PSAR from M30 bH1 - PSAR from H1 bH4 - PSAR from H4 bD1 - PSAR from D1
This is a utility for storing the data on open interest (OI), ratio of buyer/seller orders' number and the ratio of buyer/seller orders' volumes on the Russian FORTS futures market. This is the first product of the series. Now, you can trace history of the specified data in real time in МТ5 terminal. This allows you to develop brand new trading strategies or considerably improve the existing ones. The data received from FORTS market is stored as a database (text CSV or binary one at user's discr
FREE

This is an open interest indicator for the Russian FORTS futures market. Now, you can receive data on the open interest in real time in МТ5 terminal. This allows you to develop brand new trading strategies or considerably improve the existing ones. The data on the open interest is received from the database (text CSV or binary one at user's discretion). Thus, upon completion of a trading session and disabling the terminal (or PC), the data is saved and uploaded to the chart when the terminal is

Rooster - is a handy tool that allows you to receive alerts from your favorite indicators: Supports up to 3 indicators, built-in and custom; Supports up to 4 different signals at the same time; Able to show pop-up alerts, send e-mail and push notifications. This is version for MetaTrader 5, version for MetaTrader 4 is here . Detailed manual is sent on request. Default settings demonstrate MACD lines crossing signal.

Trade Copier Pro MT5 is a tool to copy trade remotely to multiple MT4, MT5 and cTradfer accounts at different computers/locations over internet. This is an ideal solution for you if you are a signal provider and want to copy your trades to other receivers globally on your own rules. One provider can copy trades to multiple receivers and one receiver can get trade from multiple providers as well. The provider can even set the subscription expiry for each receiver, so that receiver will not be abl

Attention: Demo version for review and testing can be downloaded here . It does not allow trading and can only be run on one chart. Active Lines - a powerful professional tool for operations with lines on charts. Active Lines provides a wide range of actions for events when the price crosses lines. For example: notify, open/modify/close a position, place/remove pending orders. With Active Lines you can assign several tasks to one line, for each of which you can set individual trigger conditions

该指标基于动态锯齿形调整浪 (https://www.mql5.com/en/market/product/5356 ) 在图表上显示谐波模式,几乎是著名 korHarmonics 版本之一的完整模拟。该指标识别以下形态及其品种:ABCD、Gartley(蝴蝶、螃蟹、蝙蝠)、3Drives、5-0、Batman、SHS、One2One、Camel、Triangles、WXY、Fibo 和 Vibrations。默认情况下,设置中仅启用 ABCD 和 Gartley 模式的显示。反向线允许定义固定相反顶点的时刻。提供了大量可定制的参数。 МetaТrader 5 版本: https://www.mql5.com/en/market/product/5195 描述可供 下载 的参数。

Trade in the opposite directions with HedgeTerminal HedgeTerminal is a full-featured trading terminal inside MetaTrader 5. This is a graphic panel resembling MetaTrader 4 terminal. It allows you to track oppositely directed positions in the manner it is possible in MetaTrader 4. In other words, we can open unlimited number of positions on a single symbol even if positions are in complete or partial hedge (lock). Thus, you can maintain long and short positions simultaneously, which is impossible
FREE

Introduction to Sideways Market Analyzer Notable period of Low volatility and non-trending movements in the financial market is considered as Sideways Market. Sooner or later, the low volatility will increase and the price will pick up a trend after Sideways Market. In terms of trading point of view, Sideways Market can serve as the very good entry timing for traders. Sideways Market is also quite often the representation of accumulation of large orders from big investors. Therefore, knowing the

Trade Controller provides multiple methods to protect and maximize your profits. This powerful weapon helps you to set the protect and trailing-stop rules on your trade automatically in many effective methods. Once it is set and turned on, you don't need to monitor your orders anymore, the software will keep watching and control your orders with your predefined rules. It's designed to support multi-protection and trailing strategy: Protect by break-even, protect by percentage, protect by pip, pr
Vates is a Latin word meaning a prophet. Vates is a multicurrency trend Expert Advisor that can run on any type real accounts, on any timeframe, with any initial deposit, with a fixed or varying lot size, with four and five-digit quotes, with brokers offering different order filling types. A distinctive feature of the EA is its stability and reliability. The results of Expert Advisor testing in the Strategy Tester in four modes (two main modes – normal and with a delay, and two additional modes

My Money Manager like a risk controller, which places your trades with the exact volume that meets your desired stop loss risk percentage. It can also help you to preview your EP/SL/TP levels before placing an order by dragging these levels directly on a chart, and keep reporting about them during the position opening. With this tool, you will feel more comfortable when deciding to open orders, as well as forecasting your profit/loss with your orders. Placing orders is a very precise and profess

This tool is designed to measure the distance between two points on a chart and much more.
List of measured values:
Distance in points Profit (with and without spread) Time difference Percentage price change Slope angle Number of bars (various variations) Ratio of distance in points to the reference value Features:
Snap to OHLC prices Automatic color profile setting based on chart background color Various types of pointers to choose from Display of values of selected points o

这是基于即时报价的剥头皮系统。它的基础是分析即时报价,而非柱线。本产品可在 4 和 5 位报价的平台上工作。重新报价是至关重要的。最小延迟执行的平台是必需的。 本 EA 不使用保存在数据库中的历史数据。它在线下载历史数据并创建它自己的数据库,保存在内部的内存里。重启之后, 数据库被删除并将会再次下载。通过 CountTick 参数管理内部内存的大小,并再开始工作时指定将有多少即时报价会写入数据库。所提到的数据库被用于长线分析。从长线数据库提取的信息设计为堆栈,用于短线分析和入场。换句话说, 本 EA 使用的来自堆栈的许多当前选择的即时报价,均接收自长线数据库的信息。 在下载了指定数据之后, 本 EA 开始由两个阶段构成的操作。在第一阶段期间, 下载的即时报价数据按照指定数量 (CountTick) 进行分析, 周期性则通过 ReOptimization 参数设置。本 EA 在工作时将会选择最佳的参数。换言之,最好的结果是通过穷举法搜索并选择的。由于没有太多的参数以供选择,这种方法是合理的。为进行搜索,三个内部参数被选择: 调整堆栈大小,从 1 至 CountSteck。 检查入场 (

Currency Power Meter 显示了主要货币对彼此的力量。该指标显示货币/对当前时刻在一段时间内的相对强度(每天,每周,每月)。它是日间交易,波段交易和适期期权头寸交易者有用。
货币的权力是市场走势的真正原因:对最弱货币最强的货币将结合成一个最趋势对。我们知道,趋势使得货币和所有的交易者喜欢趋势。 你 有没有问过自己,为什么有些行业似乎有一个良好的信号,但仍然会失败?原因是你只看到个别的信号在您喜欢的一双,但没有对所有的人,这是更好地做出决定货 币权力的忽视。因此,这一指标显示哪些货币是最强的,哪些是最薄弱的,因此最趋势对。它也让你知道哪些货币(因而对)是中性的,你应该避免进行交易了。 突出特点:
实时和主要货币的视觉存在对他人的权力。 每日,每周,每月:分析周期之间切换。 提示信息时,货币或对改变它的电源。 通知发送到移动和电子邮件时货币或对改变它的电源。 选择字号以适应你的屏幕分辨率。 注: 指标可能需要一段时间来分析和安排货币细胞在第一次加载新的时间表,所以请等待,直到它完成。
用户指南:
指标得出的主要
MetaTrader市场提供了一个方便,安全的购买MetaTrader平台应用程序的场所。直接从您的程序端免费下载EA交易和指标的试用版在测试策略中进行测试。
在不同模式下测试应用程序来监视性能和为您想要使用MQL5.community支付系统的产品进行付款。
您错过了交易机会:
- 免费交易应用程序
- 8,000+信号可供复制
- 探索金融市场的经济新闻
注册
登录