适用于MetaTrader 5的新EA交易和指标 - 140

本产品可以方便用户比较不同图表的K线,还可以方便地查看同一商品在不同时间周期中的K线形态。 将脚本附加到一个图表上,移动K线,或者改变显示比例,所有打开的图表上的K线将与当前的图表上的K线按照时间对齐,并且同步移动。
如果不同图表上的K线的周期不同,将会根据K线的起始时间进行对齐。 使用前请确保相关的历史数据已经下载到本地。 欢迎提出宝贵建议或意见,请与我联系。 —————————————————————————————————————————————————————————————————————————————————————— 。。。。。。。。。。。。。。。。。。。。。。。。。。。。。。。。。。。。。。。。。。。。。。。。。。。。。。。。。。。。。。
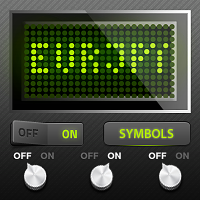
有的交易策略适合波动较小的、安静的行情,而有的策略适合波动较大、剧烈的行情。不管是哪种策略,交易者都应当对行情的冷热程度有清晰的量化标准。 本产品方便交易者对比不同交易品种的冷热程度,或者同一交易品种在不同时间段的交易热度。 你可以将它放在不同图表上,获得直观的感受。哪个品种热度更高,哪个交易更淡静,一目了然。 下方的颜色指示器显示瞬时的价格跳动情况,而左上角的数字显示的是一段时间内的温度累积均值。 。。。。。。。。。。。。。。。。。。。。。。。。。。。。。。。。。。。。。。。。。。。。。。。。。。。 .......................................................................................................
The script shows statistics of trades for the specified period. For example, if you want to know the details of trades of the ATC2010 Winner ( bobsley ): Login with his account using the investor (read-only) password (MetaTrader5); Open the chart of his trading symbol (EURUSD); Run this script on the chart; Specify 2010.10.1 in "date from", and the diagram will be shown.
Painting Deals on active chart. It allows analyzing trade history on an account to which you have an investor (read only) password. Type of the arrow displayed indicated the deal type: Right Arrow means In and In/Out deals Arrow Left Left means Out deals. Blue arrows are for Buy deals and Red arrows are for Sell deals. The indicator displays deals in the real time mode, it also displays their Stop Loss and Take Profit levels. Put the mouse over the arrows to see the details of deals including op

Script to Delete Pending Orders
Sometimes you placed many Pending Orders and then you want delete certain kind of these orders, this script can help you! Usage:
Download and drag and drop this script to the chart. Check "Allow AutoTrading" in "Common" tab and set input parameters in "Inputs" tab. Input Parameters: TypeOfPending: which type Order you would delete. mySymbol: which Symbol you would delete. The input format of the Symbol is such as "EURUSD" or "eurusd".

The script allows to easily watch the date and time of several cities selected by the user from more than 30 important cities all over the world. It also shows GMT, Server time and Local time. The cities on the screen are automatically sorted by the date and time. You can save your setting on the Inputs tab and use them in future. Notice: Daylight saving time is not considered.

The ColorLine indicator shows the line of the price moving average on the chart. The line has diffrent colors (100 bars have the same color). The color settings of the line is changing every 5 ticks, there are 3 color schemes. Indicator for demonstrating the DRAW_COLOR_LINE style. Draws a line at Close prices in colored pieces of 20 bars. The thickness, style and color of the line sections are changed randomly. The indicator code is published in the MQL5 Documentation in the section Indicator S
FREE

交易策略基于三条移动均线。判断趋势, 使用三条指数平滑移动均线: FastEMA, MediumEMA 和 SlowEMA。 交易信号: 买信号: FastEMA>MediumEMA>SlowEMA (向上趋势)。 卖信号: FastEMA<MediumEMA<SlowEMA (向下趋势)。 输入参数:
Inp_Signal_ThreeEMA_FastPeriod = 8; Inp_Signal_ThreeEMA_MediumPeriod = 38; Inp_Signal_ThreeEMA_SlowPeriod = 48; Inp_Signal_ThreeEMA_StopLoss = 400; Inp_Signal_ThreeEMA_TakeProfit = 900; Inp_Money_FixLot_Percent = 10.0; Inp_Money_FixLot_Lots = 0.1;
FREE

该系统的思路是通过计算复合蜡烛来识别反转形态。 反转形态类似日本蜡烛条分析的 "锤头" 和 "吊颈" 形态。但它使用符合蜡烛替代单一的蜡烛,并且不需要复合蜡烛的小实体来确认反转。 输入参数: Range - 最大柱线数量, 计算复合蜡烛时用。 Minimum - 最小复合蜡烛大小 (传统的点数)。 ShadowBig and ShadowSmall - 影线 (复合蜡烛单元)。 Limit, StopLoss and TakeProfit - 开盘价, 止损位和止盈位, 它们是相对于复合蜡烛的收盘价 (复合蜡烛单元)。 Expiration - 订单过期时间 (单位柱线), 用于挂单 (Limit!=0.0)。 反向蜡烛条形态的判别如下。 它计算复合蜡烛参数,其自最后的完整柱线 (索引为 1) 至由 Range 输入参数定义的柱线数量。如果复合蜡烛大小大于由 Minimum 输入参数指定的数值, 它分析复合蜡烛的影线检测反转条件。 空头能量的特征是复合蜡烛的上影线为零, 多头能量的特征是复合蜡烛的下影线为零。 为确认空头趋势反转 (且多头开始),需要以下检查: 下影线的大小 (多头能量
FREE

策略基于价格与均线指标交叉, 并以 ADX 指标确认。 交易信号: 买: 最后完成的柱线收盘价高于均线, 当前以及最后完成的柱线所对应的均线在增长。 卖: 最后完成的柱线收盘价低于均线, 当前以及最后完成的柱线所对应的均线在降低。 出于过滤假信号,使用移动方向指数 (DI+ 和 DI-) 来检查趋势能量 (ADX>ADXmin) 和趋势方向。 输入参数: Inp_Signal_ADX_MA_PeriodADX = 48; Inp_Signal_ADX_MA_MinimumADX = 13.0; Inp_Signal_ADX_MA_PeriodMA = 50; Inp_Signal_ADX_MA_StopLoss = 400; Inp_Signal_ADX_MA_TakeProfit = 900; Inp_Money_FixLot_Percent = 10.0; Inp_Money_FixLot_Lots = 0.1.
FREE

基于鳄鱼技术指标的策略, 由 Bill Williams 在 "Trading Chaos - 混沌交易" 中描述。 系统基于三条移动均线 (唇线, 牙线和下颌线), 以及振荡器, 计算它们之间的差别。交易信号在鳄鱼线交叉之后生成,依据趋势,通过这些线确定交易。在上涨趋势中,唇线 (最小周期) 最高, 之后是牙线, 最低是下颌线。与此类似,但在下跌趋势中,情况相反。 交易信号: 开多头仓位: 上升趋势中,鳄鱼线交叉,且线间距离在拉开; 平多头仓位: 下颌线上穿唇线; 开空头仓位: 下跌趋势中,鳄鱼线交叉,且线间距离在拉开; 平空头仓位: 下颌线下穿唇线; 输入参数:
Inp_Signal_Alligator_JawPeriod = 33; Inp_Signal_Alligator_JawShift = 8; Inp_Signal_Alligator_TeethPeriod = 28; Inp_Signal_Alligator_TeethShift = 5; Inp_Signal_Alligator_LipsPeriod = 15; Inp_Signal_Alligator_Lip
FREE

Chaikin 的波动指标计算最大和最小价格之间的价差。它基于最大和最小之间的幅度来判断波动性。不像 平均真实范围 , Chaikin 的指标没有将跳空考虑在内。 根据 Chaikin 的解释, 在相对较短的时间里交易量增长, 意味着价格即将抵达最低点 (就像证券的恐慌性抛盘), 而在较长的时间周期里波动降低, 意味着价格处于峰值 (比如, 在成熟的牛市条件下)。
FREE


The script SphereSample.mq5 illustrates control of graphic objects using the classes from the Standard Library (Base class of objects array CArrayObj , CChartObjectText ).
FREE

The script illustrates the usage of the OBJPROP_XOFFSET and OBJPROP_YOFFSET properties. It displays the specified fragment of the .BMP image.
FREE

The ColorBars Indicator paints bars with different colors depending on the volume changes. If the volume has increased, the color is green, overwise the color is red.
FREE
The script ObjChartSample.mql5 illustrates control of chart properties using the classes from the Standard Library .
FREE
您知道为什么MetaTrader市场是出售交易策略和技术指标的最佳场所吗?不需要广告或软件保护,没有支付的麻烦。一切都在MetaTrader市场提供。