适用于MetaTrader 5的新EA交易和指标 - 106

Stairway to heaven It is an advanced trading system. This is a fully automatic Expert Advisor. ONLY TWO INPUT TO SELECT FOR THE TRADER 20 YEARS BT IN DIFERENT PAIRS Stairway to heaven . It is a 100% automatic system, the system controls both the inputs and the batches, the operator just has to place the robot on the graph and let it act It is an ideal system for people who do not want complications or strange configurations. The system is self-sufficient, performing all the work.

Quark "Old Style Guy!" The Expert Advisor is designed for use on any currency pair, but by default, it can be used on EURUSD in the H1 timeframe and is ready for immediate deployment. Please note that the latest update does not include preset files, and as a result, the behavior of old sets(comment sections) within this version may be uncertain. The robot is configured with a micro lot size for each individual position by default. To manage your risk level, you can activate the Money Management

Display the date, time and price according to the movement of the mouse cursor on the chart This is useful for discretionary trading.
It is an indispensable tool for verifying and studying past market prices and trades. Characteristic Date,Time and Price are displayed.
The value follows the movement of the mouse.
You can change the color of the text. Please refer to the video on youtube. For MT5 only.
FREE
At its most basic, the "Average Directional Movement Index Wilder" (ADXW) can be used to determine if a security/index/currencie is trending or not. This determination helps traders choose between a trend-following system or a non-trend-following system. Wilder suggests that a strong trend is present when ADXW is above 25 and no trend is present when ADXW is below 20. There appears to be a gray zone between 20 and 25. ADXW also has a fair amount of lag because of all the smoothing techniques. Ma

CopierTrader is an easy-to-use and reliable position copier for the MetaTrader 5 account hedging system.This expert Advisor allows you to copy trades from multiple terminals (master) to a single terminal (slave).
When writing this adviser, the idea of quickly copying positions was implemented, i.e. the adviser sends requests to the server as quickly as possible. If it is impossible to quickly accept requests for trading operations by your broker, the adviser not only resends the rejected requ

Make csv for Deep learning data. This sript use on Strategy Tester. (If you like it, please buy it) Output file to [ C:\Users\<user name>\AppData\Roaming\MetaQuotes\Tester\***AppId***\Agent-*\MQL5\FIles\ ] (sry, depending on the environment)
ItemName description MaPeriod Base MovingAverage period. PredictPeriod ex) BarTime1h, PredictPeriod=30 -> predict price after 30 hours. InputRange ex) InputRange=24 -> Get price from 24 hours ago to the present. file example: https://gist.github.com

Бинарный индикатор находит свечной паттерн "Поглощение" и рисует соответствующий сигнал для входа рынок. Имеет встроенные фильтры и панель для просчета количества успешных сделок. Демо версия является ознакомительной, в ней нет возможности изменять параметры. Полная версия . Особенности Работает для всех валютных пар и любых таймфреймов. Индикатор рассматривает комбинацию из 2-х или 3-х свечей в зависимости от настроек. Имеется возможность фильтровать сигналы путем настройки количества свеч
FREE
Горячие клавиши плюс клик левой кнопки мыши на графике.
Советник открывает сделки, выставляет лимитные и стоповые ордера, удаляет ордера и закрывает позиции, также делает реверс открытых позиций, выставляет прописанные в настройках стоп лосс и тейк профит.
(реверс только на неттинговых счетах)
При запуске советника можно посмотреть подсказку как действует советник при нажатии клавиши + клик на графике.
Правее последнего бара, ниже цены Ctrl+ЛКМ - OpenSell
Правее последнего бар
FREE

Hurst Fractal Index Фрактальный Индекс Херста - показатель персистентности временного ряда При значении индикатора >0.5 временной ряд считается персистентным (тенденция сохраняется) При значениях индикатора явно < 0.5 временной ряд считается антиперсистентным (возможна смена направления движения) Для наглядности значения индекса усредняются периодом 2-3. Настройки индикатора: Max Bars - глубина истории расчета (кол-во баров на графике для которых произведён расчет) Data from Timeframe - исполь

Robô Animus. Animus é um robô para day trade em mini índice Bovespa. Sua estratégia funciona exclusivamente no ativo WIN, apresentando uma ótima sequência de ganhos com suas duas operações diárias. - Negociação no ativo Mini Índice (WIN) na BM&F BOVESPA; - Operações 100% day trade; - O robô vai completamente configurado com os parâmetros da estratégia, pronto para realizar as operações diárias.
ATENÇÃO: Tipo de conta: [x] Netting, [ ] Hedge. Ativar o horário de funcionamento nos "Parâmetros d

Fibonacci fast drawing tool with 4 outstanding features 1. Quick action by clicking on the candle 2. Draw the bottom of the selection exactly 3. Include Standard Fibo levels and display prices at levels 4. Draw extended fibo to identify the price zone after break out Please see video clip below for more details. Free download link of FiboCandleClick indicator inside youtube.

FibTracer is an interactive Fibonacci tool that is aim to improve and facilitate your Fibonacci trading style. This Indicator can generate Fibonacci Retracement levels in two different ways. You can select whether to draw Fibonacci Retracement levels based on you favourite ZigZag settings or you can let the indicator to draw Fibonacci Retracement level based on given number of periods. You can also set Mobile and Email notification for your favourite Retracement levels individually. With this i

This Indicator draws Fibonacci Extension levels in two different ways. You can select whether to draw Fibonacci Extension levels based on your favourite ZigZag settings or you can let the indicator to draw Fibonacci Extension level based on given number of Bars or Candles. You can also set Mobile and Email notification for your favourite Extension levels individually. With this indicator you will not have to feel lonely as the it can generate Voice alerts, which will keep you focused on your
This utility tool shows the intraday price variation as a percentage. It just works on any symbol and timeframe. Inputs: Font Size: You can change the font size of the price variation. Defaults to 15. Corner Location: You can choose between "Left upper chart corner", "Left lower chart corner", "Right upper chart corner", "Right lower chart corner" to show the information.

Indicador Para Opções Binarias. Indicator for Binary Options Usa dois gales. Instalar em mt5 Esse indicador é para ser usado no tempo de vela de 5 minutos e em M5. Este também funciona em M1, porém é mais eficiente em M5. Só descompactar e copiar os arquivos na pasta de dados do seu MT5. Arquivos indicator na pasta MQL5 - Indicator. Baixe também a Media Movel totalmente gratis:
https://www.mql5.com/pt/market/product/50400
Esse Indicador é para a próxima vela. Apareceu a seta, só aguardar a pr

The indicator displays 05 important parameters for traders 1. Display Bid -ASK price in big font 2. Display currency pair name and large time frame 3. TradeTick parameters 4. Swaplong and SwapShort 5. Point parameters used to calculate the price of SL or TP Indicators include 02 files supporting MT4 and MT5, You can download the link below. And follow the instructions of the video.

Hello!
My name is Daniel and I started developing a robot that followa the trends during the opening of the markets: NYSE, LSE etc.
The first minutes determine market trend. Current version: 1.1 At the moment it is only applicable on EUR/USD pair. DS - Robot v1 is very simple to use: Inputs: Fixed_volume - specify whether you want the transaction volume to depend on account resources. Volume - if Fixed_volume = true -> the transaction volume will always be constant if Fixed_volume = fal
***Please Give Some Feedback and Reviews*** This is an indicator which shows the direction and the strength of the selected Symbol based on the two outputs, Signal and Value. The Signal indicates the directions as Buy equals 2(Blue) and Sell equals 1(Red). The Value output indicates the strength of the signal between -100 to 100. This indicator is both trend and fast preliminary indicator by choosing appropriate parameters. Indicator uses the Normalized ADX value as the hitting catalyst, which

VR模板切换器是一个强大的工具,用于管理MetaTrader终端中的图表模板。你不再需要做很多事情来下载、保存和删除模板。 VR模板切换工具允许你保存当前的图表模板,包括所有指标、水平和设置,并一键加载另一个模板。 你们有针对不同金融工具的模板吗?VR模板切换器将在加载模板时设置所需的周期和金融工具。 VR模板切换器配备了额外的功能。 自动保存图形模板 备份模板的能力 能够与你的个人电脑上的其他MetaTrader终端同步图表模板 如果你改变了图表模板,你不仅可以下载新模板,还可以立即改变图表周期和金融工具。 该工具保存了带有所有设置、指标和布局的模板。当模板被加载时,一切都将被恢复。 这意味着,如果保存了一个带有绿色VR模板切换器的图形模板,那么在加载这个图形时,VR模板切换器将是绿色的。 MetaTrader 5的版本有更多的功能 键盘上的热键 在设定的时间间隔内自动改变时间表模式 来自作者的信息。 我写VR模板切换器是因为我想简化图表模板的工作,我需要在不同的终端使用相同的图表模板,同时保留之前所有的工作。 版本: MetaTrader 4 博客上的更多信息 跳转 您的反馈是最好
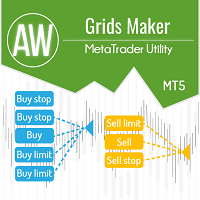
AW Grids Maker is used to build grids from pending orders. The utility is universal, has flexible settings and an intuitive panel interface. The program builds networks from STOP and LIMIT orders with the necessary step, uses the position volume multiplier.
MT4 version -> HERE / Problem solving -> HERE
Benefits: Uses pending orders of all types. Simple and flexible setup. Well-designed and multi-functional utility panel. Thoughtful information module
Features of work:
Suitable
由專業交易者為交易者開發的平靜網格顧問。它適用於市場訂單,第一筆交易在劇烈波動時開啟。具有最短持倉時間和新訂單開倉最小間隔(秒)功能。它可以與任何經紀商合作,包括有 FIFO 要求的美國經紀商——首先,關閉之前打開的交易。訂單由單向一籃子訂單關閉。要平倉,可以使用止損、止盈、盈虧平衡和追踪止損功能。交易統計數據顯示在圖表上。
MT4 版本 - https://www.mql5.com/en/market/product/49569
選項: LANGUAGE - 選擇顯示信息的語言; MAGIC_NUMBER - 幻數; ORDERS_COMMENT - 訂單中的顧問評論; MAX_SLIPPAGE - 最大滑點; MAX_SPREAD - 開啟交易時的最大點差; COMMISSION_CONTROL - 如果經紀人每筆交易都有佣金,則設置 COMMISSION_CONTROL = true 標誌; COMMISSION_PER_LOT - 作為 1 手的佣金; DISTANCE - 價格在 N 秒內必須移動的距離; TIMER - 以秒為單位的計時器; MIN_INTERVA
BW Dance - Bill Williams Trading Chaos Signal MTF Indicator for MetaTrader 5
!!! This indicator is not a trading system !!!
This is only a convenient tool for receiving signals of the Bill Williams trading system in visual and sound mode - Signals are not redrawn/ not repainting
The main idea of the indicator:
display current signals of the BW system on the right edge of the chart, according to the principle HERE and NOW output signals in three ways:
next to the price scale unde
用於Meta Trader 5平台的Fx Pulsar是專業專家,您可以每年賺≈100%的利潤! 長期以來取得了豐碩的成果!
主要特徵: 該專家非常適合歐元/美元(可能有其他相關貨幣對) 專家會完全自動工作(我們建議使用VPS) 專家具有內置功能,可通過隨機振盪器計算信號(無需指示器) 專家在工作中使用了ting(可禁用,請參見下面的說明) 專家使用的最小手數為0.01(設置更改) 為了安全交易,建議的最低存款為1000美元(或等值的存款貨幣) 最佳時間範圍為1分鐘(所有時間範圍均可用)
設置: 歐元/美元以下的優化 1. Initial volume. 0.01 standard lot for every 1000 USD is calculated 此選項使您可以設置初始手數。 為了安全操作,我們建議您根據以下方案之一應用以下計算: 每1000 USD為0.01標準手,槓桿為1:100。 當將下一階的“音量倍增”設置為4時,此音量是最佳的 每1000美元0.02標準手,槓桿1:100。 當將下一階的“音量倍增”設置為最大2.5-3時,此音量是最佳的 每1000 US
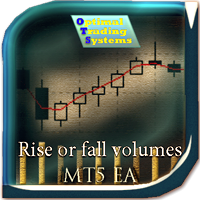
A trader cannot always discover what the last closed bar is by volume. This EA, analyzing all volumes inside this bar, can more accurately predict the behavior of large players in the market. In the settings, you can make different ways to determine the volume for growth, or for falling. This adviser can not only trade, but also visually display what volumes were inside the bar (for buying or selling). In addition, it has enough settings so that you can optimize the parameters for almost any ac

Multi currency and multi timeframe scanner. Scans all instruments in "market watch" and gives either pc-alert or push-notification to the phone on a breakout. A breakout is by default defined as when a candle becomes longer than three ATR with a period of 300.
If you have the need for a custom buildt scanner, to scan for your particular setup. Please add a personal jobb under the Freelance section.
Functionality
Has spread filter , to not open stupid mega spread crypto currency charts. Has
FREE

Média Móvel que possui todos tipos de Cálculo comum: Simples Exponencial Suavizada Ponderada Conta com suporte para aplicação sob outros indicadores!
Seu principal diferencial é o esquema de cores em GRADIENTE que, de acordo com a mudança no ângulo da média, altera suas cores conforme demonstrado nas imagens abaixo. Com isso, espera-se que o usuário tenha uma percepção mais suavizada das pequenas alterações.
Bons trades!!
FREE

Это специальная утилита, для подключения внешнего индикатора к торговой панели . Она позволяет получать данные из буфера индикатора и рисует стрелочные объекты для передачи их в торговую панель. Входные параметры
Number of call buffer - номер индикатора для покупки Number of sell buffer -номер индикатора для продажи Indicator window - окно индикатора Indicator position in list - позиция индикатора в списке Default value of indicator - значения по умолчанию для индикатора Show information - пока
FREE

LinLit mq5 USDJPY is fully automated EA. The input parameters are optimized for USDJPY- M15 time frame We use, Stochastic and Money Flow Index indicators EA NOT use Martingale, GRID, Averaging and other dangerous strategies! Full compliance with the FIFO method! Recommendations EA Settings : Use default settings. Symbol : USDJPY. Time Frame : M15. Brokers : ECN brokers, low spread/commission, 1:400 leverage Minimum Deposit : $200 USD.
Parameters Entry lot size : Initial lot size Stop Loss

LinLit mq5 EURJPY is fully automated EA. The input parameters are optimized for EURJPY - M15 time frame We use Moving Averages Crossover, Moving Average and Money Flow Index indicators EA NOT use Martingale, GRID, Averaging and other dangerous strategies! Full compliance with the FIFO method! Recommendations EA Settings : Use default settings. Symbol : EURJPY. Time Frame : M15. Brokers : ECN brokers, low spread/commission, 1:400 leverage Minimum Deposit : $200 USD.
Parameters Entry lot si

Main purpose: This indicator calculates the average of previous candles (a half of candle points). This value represent the strength of market (buy/sell) in each candle.
Parameters: . Period: indicating previous candles to calculate average . Shift: draw line at a shift on chart.
Tip: We can use this value to consider TP and SL of a position before opening.
FREE

Stochastic Reversal allows you to recognize reversals professionally. Stochastic Indicator: This technical indicator was developed by George Lane more than 50 years ago. The reason why this indicator survived for so many years is because it continues to show consistent signals even in these current times. The Stochastic indicator is a momentum indicator that shows you how strong or weak the current trend is. It helps you identify overbought and oversold market conditions within a trend. Rules

Open time indicator 4 Major sessions. 1. Sydney is open 0h - 9h (GMT + 3) 4h - 13h (VN - GMT + 7) 2. Tokyo is open 3h - 12h (GMT + 3) 7h - 16h (VN - GMT + 7) 3. Lodon is open 10h - 19h (GMT + 3) 14h - 23h (VN - GMT + 7) 4. Newyork is open 15h - 24h (GMT + 3) 19h - 4h (VN - GMT + 7) Link download indicator KIDsEA Session Please come to my youtube for free download, please feel free for like and subscribe for my channel.

Горячие клавиши плюс клик левой кнопки мыши на графике. Советник открывает сделки, выставляет лимитные и стоповые ордера, удаляет ордера и закрывает позиции, также делает реверс открытых позиций, выставляет прописанные в настройках стоп лосс и тейк профит. (реверс только на неттинговых счетах) При запуске советника можно посмотреть подсказку как действует советник при нажатии клавиши + клик на графике.
Правее последнего бара, ниже цены Ctrl+ЛКМ - OpenSell Правее последнего бара, выше цены

***** IMPORTANT NOTE: DO NOT FORGET TO DETERMINE THE MAIN TREND DURING THE TEST. FOR AN UPWARD TREND MAKE "TRADE LONG: TRUE" AND "TRADE SHORT: FALSE" FOR A DOWNWARD TREND MAKE "TRADE LONG: FALSE" AND "TRADE SHORT: TRUE" AND FOR A HORIZONTAL BAND MAKE "TRADE LONG: TRUE" AND "TRADE SHORT: TRUE" IN THE SETTINGS. YOU CAN ALSO CHOOSE THE LONG TRADE, SHORT TRADE OR BOTH WAY IN REAL ACCOUNT BY THE HELP OF THE BUTTONS ON YOUR GRAPH IN ANY TIME. ***** "Statistics are like mini-skirts. They give yo
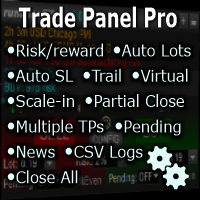
Fully functional manual trade panel with lot size calculation, one-click trading, hidden (virtual) stop loss/take profit and pending orders, scale in and out of trades (partial close), auto SL/TP and more. Works with all symbols not just currency pairs. Brings an incredible amount of functionality to MetaTrader for free and for both demo and live accounts. Features Lot size calculation - based on % of account to risk, fixed amount or dynamic lots Automatic take profit based on risk reward ratio
FREE
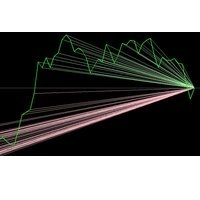
该指标为价格方向提供了非常卖出和成功的标记,它将为您提供最新价格水平的价值,使您能够预测下一个价格走势
对于此免费版本,您只能使用BTCJPY,正在建设中的完整版本
我们建议您在买/卖价值大于卖/买价值的两倍时进行买卖
让我们举个例子:
如果值是买入:45,卖出:55,则不要进入市场
如果值是买入:90,卖出:10,那么这是进入牛市的机会(开立买入交易) _______________________________________________________________________________________________________________________________
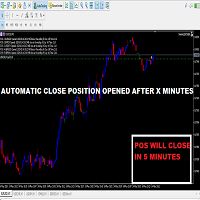
这个小工具可让您以分钟为单位定义一个计时器
根据您设定的分钟数平仓
例如,如果将其设置为30分钟,则该工具会在打开30分钟后关闭每个打开位置。
设定
活动:这是激活工具并在定义的分钟数后使用它来平仓。
管理:您可以选择工具管理的符号。
如果您希望系统将其应用于帐户中的所有未平仓头寸,请选择“所有货币”
选择“仅此货币”以仅在当前货币上应用头寸的暂时平仓。
分钟持续时间交易:选择交易持续时间的分钟数。
时区:
定义您的时区。
如果您默认为0
这个小工具可让您以分钟为单位定义一个计时器
根据您设定的分钟数平仓
例如,如果将其设置为30分钟,则该工具会在打开30分钟后关闭每个打开位置。
设定
活动:这是激活工具并在定义的分钟数后使用它来平仓。
管理:您可以选择工具管理的符号。
如果您希望系统将其应用于帐户中的所有未平仓头寸,请选择“所有货币”
选择“仅此货币”以仅在当前货币上应用头寸的暂时平仓。
分钟持续时间交易:选择交易持续时间的分钟
FREE

注意:外 汇交易员 “ 获得一个图表指标,它将使您在市场上交易时赚更多的钱 …… 。 ” 是 ! 我已 经准备好赚更多的钱,简化交易,并且对实时的市场状况有一个轻松的了解! 面 对现实吧,在外汇交易平台上交易似乎很复杂,压力很大,很困惑!如果没有正确的系统和指标指 南, 图表可能会变得压倒性和混乱。当您想知道是否会因为市场分析不正确而再次被市场灼伤时,消除您的胃部结痛感。 那 “ 交易者区 ” 呢?每个交易者都可以 轻易陷入的一个陷阱,就是在大赢或大输之后,令人恐惧的 “ 交易者区 ” 。您将能 够在大获胜之后复制同样的成功,或者在大亏损之后陷入另一个财务陷阱?出色的钓鱼指示器指南可帮助避免此问题,并减轻压力和焦虑。 “ 呈 现最终的外汇直观技术指标 ” 简单易用的颜色指示器!市场上的其他指标因 BIG“ 学 习曲线 ” 而 变得复杂,难以使用和理解。我们的指标使用简单,带有清晰的颜色指标,可帮助您快 速有效地了解市 场状况。我们计划的关键是简单性和有效性。 钓鱼指标开始使用颜色编码的指标来计算市场方向的波动。它学习并分析市场趋势,并显示运动之间的距离和距离
The EA uses 3 strategies: 1 - a strategy for breaking through important levels, 2-a strategy for reversing, and 3 - trading on a trend. To open a position, the expert Advisor evaluates the situation on the charts using 5 custom indicators. The EA also uses averaging elements in the form of several additional orders ( the EA does not increase the lot for averaging orders). The EA uses 8 adaptive functions for modifying and partially closing orders. Hidden Stop loss, Take Profit, Break Even and Tr

The WT Vwap Bands indicator is an indicator that combines price and volume, helping to show whether the price is within the "fair price", overbought or oversold.
The indicator code was designed for performance and has already been tested in a real trading account.
In addition to the visual inputs (color, thickness and line style), the user can define a% value that depends on the price.
The default values work with the most distant band at 1% of the price and then dividing this distan
Some candles have a strong tendency to continue the movement, or its turn. Using the Colored candles and patterns indicator, such candles are clearly visible. This indicator calculates the parameters of each candle, as well as its volume, and after that it colors the candles depending on its strength and direction. Bullish candles turn green and bearish candles turn red. The greater the strength of the bulls or bears, the brighter the color. If desired, the colors can be changed. In addition, t

趨勢指示器,在圖表上繪製2條不同顏色的條。一個車道換到另一個車道意味著市場在相反的方向反轉。指標還在圖表上放置了3條平行的虛線高,中,低線,分別顯示了成形反轉的頂部,中間,底部。
參量 深度 - 指標計算的深度,參數越高,信號越長 ; 偏差 - 繪圖期間指標的偏差 ; 後退步 - 轉向顯示的強度越小,強度越大 .
___________________________________________________________________________________________________________________________
* 交易策略 . - 繪製上升線時,這是一個買入信號 ; - 繪製下降趨勢時,這是賣出信號 .
Elite SR - Advanced Level Indicator for automatic detection of support and resistance levels with different degree of credibility should become a part of your trading arsenal. This indicator is accessible via iCustom function and provides level values as well as their degree of credibility. Elite SR is fully adjustable and can work on any time-frame with any trading instrument!
Important information For all detailed information about this indicator you can visit 747Developments website.
Feat

Este indicador traça uma reta baseada em regressão linear, esta reta é dinâmica e é atualizada a cada tick. O cálculo de regressão linear é feito considerando o número de candles definido pelo tamanho da janela fornecida pelo usuário. São traçadas duas linhas, uma superior e uma inferior, para guiar a estratégia do usuário, a distância dessas linhas para a linha central deve ser configurada. É possível definir os estilos, cores e espessuras de cada uma das linhas.
Esse indicador foi inicialm
FREE

JUPITER it is a Secure Automated Software for trade Forex market and indices.
The architecture is a Fully Automatic Autonomous Robot Expert capable of
Independently analyzing the market and making trading decisions
JUPITER It is an advanced trading system. This is a fully automatic Expert Advisor.
JUPITER . It is a 100% automatic system, The system is self-sufficient, performing all the work. Is a revolution in the customization of the trading. You can download t

VolumeFlow is a Volume Accumulation / Distribution tracking indicator. It works in a similar way to OBV, but it is much more refined and includes the options to use: Classical Approach = OBV; Useful Volume Approach; Gail Mercer's approach; Input Parameters: Input Parameters: Approach Type: Explained above; Volume Type: Real or Ticks; Recommendations: Remember: The TOPs or BOTTONS left by the indicator are good Trade Location points. This is because the players who were "stuck" in these regions w
FREE

Special Channel channel indicator is a classic indicator of a family of channel indicators, the use of which allows the trader to respond in time to the price out of the channel set for it. This corridor is built on the basis of the analysis of several candles, starting from the last, as a result of which the extrema of the studied interval are determined. It is they who create the channel lines.
Trading in the channel is one of the most popular Forex strategies; its simplicity allows even be

Classic RSL This is the classic indicator "Relative Strength Levy" (RSL), according to Dr. Robert Levy's study, called "The Relative Strength Concept of Common Stock Pricing", which was released as a hardcover book in late 60's of the last century.
Key concept Use this indicator on various instruments to compare their relative strength: The resulting analysis values will fluctuate around 1 The strongest instruments will have the highest RSL values (above 1) and the weakest instruments

Trend Factor is an indicator based on the calculation of price values to answer questions about what direction the trend is acting on the market at the moment and when this trend will end.
By launching the Trend Factor indicator, the user will see two lines and bars of different colors, which can change color to green during an uptrend, to red during a downtrend or to be yellow during an uncertainty.
The trader uses the Trend Factor indicator to determine the market situation. This is a t

With it, you leave pre-configured two expansion settings and one fibo retraction configuration to use via keyboard shortcut and mouse click.
That is, the Fibo_Z utility facilitates the use of MT5's native functions.
The shortcut keys are:
"Z" configuration 1 of the expansion.
"X" expansion setting 2
"Z" retraction configuration.
"V" clears objects from the screen.
It is.
Success and good trades!

Are you accidently making mistakes with your stoplosses, you thought you were risking 5% but you actually risked 15%? Are you causing yourself unncessary drawdowns by moving the sl too many times? Don't worry this ea has your back, it lies in the background and always watches your risk. No matter how many orders you have open in both directions it will make sure you stop out at your set risk percent. It also removes all stoplosses and targets in the case of a full hedge situation.
The same as R
Get all the moving averages in one indicator. Simple moving average, Exponential moving average, Smoothed moving average, Linear weighted moving average, Double Exponential Moving Average, Triple Exponential Moving Average, T3 Moving Average and MORE. Find in the comments a Free Expert Advisor that uses the XPMA . It will show you how easy to make an EA based on the XPMA (XP MOVING AVERAGE). Settings: Moving Average Type: The Moving Average Type. It can be one of these types: SMA (Simple Moving

I present to you an indicator for manual trading on DeMark's trend lines. All significant levels, as well as the indicator signals are stored in the buffers of the indicator, which opens the possibility for full automation of the system. Bars for calculate (0 = unlimited) - Number of bars to search for points DeMark range (bars) - Shoulder size to determine point
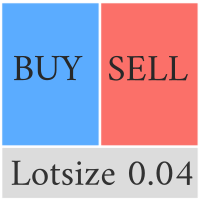
Compliement your normal MT5 Buy/Sell panel with this automatic lot size panel. This product is free without any limitations. There will be a pro verision later with additional functionality, but my motto is to always have awesome free products. It automatically places the stop and sizes the lot according to the given ATR for risk. You have to try it to experience it!
Now I can't trade manually without it.
It's turned out to be much more intuitive than I would think before creating it.
The
FREE

The Stepper indicator generates Signals in strong Trend zones. Even when the Trend is set, we must filter when to ENTER or HOLD the trigger. The Trend is represented by two lines: Trend UP and Trend DOWN. W e are in a Bullish trend when the Trend UP (Green line) is above. And in a Bearish trend when the Trend DOWN (Pink line) is above.
When the momentum is aligned with the Trend , this indicator generates: BUY signals (LIME line) SELL signals (RED line) The user is alerted of the scenario, at

Hi Friends! this is countdown candles with 4 functions. 1. Countdown current Candles 2. Countdown H1 timeframe. 3. Countdown H4 timeframe. 4. show the spread index and the lowest spread value within 5 minutes. Instructions for installing and downloading this indicator in the link below. https://www.youtube.com/watch?v=fi8N84epuDw
Wish you have a happy and successful day.
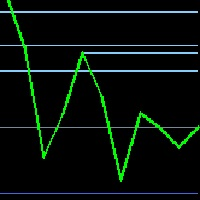
Resistance and Support levels is one of the most important factors when you enter the market This indicator will automatically draw all resistance and support for last x (you can insert the x value as you like) resistances and supports You should trade between those lines and put your stop loss behind this line (if you in sell then your stop line should be above this line, and opposite for buy) Also your take profit should be upon those lines So you should trade between support and resistance

该多时间框架和多交易品种指标可识别随机指标信号线何时穿过随机指标主线。作为替代方案,它还可以在随机指标离开(没有信号线穿过主线)超买/超卖区域时发出警报。作为奖励,它还可以扫描布林带和 RSI 超买/超卖交叉。结合您自己的规则和技术,该指标将允许您创建(或增强)您自己的强大系统。 特征 可以同时监控市场报价窗口中可见的所有交易品种。仅将指标应用于一张图表即可立即监控整个市场。 可以监控从 M1 到 MN 的每个时间范围,并在识别出交叉时向您发送实时警报。支持所有 Metatrader 本机警报类型。 该指示器包括一个交互式面板。请参阅单独的屏幕截图以获取解释。 指标可以将信号写入文本文件 或全局变量 专家顾问 (EA) 可以使用它 进行自动交易。比如 这个产品 。 输入参数
输入参数的描述和解释可以 在这里 找到 。 重要的
请注意,由于多功能性,安装指标的图表上不会绘制买入和卖出建议,也不会绘制线条和箭头。相反,这些对象将绘制在单击图表面板中的信号时打开的图表上。 强烈建议将指标放在干净(空)的图表上,上面不要有任何其他可能干扰扫描仪的指标或 EA 交易。

Currency Strength Meter is the easiest way to identify strong and weak currencies. This indicator shows the relative strength of 8 major currencies + Gold: AUD, CAD, CHF, EUR, GBP, JPY, NZD, USD, XAU. Gold symbol can be changed to other symbols like XAG, XAU etc.
By default the strength value is normalised to the range from 0 to 100 for RSI algorithm: The value above 60 means strong currency; The value below 40 means weak currency;
This indicator needs the history data of all 28 major curre

Currency Strength Meter is the easiest way to identify strong and weak currencies. This indicator shows the relative strength of 8 major currencies + Gold: AUD, CAD, CHF, EUR, GBP, JPY, NZD, USD, XAU. Gold symbol can be changed to other symbols like XAG, XAU etc. By default the strength value is normalised to the range from 0 to 100 for RSI algorithm: The value above 60 means strong currency; The value below 40 means weak currency;
This indicator needs the history data of all 28 major currenc

Currency Strength Meter is the easiest way to identify strong and weak currencies. This indicator shows the relative strength of 8 major currencies + Gold: AUD, CAD, CHF, EUR, GBP, JPY, NZD, USD, XAU. Gold symbol can be changed to other symbols like XAG, XAU etc.
By default the strength value is normalised to the range from 0 to 100 for RSI algorithm: The value above 60 means strong currency; The value below 40 means weak currency;
This indicator needs the history data of all 28 major curre
The work of the utility is directed at opening new market orders, maintaining them, transferring the unprofitable orders into profit using an internal loss handling algorithm, trend filtering and various types of trailing stop and take profit. Suitable for any instruments and timeframes. The algorithm works separately for buys and sells, which allows simultaneously working in both directions as well. For the event when the additional orders opened by the utility do not become profitable, a Stop
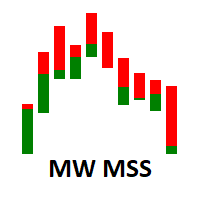
The Martinware Market Sides' Strength indicator shows the candlestick chart in a different manner allowing for a clearer view of which side, bullish or bearish is dominating the asset in the current period. As a bonus, it can also show an internal area that can be used to visualize two levels of Fibonacci retracements inside the bars.
The default configuration shows the MSS bars with 4 main colors, two representing the bullish force, and two representing the bearish one. The primary colors a

The Regression indicator shows the direction of the trend. The graph shows up to 3 regression lines with different time periods. The straight line is built as the average inside the wave channel of the price movement (shown on one ScreenShot).
In this case, you can disable any of the lines. Also, the indicator allows you to change the color for each line. It is interesting to calculate the relative angle in degrees. The angle display can also be turned off.
Thanks to this indicator, you can

The indicator draws support and resistance lines on an important part of the chart for making decisions. After the trend line appears, you can trade for a breakout or rebound from it, as well as place orders near it. Outdated trend lines are deleted automatically. Thus, we always deal with the most up-to-date lines. The indicator is not redrawn .
Settings:
Size_History - the size of the calculated history. Num_Candles_extremum - the number of candles on each side of the extremum. Type_Ar
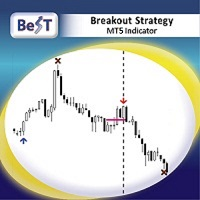
BeST_Breakout Strategy MT5 is an Metatrader Indicator based on a proprietary algorithm implementing a very powerful tool that can exploit every breakout leading to huge market movements.It timely locates the most likely points for Entering the Market as well as the most suitable Exit points and can be used successfully as a standalone Trading System which performance is often accompanied by very impressive statistics of % Success Ratio and Profit Factor . The BeST_Breakout Strategy is a non-rep
Chart Slice is a very convenient multi-timeframe indicator, with which you can see market information at once on several time slices. This will allow the trader to learn quickly and most importantly understand the vibrant market . The author himself went this way and this indicator helped incredibly. You probably have often wanted to see in detail why at a given point in time the price was rapidly moving away from a certain level or, on the contrary, stopping there. And for this you had to chan

The Laguerre VIX Trend Extrema (LVTE) indicator detects market tops and bottoms. As its name suggests, LVTE is a percentage price oscillator that identifies extreme ranges in market price. How to use: Buy when the indicator was in the lower "blue" range for more than 2 candles, and then moves up into grey. Sell when the indicator was in the upper "red" range, and then moves down into orange. Please see screenshots for examples! To make it simple, the indicator can show this by painting "dots

The indicator detects important peaks and troughs (extremes) on the chart. These points can be used to plot support/resistance levels and trend lines, as well as any other graphical analysis. These points can serve as reference points for setting trading orders. The indicator does not redraw .
Settings:
Size_History - the size of the calculated history. Num_Candles_Right - number of candles to the right of the peak or trough.
Num_Candles_Left - number of candles to the left of the pea

Do you use volume in your reading of the market?
Certainly many traders use it, and do not imagine operating without it.
The Color Histogram Volume Set indicator allows the user to choose the value that he considers interesting to monitor.
When you pass this you will have visual confirmation and if you want you will also have the audible alert that is given by the indicator.
Of course, there are other ways to try to find a high volume, such as assessing whether the volume
MetaTrader市场是独有的自动交易和技术指标商店。
阅读MQL5.community用户备忘更多地了解我们提供给交易者的独特的服务:复制交易信号,自由职业者开发的自定义应用程序,通过支付系统完成的自动付款和MQL5云网络。
您错过了交易机会:
- 免费交易应用程序
- 8,000+信号可供复制
- 探索金融市场的经济新闻
注册
登录