适用于MetaTrader 5的新EA交易和指标 - 103

Great dashboard for market analytics. The panel helps to analyze the values of the MACD indicator and Macd`s signals.
Using this panel you can: watch the current signal from Macd for all time frames; watch the current signal from Macd by different symbols; look Macd value (main line and signal line); look different between Main line and Signal Line; several types of signals for analytics.
Values in the table cell: Macd value (main line); Macd value (signal line);
main line minus signa

ARSINIUM is brand new Multi Strategy EA where you are able to define your Entry Points like a PRO! Originally it was developed as a Scalper for lower Timeframes, but we saw that the Entry Points, combined with some Filters, and other useful Options, are more than that. It works in many different Conditions and has many different Strategies you can build on your own. Test it for yourself and find out the best Strategy inside the Strategy! We offer this for 99 USD for a limited time to support

这个多时间框架和多品种指标扫描 pin bar。结合您自己的规则和技术,该指标将允许您创建(或增强)您自己的强大系统。 特征 可以同时监控您的市场报价窗口中可见的所有交易品种。将该指标仅应用于一张图表,并立即监控整个市场。 可以监控从 M1 到 MN 的每个时间范围,并在识别出 pin bar 时向您发送实时警报。支持所有 Metatrader 原生警报类型。 可以使用 RSI 或布林带作为趋势过滤器,以便正确识别潜在的逆转。 该指示器包括一个交互式面板。请参阅单独的屏幕截图。 可以配置为显示买入/卖出线和 TP/SL 线(基于 ATR 乘数)。这些线将显示在您通过单击面板中的信号打开的图表上。请看下面的截图
该指标可以将信号写入一个文件,EA 可以使用该文件进行自动交易。
输入参数
输入参数的描述和解释可以在 这里 找到。 重要的
请注意,由于具有多功能性,既不会在安装指标的图表上绘制买入/卖出建议,也不会绘制线条和箭头。它们将绘制在图表上,该图表将在单击面板中的信号时打开。强烈建议将指标放在干净(空)图表上,不要在其上放置任何其他可能干扰扫描仪的指标或智能交易系统。

HUBBLE it is a Secure Automated Software for trade Forex market and indices.
The architecture is a Fully Automatic Autonomous Robot Expert capable of
Independently analyzing the market and making trading decisions
HUBBLE It is an advanced trading system. This is a fully automatic Expert Advisor.
HUBBLE It is a 100% automatic system, The system is self-sufficient, performing all the work. Is a revolution in the customization of the trading. You can download the demo and te

This indicator serves as an alert for climax regions.
How does it work? When the 20-period arithmetic moving average meets the 200-period arithmetic moving average, a conflict region forms with two major opposing forces fighting. This causes the price to show random peaks until a winner side is defined, which can be dangerous. Therefore, the indicator paints the region between the moving averages to alert you.
How to use it? It can be used for specific volatility or support and resistance s
FREE

It is very easy to use the Fibrillar indicator, since the simplest is to look at the chart and act according to the indications of the colored arrows. The algorithm takes into account the measurement of prices, and this method also focuses on measuring each of the price drops (H / C, H / O, LC, LO) - which gives more detailed information, but also more averaged.
When calculating this indicator, logarithmic gains are first calculated at the closing price, which allows you to filter out the tre

Buy and sell signals based on the Continuous Point Setup for trend continuation, popularized in Brazil by Stormer and Palex.
How does it work? The indicator activates the buy signal when we have prices above the ascending 21-period Simple Moving Average (SMA21) followed by a pullback and a touch on it.
For a sell signal we need the prices below the descending SMA21 followed by a pullback and a touch on it.
How to use it? One way of using it, as suggested by Stormer, is to enter the
A trending strategy using a combination of two popular indicators Bollinger Bands and RSI provides reliable signals.
The logic of the advisor
Entering a short position is carried out when the price touches the upper Bollinger band, while the RSI indicator should be in the overbought zone, i.e. above level 70. Entering a long position is carried out when the price touches the lower Bollinger band, while the RSI indicator should be in the oversold zone, ie below level 30. It is possible to tr

Buy and sell signals based on Joe DiNapoli's shifted 3 period exponential moving average strategy for trend reversals.
Who is he? Joe DiNapoli is a professional trader and author that has been involved in the markets for more than 38 years. He is also a registered Commodity Trading Advisor (C.T.A.) for over 15 years and has taught his techniques in the major financial capitals of Europe, Asia, South Africa, the Middle East, Russia and in the United States.
How does the indicator work? The i

The fundamental technical indicator Ripple, allows you to assess the current market situation in order to enter the market of the selected currency pair in the trend and with minimal risk. It uses in its basis the process of identifying the rate of change in price growth and allows you to find points of entry and exit from the market.
This indicator was created on the basis of the original indicators of the search for extremes, the indicator is well suited for detecting a reversal or a large

O Indicador valida a força da tendência utilizando o volume negociado. Os candles são mostrados na cor verde indicando força compradora e cor vermelha na força vendedora. O movimento é encerrado pelo SAR parabólico. Vantagens: Filtra distorções de preço sem volume financeiro; Filtra consolidações e movimentos laterais; Filtra divergências de volume pelo indicador Money Flow. Desvantagens: Não filtra todos os falsos rompimentos, visto que rompimentos importantes geram altos volumes financeiros; N
FREE

EA made using combination of Pending Order and Martingale Strategy. Designed only to work best on Gold Spot M5. EA will put pending orders and on certain condition will create positions with bigger lot. This EA do not use Stop Loss due to the applied strategy. Stop Loss will be replaced using modified Take Profit.
Input Parameters 1. MaxOpenPositions : Define allowed positions can be open by EA, 0 will use default EA Value 2. TotalPendingOrders : Define allowed generated Pending order set, 0

The Buffer Reader will help you to check and export the custom indicators buffers data for your current chart and timeframe. You can select the number of buffer and historical bars to read/export. The data can be exported in a CSV format and the files will be stored in the folder: \MQL5\Files .
How it works Put the number of buffers to read in the Buffers_Total input parameter. Put the number of rows to display in the Rows_Total. Choose the CSV separator in the parameter. Copy the correct na
FREE

EA designed to generate pending orders based on the trend and designated take profit value. This EA designed exclusively to work best on GOLD SPOT M5 especially during up trend. User can freely decide to close the open position from this EA or wait until take profit hit. No parameters need to be set as it already set from the EA itself. This EA do not use Stop Loss due to the applied strategy. Please do fully backtest the EA on the worst condition before use on the real account. Recommended ini
CAP Zone Recovery Strategy Builder EA MT5 is a another version of our Main Product CAP Zone Recovery EA. This EA is a strategy builder type EA has more then 34+ build in indicator that you can make more then 1 million combination strategy that boost you trading strategy. Also this Builder offers an incredible amount of functionality with zone recovery strategy. So you can test your strategy easy way without knowledge of coding. [ Installation Guide | Update Guide | Submit Your Problem

Excellent Multiplatform Copier of deals. I use it regularly on VPS (copy from Mt5 to Mt4).
Multiplatform : copying from MetaTrader 4 to MetaTrader 4; copying from MetaTrader 4 to MetaTrader 5; copying from MetaTrader 5 to MetaTrader 4; copying from MetaTrader 5 to MetaTrader 5.
Modes: master - the current terminal is source of trades (deals are copied from it); slave - the current terminal is the receiver of trades (trades are copied to it). from myself - mode "deals multiplier" (use

Great dashboard for market analytics. The panel helps to analyze the values of the Envelopes indicator and prices.
Using this panel you can: watch the current signal from Envelopes for all time frames; watch the current signal from Envelopes by different symbols; look at how far Envelopes is from the price; look at how much the value of Envelopes has changed; several types of signals for analytics.
Values in the table cell: Envelopes value upper line; Envelopes value lower line;
"the

Introduction to Fibonacci Volatility Indicator Volatility indicator can help you to detect any statistical advantage for your trading. Especially, if you are trading with Price Action and Price Patterns, then we recommend to use the Volatility indicator together with your strategy. Especically, Fibonacci Volatility indicator combines the market volatiltiy with Fibonacci Analysis to provide you more advanced volatiltiy indicator. Main Features Fibonacci Volatility in Z score Configuration Mode Fi

Big summer sale. Save up to 40% on my products. ADR Dashboard - save 9$! The intention of the dashboard is to provide a quick overview of the daily, weekly and monthly range of configured assets. In "single asset mode" the dashboard shows you possible reversal points directly in the chart, thus making statistics directly tradable. If a configured threshold is exceeded, the dashboard can send a screen alert, a notification (to the mobile MT5) or an email. There are various ways of using this in

BeST_Keltner Channels Strategies MT5 is an MT5 Indicator based on the original Keltner Channels Indicator and it can display in the Chart all the known Variations of Keltner Channels and also the corresponding 10 totally Strategies. Every such generally consists of a Central Moving Average Line and two Boundary Bands at a distance above and below it and can be traded mainly in a Trending Mode but also in a Ranging ReEntry Mode.
BeST_Keltner Channels Strategies Indicator Draws definite Bu

Thread indicator is calculating possible values for the upcoming periods. It is built by author’s system, with ability to learn. Input data ( recommended interval ): Sensitivity to oscillatory motion (integer value, 0 - 8) increase of value shifts priority of calculation towards high-frequency vibrations (increase loads the system) Shift of diagram (integer value, 0 - 8) shifts output of indicator to the right Diagram forecast (integer value, maximum 10) defies the number of periods calculated
FREE

If you like to use traditional Moving Averages (like SMAs and EMAs) to provide your trades for dynamic levels of Support and Resistance, you will love the Adaptive Moving Average (AMA). Created in 1995 by Perry Kaufman and presented to the world in his book " Smarter Trading : Improving Performance in Changing Markets ", the Adaptive Moving Average (also known as KAMA - Kaufman Adaptive Moving Average) has the goal to be the perfect companion for following a trend without noise, but s
FREE

Indicator with 3 features
- Clock : Clock independent of the chart, counting continues even when the market is closed.
- Template : After setting up a configuration in any graphic, be it color patterns, indicators, zoom ... The configuration will be copied to all active graphics.
- TimeFrame : Set the TimeFrame on a chart, and with just one click all the active charts will be changed to the same TimeFrame.

Qstick is a way to objectively quantify candlestick analysis and improve the interpretation of candlestick patterns. Qstick was developed by Tushar Chande and published in his book " The New Technical Trader - Boost Your Profit by Plugging Into the Latest Indicators (1994) ". Qstick is built based on a moving average of the difference between the Open and Close prices. The basis of the idea is that the Opening and Closing prices are the heart of candlestick analysis. We strongly recommend the re
FREE

This indicator is an utility for have always under control, how much time is left at the end of the bar setted.
The utility show on the lower right of the chart, the countdown to the end.
When the remaining seconds is = to the seconds set in the input, the color of remaining seconds on chart, change color and play a warning sound to warn you that the bar is about the end. When the remaining seconds is < to the seconds set in the input, the utility play a beep to warn you that the bar is in
FREE

Script to create arrows and lines on chart of history positions traded on account for the symbol where you launch the application. From inputs you can select: - Magic number (default is -1; -1 = all magics number) - "From" date and time (default is 1970.01.01 00:00; all positions) - "To" date and time (default is 1970.01.01 00:00; all positions) - Color for buy open positions (arrows and lines between open and close) - Color for buy closing positions (arrows) - Color for sell open positions
FREE

Utility for show on charts the visual informations about:
- a vertical line at start of each bar of selected timeframe
- a vertical line at start of each day
- a vertical line at start of each week
- vertical lines at start / end of trading sessions selected
- bid / ask prices, spread, money value for each point (of 1 standard lot) and last tick time recived"
You can enable / disable each information and set the color for each line
FREE

Utility for know all informations and settings of all symbols available on your broker The informations that you can know are for example:
- Spread
- Digits
- Tick value
- Size step
- Size minimum
- Size maximum
- Swap buy and sell
- Margin required (for 1 standard lot)
- Rollover day
- Execution mode
and many other informations You can filter the symbols by group or you can also choose to see the informations only of symbols available on market watch.
FREE

Utility for know all informations and settings of account where the platform is connected The informations that you can know are for example:
- The difference from server time and time of your PC
- The limit orders that you can place at market
- The credit that you have
- The stopout mode of your broker
- The exact name of company of your broker
and other informations
FREE

Utility for know all informations and settings of terminal where the utility is loaded. The informations that you can know are for example:
- The path of folder where the terminal start
- The path of folder where the terminal store the indicators, experts advisors etc
- The path of common folder
- The permission to use DLL, to automated trading etc
- The permission to send email, FTP or notifications to smartphone
and many other informations
FREE

Script to load on chart the orders, starting from "Signal history report" downloaded from MQL5. If you found a good signal on "Signals" section of this site and you want to see the history orders on chart, you can do it, following this steps: - Download the csv file of history orders - Copy file in the common folder - Launch the script and set the input that are: - Report type (MT4 or MT5) - File name - Delimiter (default is ;) - Name of symbol to load (if symbol on file is for example EURUSDi,
FREE

Script to calculate equity and balance at a specific date and time.
This script makes up for a lack of MetaTrader account history, that does not show how the balance and equity changes in time.
Balance calculation includes closed orders only.
Equity calculation includes orders closed before and orders that are still open at the specified time.
Example: date and time set to 2020/07/06 00:00. If I had a Buy 1 lot EURUSD position opened at price 1.12470 on the 2020/07/02, the program woul
FREE

Description :
Combination EA MT5 is a simple Expert Advisor based on Combination MT5 custom Indicator. The Indicator is incorporated in the EA, therefore you don't need it as a separate tool for the EA to operate. Combination MT5 custom Indicator is based on Stochastic Oscillator and Average True Range (ATR), both are set to their default values. If you wish, you can download Combination MT5 custom Indicator for free from my product page .
The Expert Advisor settings are as follows :
Ma

AKT for MT5 (Traders Club)
機能: MAゴールデンクロスで買いサイン、デットクロスで売りサインを表示します。 MAの期間は短期足と長期足を入力できます。 MAの種類を選択できます。(SMA、EMA、SMMA、LWMA) 適用する価格を選べます。(CLOSE,OPEN,LOW,HIGH,MEDIAN,TYPICAL,WEIGHTED) サインをアラートで通知します。 サイン発生をE-mailやSNSで通知します。 表示するサインを変更することが出来ます。
サインの色を変更することが出来ます。
サインの表示された時間と価格が表示されます。
※価格は終値になります。
Indicator Noを変えることによるこのインジケータを複数適用することができます。
これにより違う MAの期間による ゴールデンクロスと デットクロスのサインを
表示できます。

ResiSupo (Traders Club)
このインジケータは直近の高値と安値を抜いたときに何ら方法で 知る方法はないかと思い開発されました。
機能: 指定したローソク足の本数で終値をベースに最高値と最安値の ラインを自動で引きます。 最高値と最安値のラインにタッチするとアラートで通知します。 通知はE-mailやSNSにも送信することができます。 最高値と最安値のラインを終値か高値または安値ベースにするかを選択できます。 Indicator Noを変えることによるこのインジケータを複数適用することができます。 これにより過去80本と20本などでの最高値と最安値のラインを引くことが可能になります。 現在のATRの値を画面に表示します。 これにより現在のボラリティーの状況が一目で分かります。 表示されているSLはディフォルトではATR値の1.5倍になっています。 この数値は現時点でのボラリティーの状況からの損切り幅の目安となります。 ATRのレベルにより表示の色が変わります。 ボタンを押すことによりアラートの通知を無効にできます。 ※ネットワークの不安
This indicator is powerful for detecting the trend.
The crossing between to line is the entry signal. Buffer 0 is UP line. Buffer 1 is DOWN line. Note: 1. Aroon is great tool for trending detecting. Please try to select the best period for each instrument.
Input AroonPeriod =14- Aroon period
MailAlert =false- Send email when entry signals appeared.
SoundAlert =false- Notify on MT5 platform.

Utility for know the performance of your acoount.
From dialog you can filter data in this modes:
- You can include or not include the open positions - You can include or not the closed positions - You can filter the data by date (from, to) - You can filter the data by simbols (multi selection) - You can filter the data by magic number (multi selection)
On bottom of table, are show the total of:
- Number of data - Total size - Total commissions paid - Total swap paids - Total profits - T

Индикатор построен на основе индикаторов VIX и RSI. Комбинация двух указанных индикаторов позволяет обнаруживать зоны крайней перепроданности, где цена с большой долей вероятности изменит направление. Наиболее сильные сигналы дает в периоды слабого тренда. Сигналом индикатора является изменение направления гистограммы (с роста на снижение) выше заданного (сигнального) уровня.
В индикаторе задан широкий спектр параметров, который позволяет оптимизировать индикатор для торговли любыми активами:

Currency Strength Meter is the easiest way to identify strong and weak currencies. The indicator shows the relative strength of 8 major currencies: AUD, CAD, CHF, EUR, GBP, JPY, NZD, USD.
By default the strength value is normalised to the range from 0 to 100 for RSI algorithm: The value above 60 means strong currency; The value below 40 means weak currency;
The indicator is created and optimized for using it externally at an Expert Advisors or as a Custom Indicator inside your programs.
您好亲爱的交易员。
PortfolioHedgingStopOrderOneSymbol-趋势顾问,用于在第三个Elliott波浪上从通道中间开仓订单,在自定义通道宽度指标TMA的突破水平上工作,具有固定的S/L和T/P。 EA旨在确定市场的最佳入场点,以便在修正后继续移动。 如果你有一个强大的趋势运动的确认,但你是一个新手,仍然怀疑你的行为的正确性,它始终是更好地等待修正结束,然后进入市场,我们也认为并创建了 TMA指标确定通道宽度和相对于通道宽度参数,设置一个水平以确定突破点,通道宽度在每个柱上重新计算,如果需要,在价格之后移动虚拟订单水平以确 TMA指标确定通道宽度和相对于通道宽度参数,设置一个水平以确定突破点,通道宽度在每个柱上重新计算,如果需要,在价格之后移动虚拟订单水平以确 瓦西里耶夫 瓦西里耶夫 14小时前 美好的一天Inyi,感谢您的评论. 答案1:我们的ea交易采用半自动操作,可用于确定最稳定的入场点,并确认趋势变动。 答案2:EA有需要改变每个工具的设置:a)趋势方向(买入或卖出交易决议-两个方向默认启用),b)中间通道水平的距离(其中价格应该返回到- 蓝线图

Renko是一个永恒的图表,也就是说,它不考虑时间段,而是考虑价格变化,这使得图表上的价格变化更加清晰。
Hyper Renko是提供此功能的指标。
要进行配置,您只有一个参数,即您要使用的对号*中蜡烛的大小。
*勾号:是资产的最小可能变化。
感谢您选择超级交易者指标。
维基百科: 连环图表示变量值(例如金融资产的价格)随时间变化的最小变化。仅当所考虑的值(例如价格)变化了某个最小数量时,图形才会随着时间前进。例如,在考虑资产价格R $ 1变动的Renko图表上,仅当变动发生时(向上或向下)才绘制新的“砖”-不管变动发生了多长时间以及交易量。因此,如果在水平轴上绘制时间,在垂直轴上绘制价格变化,则所有“砖”的高度都相同(价格变化相同),尽管它们在视觉上相同,但它们之间的间距却代表不同的时间量。
FREE

该指标识别一种特殊类型的内线形态,由一根大主蜡烛和 4 根较小蜡烛形成(请参阅下面的策略说明)。 特征 在图表上绘制买入/卖出止损线以及止盈和止损水平。 TP/SL 水平基于平均真实范围 (ATR) 指标。 对象颜色是可变的。 当确定主蜡烛形成时向您发送实时警报 - 声音/弹出窗口/电子邮件/推送通知。 提出建议后,您可以通过自己的图表分析进行确认。通常,最好的交易设置是围绕重要支撑/阻力、整数、供需区域等发生的设置。 如果您想在多个图表上使用该指标,您可以考虑利用我的三角旗和三角形扫描仪中的内柱扫描,您可以找到 在这里 。 输入参数
内部蜡烛的数量 :为了获得最佳信号质量,建议将其设置为 4。请参阅下面的策略说明。 最大蜡烛线信号适用于 :此设置控制建议的入场线将扩展多长时间。 买入/卖出止损点的距离 :入场线的偏移量/缓冲区。建议主蜡烛高/低至少 5 个点。 以点为单位的最小主蜡烛尺寸 :请参阅下面的策略说明。 以点为单位的最大主蜡烛尺寸 :请参阅下面的策略说明。 等待蜡烛关闭 :真/假。默认值为真。如果设置为 False 那么警报将在 4 日 蜡烛打开。

Hyper Force指标最初由David Weis于1984年创建,以波形形式显示符号趋势的强度。
波浪越大,趋势越强。
小浪意味着弱势的趋势或没有趋势的市场。
在波浪中,一个柱线和另一个柱线之间的差异越大,趋势越强。
当一个条形图和另一个条形图之间的距离开始减小时,这意味着该波已经开始失去其趋势。
因此,以强大的力量抓住浪潮并在浪潮减弱时走出去是理想的。
其他指标,例如移动平均线,MACD可以帮助您有力地确认这一趋势。
当一个条形图和另一个条形图之间的距离开始减小时,这意味着该波已经开始失去其趋势。
因此,以强大的力量抓住浪潮并在浪潮减弱时走出去是理想的。
其他指标,例如移动平均线,MACD可以帮助您有力地确认这一趋势。
FREE

线性回归的截距值和相对于截距值对称的平均绝对偏差的表示。
参数
•Periods:计算线性回归的周期数
•Amplitude:定义频段的绝对平均偏差的倍数
•Displacement:水平轴上的位移
•AppliedPrice:进行计算的价格
•MainPlot:显示主图
•UpperPlot:显示上限
•LowerPlot:显示较低频段
请注意,当价格处于范围内时,移动平均线只是线性回归。在这里,我们看到了线性回归相对于最常用的指标之一的优势,那就是它在价格趋势变化时以相同的方式进行调整,但在移动平均线方面没有变化。
使用建议
•与移动平均线相比超级快,因此MainPlot更好地代表了价格
•波段可以更准确地定义价格通道,不仅在范围上,而且在趋势上,这都是波动交易的理想选择
•它可以用于肉眼可视化趋势,也可以用于价格的持续加速和减速。每当价格高于MainPlot时,价格就会加速,而当价格低于MainPlot时,价格也会相反。
记得!!!…
•指标
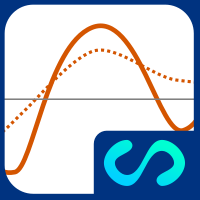
线性回归的斜率值表示。它具有一个参考图,可以直观地确定斜率值的变化(价格的加/减)。
参数
•Periods:计算线性回归的周期数
•PeriodsReference:根据主图的值计算移动平均线的周期数
•Displacement:水平轴上的位移
•AppliedPrice:进行计算的价格
•MainPlot:显示主图
•ReferencePlot:显示参考图
使用建议
•使您可以轻松查看当前价格趋势。如果MainPlot大于零,则趋势为正,如果小于零则趋势为负。
•它可以轻松直观地看到斜率的变化(价格的加/减)。如果MainPlot高于ReferencePlot,则价格正在加速,如果低于,则价格正在减速。
•非常适合于摆动交易或高速交易。
•确定交易主要方向(买/卖)的理想选择。
•它不提供有关价值区域(支撑,阻力)的直接信息,因此最好将其与价格指标(例如移动平均线或线性回归带)配对。
•当MainPlot穿越零时,提供有关市场反应区域(支撑,阻力)


FREE

Great smart dashboard for market analytics.
Using this dashboard you can: find signals from different indicators from all timeframes ; find signals from the Moving Average from all symbols ;
Include: 9 indicators (10 in Mt5 version); 27 signals (29 in Mt5 version); "Total" page.
Indicators and signals: MOVING AVERAGE MA cross Price - MA crosses Price; MA more/less Price - MA higher/lower Price; BOLLINGER BANDS BB crosses Price (in) - Price crosses Bollinger (upper/lower line

此多品种指标旨在自动识别价格何时达到主要心理水平。也称为整数、整数或关键级别。作为奖励,它还可以在一个选定的时间范围内扫描枢轴点水平。结合您自己的规则和技术,该指标将允许您创建(或增强)您自己的强大系统。 特征 可以将信号写入文件,智能交易系统可以使用该文件进行自动交易。 可以同时监控您的市场报价窗口中可见的所有交易品种。将该指标仅应用于一张图表,并立即监控整个市场。 当价格达到整数水平时向您发送实时警报。支持所有 Metatrader 原生警报类型。 该指标包括一个用于存储信号的图表面板。 输入参数
请在此处 找到输入参数的说明和解释。 重要的
强烈建议将指标放在干净的图表上,不要在其上放置任何其他可能干扰扫描仪的指标或智能交易系统。请注意,由于具有多功能性,既不会在安装指标的图表上绘制买入/卖出建议,也不会绘制线条和箭头。圆形水平线将绘制在图表上,点击面板中的信号时将打开该水平线。

The Metatrader 5 has a hidden jewel called Chart Object, mostly unknown to the common users and hidden in a sub-menu within the platform. Called Mini Chart, this object is a miniature instance of a big/normal chart that could be added/attached to any normal chart, this way the Mini Chart will be bound to the main Chart in a very minimalist way saving a precious amount of real state on your screen. If you don't know the Mini Chart, give it a try - see the video and screenshots below. This is a gr

SETI is a Break indicator multipair searching SETI is a powerful indicator of for any par and any timeframe. It doesn't requires any additional indicators for the trading setup.The indicator gives clear signals about opening and closing trades. This Indicator is a unique, high quality and affordable trading tool. Can be used in combination with other indicators Perfect For New Traders And Expert Traders Low risk entries. Never repaints signal. Never backpaints signal. Never recalculates

Tops & Bottoms Indicator FREE Tops abd Bottoms: An effective indicator for your trades
The tops and bottoms indicator helps you to find ascending and descending channel formations with indications of ascending and/or descending tops and bottoms. In addition, it show possibles opportunities with a small yellow circle when the indicator encounters an impulse formation.
This indicator provide to you more security and speed in making entry decisions. Also test our FREE advisor indicator:
FREE
Conversion of ".set" files created in the MT5 terminal for use in the MT4 terminal. The script is great for cross platform experts.
How to work: place the source files ".set" in the local terminal folder\MQL5\Files run the script the ".set" files for the MT4 terminal appeared in the local terminal folder (the end of the file name "* -MT4.set")
Created on MT5 build 1755 from 18/01/18 Please leave your feedback after using.
FREE

The best time to trade Using this Indicator is when the time reach exactly hour,half,45 minutes,15 minutes and sometimes 5 minutes..
This indicators is helpful to those who trade boom and crash indecies.How to read this indicator first you'll see Blue allow and Red allow all these allows used to indicate or to detect the spike which will happen so the allow happens soon before the spike happen.This indicator works properly only in boom and crash trading thing which you have to consider when

Create and trade timeframes in seconds. The bar time duration is freely adjustable from 1 second and up. The chart is accurately constructed using real ticks from the broker's server. Main characteristics The indicator is an overlay on the main chart, making it possible to utilize one-click trading and on-chart order manipulation. History calculated using real tick data. Built-in technical studies: 4 moving averages (Simple, Exponential, Smooth, Linear-weighted, Volume-weighted using tick or rea

MA Jumps Expert (MT4 version https://www.mql5.com/pt/market/product/52250 ) This system uses the overall trend to trade exponential moving averages jumps that at the same time form some pattern (wick formation, engulfing). The system uses 2 exponential moving average to calculate the jumps to trade, based on the market direction. The market direction is determined by the 200 exponential moving average. This system was design to work best for EURUSD and AUDUSD on 1H timeframe and its

An algorithm to detect a spike instantly with zero lag.. Use default settings for "Crash And Boom" This smart algorithm detects a spike, which can be use to filter out market spikes, give entry signals with exit. Trading:- Booming for Boom and Crashing for Crash
Spike Signal:- The less you decrease the more signals
Multiplier:- This multiplies the Signal
Time Ratio:- For adjusting the Signal
AlertProperties = "====== Alert Properties ======";
SendAlertViaAlertWindow:- if set to true it wil
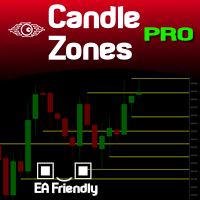
You probably heard about Candlesticks behaviors, which in most of the times could denote and trace Volume behaviors even if you are not watching Volume itself... Well, this indicator will do this. Naked traders love to rely solely on candlesticks patterns and with Candle Zones you can trap special patterns and DRAW THEM on your chart. As simple as that. There are several filters you can tweak in order to achieve the analysis you want. Just give it a try. After several months of testing, we think

This Expert Advisor is a fully automated trading system on the most popular major currency pairs and is based on Moving Average and Alligator settings optimized to get the maximum return over time. Draw Down is controlled using trailing stop and each currency can have different set files. A Large number of inputs and settings are tested and optimized and embedded in the program hence making inputs options very simple and easy to understand.
SET FILES ARE ADDED TO THE COMMENT #1 OFFER until

Old Partridge knew markets which are almost as old as the Earth itself are never wrong. The legend says he knew how to beat a legion of others. This system he will to me. This system I will give to you.
Example [1] = 100 pips, profit boundary [2] = 2.0, take profit [3] = 400, stop loss [4] = 200 You buy EURUSD as 1.1440. SL will be set to 1.1420, TP will be set to 1.1480, when EURUSD = 1.1460 SL will be moved to 1.1450 EA works with the pair it is run on, [5] option allows to escort positions
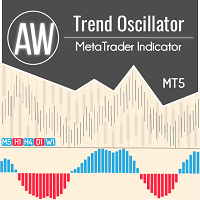
具有高级过滤系统的趋势振荡器。它决定了趋势,它的减弱和增强。有一个内置的多时间框架面板。 AW 趋势振荡器适用于任何时间框架和任何符号(货币、指数、石油、金属、股票)。 MT4 版本 -> 这里 / 问题解决 -> 这里 特点和优点:
高级趋势过滤 一键更改指标的灵敏度 易于设置 多时间框架面板 能够移动和最小化面板 适用于任何符号和任何时间范围。 各种通知 输入设置: . 指标周期 - 指标周期,数值越大,指标信号的敏感度越低,
. 发送推送通知 - 使用移动版交易者终端的新信号通知,
. 发送弹出警报 - 在警报时使用声音通知,
. 发送电子邮件 - 使用向交易者的电子邮件发送有关信号外观的电子邮件,
. 显示多时间帧面板 - 启用面板显示,
. 多时间框架仪表板 - 面板视图,最小化或完整,
. 面板中的字体大小 - 指示器面板上的文本大小,
. Up color main - 上涨趋势加强时的颜色,
. Up color second - 上升趋势减速时的颜色,
. Down color main - 下跌趋势加强时的颜色,
. Down co

Zhǐbiāo jīyú měi gè túbiǎo shíjiān de 6 gè xìnhào, gēnzōng tóngyī zīchǎn de 5 gè bùtóng túbiǎo shíjiān de qūshì. Gāi zhǐbiāo dì zhǔyào mùdì shì xiàng wǒmen zhǎnshì fàngzhì gāi jīnróng zīchǎn de duōshù qūshì. Xìtǒng zài shù gè túxíng shíjiān zhōng chuánshū qūshì xìnxī, zhèyàng yònghù kěyǐ guǎngfàn chákàn zīchǎn de yídòng, zhè zhǒng gōngjù tōngguò bāngzhù cāozuò yuán zhíxíng dìngdān shǐ yònghù jùyǒu jiào gāo de mìngzhòng lǜ zhīchí qūshì.

非指標 EA 交易,不使用指標、訂單網格或鞅。每天的交易數量可以受到嚴格限制,一次只能在市場上1個訂單。交易受止損保護,它可以是真實的或虛擬的(對經紀人隱藏)。在亞洲時段運作,市場平靜。具有防止滑點和點差擴大的內置保護。週一至週五不轉倉,具有周五自動平倉功能。
該策略使用價格模式 - 這是確定短期趨勢方向的通用方法。有方便的資金管理,每N個餘額固定手數。圖表顯示交易統計,易於設置和優化。
默認工作時間範圍是 M5,EURUSD 符號。以下貨幣對適合顧問:GBPUSD、USDCAD、EURUSD、USDJPY、USDCHF、AUDUSD、NZDUSD ...
選項:
START_HOUR, START_MINUTES - 交易開始的小時和分鐘; STOP_HOUR, STOP_MINUTES - 交易結束的小時和分鐘; TIMEFRAME_ATR - 計算平均波動率的時間範圍; PERIOD_ATR - 平均波動率計算週期; RATIO - 信號的百分比; COUNT_CALC_BARS - 形態中的柱數; TRADE_BARS 信號的柱數; VOLATILIT

该指标旨在衡量给定移动平均线与价格的距离。
该指标除显示间距值外,还有间距本身的平均值,以辅助和确认分析。平均值的类型和计算间距值的平均值以及间距平均值都是可以参数化的。
啟用選項“設置自動水平和顯示信號”後,指標將在圖表上顯示買入和賣出信號。當價格與平均值的偏差大於指標中確定的水平時,出現買入和賣出信號。 注意:該級別是動態插入到指標中的,也就是說,如果發生新的偏差而修改了資產的特徵,則會對其進行修改。圖表上僅顯示在指標水平上一次更改之後發生的買入和賣出信號。
设置。
主要移动平均线周期 (用于计算距离) 移动媒体类型(简单、指数) 距离移动平均周期
注:为了更好地显示高距离电平,建议在指示灯中插入电平。
........................................................................................................................................................

The famous brazilian trader and analyst Didi Aguiar created years ago a study with the crossing of 3 Simple Moving Averages called "Agulhada do Didi", then later was also named Didi Index, as a separate indicator. The period of those SMAs are 3, 8 and 20. As simple as that, this approach and vision bring an easy analysis of market momentum and trend reversal to those traders looking for objective (and visual) information on their charts. Of course, as always, no indicator alone could be used wit
FREE

Fibonacci and RSI.
Demo versión only works with GBPUSD. For full version, please, visit visit https://www.mql5.com/en/market/product/52101
The indicator is a combination of the Fibonacci and RSI indicators.
Every time the price touches one of the fibonacci levels and the rsi condition is met, an audible alert and a text alert are generated.
Parameters number_of_candles : It is the number of candles that will be calculated. If you put 100, the indicator will give you the maximum and min
FREE

TRADE EXTRACTOR is the fastest self-learning AI Algorithm, which will learn any market situation with ease.As a Manual trader, I came across the difficulty of finding the right parameter and the right condition to trade. There are infinite combinations of indicators and objects(trendlines, gann grid, fibo levels etc) which as an human, I can’t decide their winning rate or performance. Many claim to have a winning strategy but won’t have enough statistical support to prove their claims. Due to

Buy and sell signals based on Larry Williams's exponential moving average strategy 9.4 for failed reversals and trend continuation.
How does it work?
For an uptrend, we need a candle turning the 9 period EMA down and closing below it, followed by a candle turning the 9 period EMA up and closing above it, with a low higher than the previous candle's low. For a downtrend, we need a candle turning the 9 period EMA up and closing above it, followed by a candle turning the 9 period EMA down and

Mr. Averager MT5 is a Expert Advisor for the MetaTrader 5 trading terminal. The trading algorithm is based on the principle of position averaging. Due to averaging, the EA is not sensitive to the quality of entry points and can work almost at any time and in almost any market. The EA supports 2 trading modes: Automatic start and Manual start. In Automatic start mode, the EA independently starts a new series of orders. In Manual start mode, the first order of the series is opened manually using

Buy and sell signals based on Larry Williams's exponential moving average strategy Setup 9.2 for trend continuation.
How does it work? The indicator activates the buy signal when a candle closes below the previous low while maintaining the 9 period EMA's upwards. For a sell signal, we need a candle closing above the previous high while maintaining the 9 period EMA's downwards.
How to use it? One way of using it, proposed by Larry Williams, is to enter a trade with a buy stop order one ti
MetaTrader市场是一个简单方便的网站,在这里开发者可以出售自己的交易应用程序。
我们将帮助您发布您的产品,并向您解释如何为市场准备您的产品描述。市场上所有的应用程序都是加密保护并且只能在买家的电脑上运行。非法拷贝是不可能的。
您错过了交易机会:
- 免费交易应用程序
- 8,000+信号可供复制
- 探索金融市场的经济新闻
注册
登录