适用于MetaTrader 5的付费技术指标 - 58

Chart Clarity Dashboard
The Chart Clarity Dashboard provides clear insights into price movements for various financial instruments like currency pairs, cryptocurrencies, equities, commodities, and indices. This dashboard displays detailed price information in real-time, making it easier for traders to make decisions quickly. It shows price movements down to the second, giving you essential data before you trade or analyze charts. Chart Clarity Dashboard allows you to monitor price changes acro

Volume Clarity Pro The Volume Clarity Pro provides clarity in the movement of price for any financial instrument, including currency pairs, cryptocurrencies, equities, commodities and indices. The Volume Clarity Pro maps out where price is consolidating, retracing, resisting or settled in areas of support. The Volume Clarity Pro accurately displays the month's price action, offering crucial data about your selected trading pair for chart analysis and trade initiation. The Volume Clarity Pro is

Introducing our revolutionary intra-day trading indicator, meticulously crafted to optimize your trading insights within the 24-hour market cycle. Immerse yourself in historical data with precision using two distinctive modes - "All History" and "Last X Hours."
Key Features: All History Mode Uncover a comprehensive view of the day's dynamics. Instantly analyze the preceding day's high and low, 50% mid-point, and the open versus close price for the current day. Decode critical patterns to inform

Gobbo è un indicatore professionale che evidenzia il trend del mercato con un aspetto grafico chiaro e comprensibile, è basato sulla Moving Average e può essere impostato su qualsiasi periodo di intervallo, di default impostato sul periodo 14, scegliendo un periodo più alto evidenzierà meno cambi di tendenza per un approccio sul medio o lungo periodo, con un periodo più basso più cambi di tendenza per un approccio sul breve termine L'aggiornamento e l'adattamento al time frame scelto avviene in

崩盘尖峰大师是未来交易崩盘市场的工具。 它被设计用于在1分钟时间框架上运行于崩盘300、500和1000市场。 它有两种不同的交易模式(激进和正常)。 激进模式将绘制黄色和蓝色箭头。有两个不同的条件帮助您做出正确选择。在黄色箭头上进入第一笔交易,在蓝色蜡烛上进入第二笔交易。在这种模式下的止损将距离蓝色箭头10根蜡烛。 正常模式只会在图表上绘制红色箭头。这个模式适用于较小的账户规模。 请确保从评论部分下载设置文件。只需将指标加载到图表上,然后加载市场的设置文件。请下载并发表一些反馈。同时也留意Boom市场指标。 欢迎提供反馈。 欲了解更多信息,请随时通过WhatsApp联系+27 74 335 3692。 我还设置了一个特别的发布价格。在2024年1月享受50%的折扣,因为2月的价格将调整为100美元。

"QuantumEdge FairValueGap Pro" - The Ultimate Trading Edge!
Elevate your trading experience with the QuantumEdge FairValueGap Pro, your all-in-one solution for unparalleled market insights and precision trading. This cutting-edge indicator brings quantum-level analysis to your fingertips, empowering you with advanced tools to navigate the financial markets.
Key Features:
1️⃣ FairValue Precision: Gain a quantum-edge perspective on market fairness, with a focus on pinpointing the most lucr
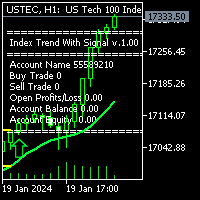
Description: Index Trend with Signal: is the Best working on DE40, USTEC, US30, US500 index on H-1 time chart with default settings. You don't need to change any settings. Easy to install and ready to start working. First of all this Index Trend with Signal Indicator is Non-Repainting, Non-Redrawing Indicator, which is best tool for Index Traders. For limited time only 50% OFF, Now 51$ only. 10 purchases left & the price increases to 30$ and final price will be 300$
Contact me right after th

BreakHarmony Multi-Timeframe Breakout Indicator for MT5
The BreakHarmony Multi-Timeframe Breakout Indicator for MT5 is a highly advanced tool providing information on breakout points across different timeframes, aiding traders in decision-making and understanding market movements. [ Features and Manual | MT4 version | All Products ] The indicator tracks breakout points on price charts across 6 timeframes. Breakout prices are indicated with the closing price of the correspondi

黄金形态是基于斐波那契数列黄金比例的 3 烛台配置。
黄金比例是1.618。 其变体包括 0.618、2.618 和 3.618。 在此指标中,结果最好为 2.618。
黄金形态由一根普通蜡烛和一根更大的蜡烛组成,收盘价至少是第一根蜡烛尺寸的 2.618 倍。
看涨黄金形态由看涨蜡烛组成,而看跌黄金形态由看跌蜡烛组成。
除了信号之外,建议的入场线还绘制为蓝线,分布在最后 2 根蜡烛上。
其参数为:
斐波那契比率(0.618、1.618、2.618、3.618 等) 上面信号的 Wingdings 代码,即看跌信号(参见屏幕截图中的 Wingdings 表) 上面信号的颜色(看跌) 下面的信号 Wingdings 代码,即看涨信号(参见屏幕截图中的 Wingdings 表) 下面信号的颜色(看涨) 信号宽度 而显示或不显示建议的输入线 建议入场线的颜色 建议入场线的宽度 建议输入行的样式

Vision è un indicatore professionale che legge i dati storici del periodo impostato e in base a tali elabora una previsione scrivendo l'andamento sul grafico, l'impatto visivo eccellente rende chiaro l'andamento del prossimo trend e mette a fuoco il prezzo d'ingresso il posizionamento di ordini e la distanza per SL e TP, di default è impostato con un rapporto bilanciato 24 a 24 ciò significa che in base alle ultime 24 candele prevederà scrivendo sul grafico l'andamento delle 24 candele successi

The Jurik Advanced MA (JurMA) is a non-repaint technical indicator developed over the original JMA concepted by Mark Jurik.
It is designed to reduce lag present in traditional moving averages, improve smoothness, and reduce noise. JurMA adapts to market volatility and can be fine-tuned by the user for sensitivity, making it useful for identifying trends and reversals in financial markets. This adaptability and efficiency make it popular among traders and analysts.
In the wide context of othe

TrendOnClose is a sophisticated indicator designed for Binary market investors, focusing on statistical analysis of trends and counter-trends within specific candle cycles. Each cycle is defined by the candle CLOSE price, establishing the trend direction (UP/DOWN - BULL/BEAR) for subsequent statistical analysis until the start of the next cycle. The statistical analysis operates with two configurations: ⦁ Statistical Goal as SUBSEQUENT CANDLE: The algorithm focuses on the subsequent candle withi

Простой индикатор тренда в NRTR виде с отрисовкой линий стоплосса и тейпрофита, цвет и направление движения которых определяются действующим трендом. Индикатор имеет возможность подавать алерты, отправлять почтовые сообщения и push-сигналы при смене направления тренда. Следует учесть что значение входного параметра индикатора Deviation of the take profit line in points для каждого финансового актива на каждом таймфрейме необходимо подбирать индивидуально!

HAshi-E is an enhanced way to analyze Heiken-Ashi signals.
Briefing:
Heiken-Ashi is particularly valued for its ability to filter out short-term volatility, making it a preferred tool for identifying and following trends, helps in decision-making regarding entry and exit points, and assists in distinguishing between false signals and genuine trend reversals. Unlike traditional candlestick charts, Heiken-Ashi candles are calculated using average values of previous bars, creating a smoother, mo

An indicator to show the current U.S. Dollar Index ( USDX , DXY , DX ). It is a weighted geometric mean of the dollar's value relative to the following select currencies: Euro (EUR), 57.6% weight. Japanese yen (JPY) 13.6% weight. Pound sterling (GBP), 11.9% weight. Canadian dollar (CAD), 9.1% weight. Swedish krona (SEK), 4.2% weight. Swiss franc (CHF) 3.6% weight.
You can request me to customize a similar indicator with weighted and currency pairs you desire. Just call me on MQL5, thanks

Functional in the Forex market. Functional on the B3 market - Bolsa Brasil Balcão. Motivation The Price Guide indicator is a tool that helps you insert support and resistance points at the chosen price and in the quantity you want, it depends on the agility of its configuration. This FULL version will work in Meta Trader 5 on all accounts and Strategy Tester . To test on the DEMO account , download the free version at: https://www.mql5.com/pt/market/product/111620 Operation The method
" Base Market Signals " A powerful and innovative technical analysis indicator designed to revolutionize your trading experience. Engineered by Southern Star Trading, this indicator is your key to unlocking profitable market insights in the ever-changing world of financial markets.
Key Features:
1. Dynamic Signal Detection: Base Market Signals employs sophisticated algorithms to dynamically identify potential trend reversal points, providing you with timely and accurate signals.
2. Versatile
Introducing the Engulfing Goddess Metatrader 5 (MT5) Indicator , a revolutionary tool designed for traders who seek to harness the power of candlestick patterns in their trading strategy. This indicator is built on the principles of engulfing candlestick patterns , a popular method used by successful traders worldwide. Our Engulfing Goddess Indicator stands out with its ability to detect various kinds of engulfing patterns . It employs a range of filters, providing you with a comprehensive anal

Designed by Welles Wilder for daily commodity charts, the ADXW is now used in various markets by technical traders to assess the strength of a trend or even a trend for short- or long-term trades.
The ADXW uses a positive (DI+) and negative (DI-) directional indicator in addition to its trend line (ADX).
According to Wilder, a trend has strength when the ADX signal is above 25; the trend is weak (or the price has no trend) when the ADX is below 20. The absence of a trend does not mean that th

On-Balance Volume (OBV) is a technical indicator that relates volume and price to identify price movements. The basic idea behind OBV is that changes in volume generally precede price changes. The indicator accumulates volumes for periods when the price closes higher and subtracts volumes for periods when the price closes lower. This results in a value used to identify the direction of the asset's trend.
The interpretation of the OBV is simple: a rising OBV suggests that buyers are willing to

In the realm of technical analysis, ParbMA emerges as a highly intuitive tool for examining the Parabolic SAR trend . This innovative approach leverages a customizable line, distinguished by its versatility in color, shape, and width options. Such flexibility enhances visual analysis and significantly aids in strategizing and decision-making.
The ParbMA (Parabolic Moving Average) is a custom technical indicator that combines the concepts of J. Welles Wilder's Parabolic SAR (Stop and Reverse) a

Uncover high-probability opportunities in trending markets with the Brilliant Entries Indicator. Its clear visual signals can be followed and incorporated with market structure to provide you with accurate entries. Give it a try and gain an edge in your trading strategy.
It can be used on it's own but i highly recommend to used it as part of a wider strategy to provide you with confluence.
It works on all timeframes but will work very good doing market structure 2 x timeframes higher and then

Introducing the True Currency Strength Indicator - Your Ultimate Guide to Market Mastery! Are you tired of guesswork when it comes to trading? Ready to elevate your trading strategy to a whole new level? Look no further! We present to you the True Currency Strength Indicator - the game-changer in the world of Forex trading. Unleash the Power of Multi-Currency Analysis: Gain a competitive edge with our revolutionary indicator that goes beyond traditional single-currency analysis. The Tru
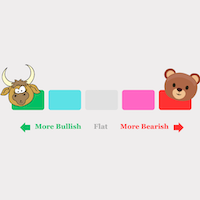
By using (MOMENTUM and VELOCITY and ACCELLERATION) and the power of machine learning we can accurately calculate the current strength of the currencies of each time frame. - It's really easy to use: Choosing to trade between currency pairs that have clear and dominant trends will give you a great advantage. -The currency pair strength meter is rated from -100 to + 100

Subscribe to the 'MA7 Trading' channel to receive notifications about new programs, updates and other information. Ask questions in the profile on the MQL5 .
Description of work
The 'MA7 Agave' indicator is based on the standard Average Directional Movement Index (ADX) indicator. Shows the intersection of the +DI and -DI lines. Detailed information about the 'MA7 Agave' indicator.
Indicator settings
General settings: ADX period - Average Directional Movement Index indicator period.
'MA7 Flax

This indicator helps you identify support and resistance levels. Also it adds break points when level is broken. Price sometimes goes back to break point. It has 4 technical parameters and 4 buffers for expert advisors. Buffer indexes: 0 - Resistance, 1 - Support, 2 - Resistance break point, 3 - Support break point". Number of Levels: Determines how many levels are on graph ( if 3 - 3 levels of support and 3 levels of resistance) Tolerance in percentage %: This parameter is used to filter out

Currency Strength Dynamic 貨幣強弱動態是貨幣強弱的指標。 貨幣強度是指某種貨幣所屬的大多數或所有貨幣對的趨勢方向。
該指標基於 28 種最受歡迎的貨幣對(主要貨幣對和次要貨幣對)的移動平均線之間的差異讀數,類似於 MACD 指標。
優點 獨特的振盪計算方法 可用按鈕停用或啟用特定貨幣行 資訊表 2 種類型的警報:當指標線交叉時和當指標線交叉指定水平時。 繪製的條數是可選的。
讓我們詳細看看每一點: 獨特的振盪計算方法使指標不會長時間保持在最大值,而是提前退出它們,類似於熟悉的背離和收斂效果。 該方法還包括指定的計算週期和讀數的平滑程度,這使得讀數更加平滑。 計算中不包含不必要的混亂和不必要的冗餘公式,因此減少了終端的負載。 使用按鈕來停用或啟用特定貨幣行是最方便的功能之一,因為它可以讓您擺脫未使用的貨幣,或者只是在視覺上提高您的可見性。 資訊板是該指標的另一個便利功能;它不僅反映了線條的數值讀數,還反映了高級 TF 的讀數。 此外,還有最後走勢方向的箭頭,以及指示哪些貨幣交叉的垂直配對符號。 最後的運動箭頭記錄了倒數第二根柱上的運動 - 這是一個非常方

Accurate Gold 指标是一款用户友好的工具, 无论交易者的经验水平如何,都具有直观和简单易用的特点。它专为在黄金市场上寻找M5时间框架上精确信号的交易者而设计。该指标采用先进的数学算法来分析价格波动和成交量动态,生成准确的买入和卖出信号。该指标的独特特点,包括其不重绘的性质,为交易者提供了有关潜在市场反转的宝贵见解,从而支持明智的决策。它在图表上的视觉呈现,以及听得见的警报和推送通知,提升了用户体验,使其成为寻求交易策略精准性和可靠性的黄金交易者工具包中的有价值的补充。 $ XX – 在限定时间内,前 5 位支持者的价格为 $ XX 。 ( % 已售罄)
88 美元 —— 此后,它将恢复到 88 美元的发行价,并且仅限于金色符号。
88 美元 + X ($100) – 每购买 3 次后价格就会增加 100 美元。 在此查看 MT5信号 ,论坛讨论请点击 这里 。
建议: 时间框架:仅限M5 货币对: 仅限 XAUUSD 账户类型:ECN、Raw或Razor,具有非常低的点差 经纪商时间:任何时间 经纪商:IC Markets、P

Compared to simple or exponential moving averages, slow adaptive trend lines might offer a more nuanced view of the trend by adjusting their sensitivity based on market conditions. However, their slow nature might also mean they are late in signaling reversals when market conditions change rapidly - and that is the difference between them and our SlowAMA .
SlowAMA was designed to be a better long-term trend indicator than EMA and other Moving Averages. It uses our JurMA calculations, reducing

HAshi-E is an enhanced way to analyze Heiken-Ashi signals.
Briefing:
Heiken-Ashi is particularly valued for its ability to filter out short-term volatility, making it a preferred tool for identifying and following trends, helps in decision-making regarding entry and exit points, and assists in distinguishing between false signals and genuine trend reversals. Unlike traditional candlestick charts, Heiken-Ashi candles are calculated using average values of previous bars, creating a smoother, mo

扫描模式 是尖端工具,旨在以无与伦比的准确性识别看跌趋势旋转和看涨趋势旋转,
使您能够做出明智的交易决策并领先市场一步。 MT4 版本 : WH Sweep Pattern MT4 扫描模式特点:
它使用不同的颜色和样式自动检测并在图表上绘制看跌和看涨趋势旋转。 它会向您发送警报(声音、电子邮件、推送通知)并在您的图表上绘制箭头,这样您就不会错过任何交易信号。 它适用于任何货币对、时间范围和市场状况,为您的交易提供了一个多功能且可靠的工具。 使用可定制的参数根据您的特定交易偏好定制指标。
不要让市场轮动让您措手不及 – 今天使用扫描模式指标增强您的交易策略,您可以轻松发现看跌趋势反转或看涨趋势反转,
无论您是经验丰富的交易者还是新手, 该工具都将提升您的市场分析能力,并帮助您在动态的交易世界中做出明智的决策。
立即下载扫描模式指标并掌控您的交易旅程。
**购买后联系我了解更多细节和华丽**

隆重推出 Algo Map Lite – 一款旨在彻底改变您的交易体验的尖端软件。这种先进的工具与您的交易会话无缝集成,在每种情况下提供全面的突破水平分析。
除了直观的界面和实时关卡打印功能之外,Algo Map Lite 还通过结合细致的胜率指标来强化其性能主张,从而脱颖而出。我们对透明度和可靠性的承诺体现在我们从过去 1000 笔交易的广泛数据集中得出的令人印象深刻的胜率:
- 以 1/1 的风险回报比实现 85% 以上的卓越胜率。
- 表现出惊人的 65%+ 胜率和 1/2 的风险回报比。
- 提供 50% 的强劲胜率和 1/3 的风险回报比。
- 以 1/4 的风险回报比保持稳定的 40% 胜率。
对于新手交易者来说,这些统计数据代表了他们交易决策无与伦比的准确性和信心。 Algo Map Lite 确保了安全的交易环境,让用户知道这些胜率是根据大量样本精心计算出来的。
体验 Algo Map Lite 的变革力量,旨在满足经验丰富的专业人士和新手的需求。我们的承诺不仅限于令人印象深刻的胜率; Algo Map Lite 具有不重画、不卡顿、零延

我们的目标,是让每一个交易者都拥有真正属于自己的交易系统。
指标 --- 红绿系列 极致简单,红涨绿跌!可以单独使用,也可以搭配其他指标使用。 这是一个两条均线交叉的红绿指标。我们还有更多,将会陆续添加, 请购买的朋友务必在购买后联系我们。
在金融交易的世界里,每个市场参与者都必须直面一个不可回避的事实,那就是不确定性。无论是市场的短期波动,还是长期的趋势变化,都充满了未知和变数。然而,对于那些深谙交易之道的人来说,处理这种不确定性的秘诀之一就是 “做减法”。 做减法,顾名思义,就是简化复杂的交易逻辑和决策过程。在瞬息万变的交易市场中,过度思考和犹豫不决往往是交易者的大敌。通过化繁为简,交易者可以更快地做出反应,更有效地捕捉市场的脉动。这种简化的过程,就像是把一张复杂的地图浓缩成一张简略的路线图,虽然舍弃了一些细节,但却能让人更快地找到目的地。 为此,我将致力于打造一个独特的红绿指标系统。这种指标并非基于传统的、复杂的金融数据分析,而是将核心的交易逻辑简化成了一目了然的红色和绿色。红色代表市场的上涨趋势,绿色则代表下跌趋势。这样的设计,不仅使得交易决策变得简单明了,而且极大地降低

解锁您交易的潜力,使用AlphaWave指标! 为您的交易带来平静: AlphaWave指标旨在通过平滑图表并提供精确的趋势方向可读性来使您的交易更加平静。以前从未如此轻松地做出明确的交易决策。 具有10种模式的革命性平滑技术: 通过AlphaWave指标体验平滑而清晰的图表表示。这种革命性的平滑技术不仅提供了一种模式,而且一共有10种模式,将您的交易体验提升到一个新水平。选择最适合您交易风格的模式。 适用于任何资产的可定制性: AlphaWave指标最佳地适应每种资产,允许多方面应用,并支持您在不同市场中。在每个交易工具上释放潜力。 上涨和下跌趋势的定制警报: 享受额外的重要功能!AlphaWave指标为上涨和下跌趋势提供定制警报。再也不要错过关键的交易时刻,放心交易。 创新的Heiken-Ashi启发: 受到Heiken-Ashi蜡烛的启发,AlphaWave指标采用创新的公式。传统的蜡烛数据被转换成清晰显示趋势方向的彩色条。这是您交易中的技术突破! 精准的进出点: 由于可靠的信号和精准的趋势指标,AlphaWave指标允许识别最佳的进出点。 持续的支持和更新: 我们不仅提供出色

How many times have you looked for a PIVOT that works on a specific timeframe every day?
Many traders like to estimate the direction of the day's trend based on a specific time interval every day, such as from 2 hours before the NYSE opens to 1 hour after, or from the NYSE opens to 30 minutes after.
This indicator allows you to specify a certain time interval (hour and minute) and plots a pivot from that interval to the next day in the same time interval. It shows five lines based on this: me

Subscribe to the 'MA7 Trading' channel to receive notifications about new programs, updates and other information. Ask questions in the profile on the MQL5 .
Description of work
The 'MA7 Flax' indicator is based on the standard Average True Range (ATR) indicator and candle data. Shows candles that are larger in size relative to the ATR indicator value. Detailed information about the 'MA7 Flax' indicator.
Indicator settings
General settings: ATR period – Average True Range indicator period; AT

Subscribe to the 'MA7 Trading' channel to receive notifications about new programs, updates and other information. Ask questions in the profile on the MQL5 .
Description of work
The 'MA7 Viola' indicator is based on the standard Moving Average (MA) indicator. Shows a sharp increase or decrease in the moving average. Detailed information about the 'MA7 Viola' indicator.
Indicator settings
General settings: Difference – difference between the last two MA values, percentage; Period ; Method ; Ap

我们把RSI指标的一个用法写成了指标,并用红绿柱线表示,非常的简单有效。 您只需要按照填入RSI的参数,即可获得红绿柱线的RSI指标。 将RSI指标的一个用法扩展成一个功能强大的新指标,并通过红绿柱线形式直观呈现,无疑是金融技术分析领域的创新之举。红绿柱线的设计独具匠心,使得投资者能够一目了然地掌握市场动态。当柱线呈现绿色时,表明市场处于相对稳定的阶段;而当柱线转为红色时,则意味着市场可能出现波动。这种直观的视觉效果,不仅简化了分析过程,还大大提高了决策效率。
该指标的实用性也得到了充分验证。通过回溯测试和实时数据分析,我们发现它能够准确地预测市场的转折点,为投资者提供了宝贵的交易信号。此外,该指标的参数可根据不同市场和资产类型进行调整,以适应各种投资环境。
它不仅继承了传统RSI指标的优点,还通过创新的设计和功能优化,实现了更加精准、高效的市场分析。

RSI Barometer Pro 通过使用红条和绿条表示RSI值,这一创新指标为交易员和投资者提供了对市场情绪和潜在趋势逆转的直观见解。
RSI Barometer Pro中的红色和绿色条纹设计非常注重细节,在视觉上展现了市场动态。当条形图显示为绿色时,表明RSI低于50,表明市场处于相对稳定的阶段。相反,当条形图变红时,表示RSI高于50,表明潜在的市场波动性。这种直观的视觉效果简化了分析过程,使用户能够快速掌握市场情况并做出明智的决策。
RSI Barometer Pro经过严格的测试和实时数据分析,证明了其在预测市场转折点方面的非凡准确性。这种准确性为交易员和投资者提供了有价值的交易信号,增强了他们有效驾驭市场的能力。
此外,RSI Barometer Pro提供可定制的参数,以适应各种市场条件和资产类型。这种灵活性允许用户根据其特定的交易策略和偏好对指标进行微调,确保不同投资环境下的最佳表现。
通过利用传统RSI指标的优势,并结合创新的设计和功能优化,RSI Barometer Pro为精确高效的市场分析树立了新标准。它使交易员和投资者能够全面了解市场趋势,从而及时

The implementation of the Trend Turn trend indicator is simple - in the form of lines of two colors. The indicator algorithm is based on standard indicators as well as its own mathematical calculations.
The indicator will help users determine the direction of the trend. It will also become an indispensable advisor for entering the market or closing a position. This indicator is recommended for everyone, both beginners and professionals.
How to interpret information from the indicator. We sell

产品描述:
RSI动量指标是一种先进的指标,它将传统的超买和超卖信号概念从RSI(相对强度指数)转换为使用红色和绿色条的直观表示。这一创新指标旨在为交易员和投资者提供可操作的见解,提供对市场状况和潜在趋势逆转的清晰评估。
RSI动量指标的独特之处在于其颜色编码的红色和绿色条,它们有效地描述了市场中的超买和超卖情况。当条形图显示为红色时,表示出现超卖情况,表明市场可能已经成熟,可以进行潜在的向上调整。另一方面,当条形图变绿时,标志着超买状态,这意味着市场可能会出现潜在的向下修正。这种可视化表示简化了分析,使用户能够快速识别战略进入或退出的机会。
RSI动量计的实用性和可靠性已通过严格的测试和实时数据分析得到广泛验证。它准确地识别超买和超卖情况,为交易员和投资者提供有价值的交易信号,以便做出明智的决策。
RSI动量表提供可定制的参数,允许用户调整指标以适应不同的市场条件和资产类型。这种灵活性确保了在各种投资环境中的适应性,并使用户能够根据其特定的交易策略和偏好对指标进行微调。
通过利用RSI指标的优势,并结合创新的红绿条设计,RSI动量指标彻底改变了超买和超卖信号的解读方式。它

Pips on Candles shows the number of pips involved in each candle on the chart. It is possible to set 3 different ranges for counting on each single candle via the RangeType parameter: With "HighLow" you count the pips present between the minimum and the maximum. The number is shown under each candlestick on the chart. With "OpenClose" you count the pips present between the opening and closing price of the candle. The number is shown under each candlestick on the chart. With "HighDistAndLowDist"

The Lyxes indicator is designed to detect price trends and allows you to quickly determine not only the direction of the trend, but also understand the levels of interaction between buyers and sellers. The indicator works on all timeframes and currency pairs. The indicator gives fairly accurate signals and is commonly used in both trend and flat markets. It is advisable to use the indicator in conjunction with other tools for more reliable signals and more informed decisions. The indicator does

The Reversal Trend indicator was created on the basis of the original indicators for searching for extremes, the indicator is well suited for determining a reversal or a large sharp jerk in one direction, thanks to it you will know when this happens, it will notify you by the appearance of a blue dot to buy red to sell.
It is based on the process of identifying the rate of change in price growth and allows you to find entry and exit points from the market.
a fundamental technical indicator th

The Antique Trend Indicator is a revolutionary trend trading and filtering solution with all the important features of a trend tool built into one tool! The Antique Trend indicator is good for any trader, suitable for any trader both for Forex and binary options. There is no need to configure anything, everything has been perfected by time and experience, it works great during flats and trends.
The Antique Trend indicator is a tool for technical analysis of financial markets, reflecting curren

The Plasma Trend indicator is a simple technical indication that is used to determine the current trend direction in the market. The Plasma Trend indicator is a powerful tool for determining the direction of the trend in the Forex market. It is based on both standard technical indicators and proprietary mathematical calculations, which provides a more accurate and reliable trend determination. Its implementation in the form of lines of two colors simplifies the visual determination of a change

Subscribe to the 'MA7 Trading' channel to receive notifications about new programs, updates and other information. Ask questions in the profile on the MQL5 .
Description of work
The 'MA7 Galega' indicator is based on the standard Moving Average (MA) indicator. Shows a puncture of the moving average. Detailed information about the 'MA7 Galega' indicator.
Indicator settings
General settings: Period – MA period; Method – MA method; Apply to – price type; Consider the direction of the candle .
M

Make no mistake, this is not just another indicator; it's much more than that! Welcome to a groundbreaking approach! Sunrise Divergence is not just another tool; it represents a deep understanding in how market dynamics are analyzed and traded. This indicator is crafted for traders who seek to navigate the markets with precision, leveraging the powerful concept of asset correlation, both positive and negative, to unveil trading opportunities that many overlook. In the markets, understanding the

Subscribe to the 'MA7 Trading' channel to receive notifications about new programs, updates and other information. Ask questions in the profile on the MQL5 .
Description of work
The 'MA7 Ixora' indicator is based on the standard Moving Average (MA) indicator. Shows the intersection of the fast and slow moving averages. Detailed information about the 'MA7 Ixora' indicator.
Indicator settings
General settings: Consider the direction of the candle .
Fast moving average settings: Period – MA per

MACD直方图指标是MACD指标的更新版本,旨在使交易者更容易理解市场趋势和动量变化。与原始MACD不同,此版本包括一个直方图,该直方图是显示两条线之间差异的条形图:MACD线和信号线。 它的工作原理如下:当MACD线高于信号线时,表明市场看涨,直方图条显示为绿色。另一方面,当MACD线低于信号线时,表明市场看跌,直方图条变为红色。 MACD直方图指标的有趣之处在于,当市场动量发生变化时,条的颜色也会发生变化。因此,当从看涨动量转变为看跌动量时,条从绿色变为红色,反之亦然。 另一个有用的功能是,它使检测价格运动和MACD指标之间的差异变得更加容易,突出显示可能的差异,这可能表明市场的潜在反转。 该指标还可以根据用户的偏好隐藏MACD线和信号线以及直方图,从而增强指标的自定义性和灵活性。 总之,MACD直方图指标为交易者提供了一种更简单的市场趋势分析方法,通过清晰的视觉信号和颜色变化帮助做出更明智的交易决策。

Volume Profile เป็นเครื่องมือที่ใช้สำหรับการวิเคราะห์ระดับการซื้อขายของตลาดในแต่ละระยะเวลาโดยใช้ปริมาณการซื้อขาย (volume) ซึ่งช่วยให้เราเข้าใจว่ามีการซื้อขายเกิดขึ้นมากที่สุดที่ราคาใด รวมทั้งช่วยในการหาจุดที่มีความนิยมในการซื้อขาย (Point of Control: POC) และระดับการซื้อขายอื่น ๆ ที่สำคัญ เรียกว่า Value Area. การใช้งาน Volume Profile ในการวิเคราะห์ตลาดมักจะมีขั้นตอนดังนี้: กำหนดระยะเวลาที่ต้องการวิเคราะห์ : เราต้องกำหนดระยะเวลาที่เราสนใจในการวิเคราะห์ Volume Profile เช่น ชั่วโมง, วัน, หรือสัปดาห์

The indicator plots up/down buffer arrows in the chart window two of the following indicator conditions are met. Moving Average ; Moving Average Convergence/Divergence (MACD ); Oscillator of Moving Averages (OsMA ); Stochastic Oscillator ; Relative Strength Index (RSI) ; Commodity Channel Index (CCI) ; Relative Vigor Index (RVI ); Average Directional Index (ADX) ; Triple Exponential Average ; Bollinger Bands ;
ตัวบ่งชี้จะพล็อตลูกศรขึ้น/ลงในหน้าต่างแผนภูมิเมื่อตรงตามเงื่อนไขของตัวบ่งชี้สองตัวต่อ

"Support and Resistance" is a fundamental concept in technical analysis for trading stocks, currencies, or other assets in financial markets. Here's how to use it: Identifying Support Support is a price level where buying is strong. When the price drops to this level, there tends to be significant buying activity, preventing the price from falling further. Identifing Support: Look for the lowest points in a given period and find levels where the price has bounced back up multiple times. Usage:

The VIDYA-ENHANCED indicator (Variable Index Dynamic Average) is a technical analysis tool used to identify trends and sideways movements.
It dynamically adjusts its sensitivity based on market volatility, using the Chande Momentum Oscillator as a volatility index. This feature allows VIDYA-ENHANCED to be more agile during periods of significant price movements, while remaining more stable during less volatile phases.
Features:
- Select the price from 12 options - 5 more than the Metatrader

和谐图案最适合预测市场转折点。和谐图案为您提供高胜率和一天内的高交易机会。 该指标识别了最受欢迎的和谐图案,这些图案预测市场反转点。 基于和谐交易书籍。 重要说明: 该指标不会重绘或滞后(它在D点检测到模式);它不会重新绘制(模式要么有效,要么取消)。 使用方法: 将指标拖放到您的MT5图表上。 将模式检测设置为TRUE(ABCD; Gartley)。 根据您的喜好调整偏差(较大的偏差=更多的模式;较小的偏差=更少的模式)。 根据您的喜好自定义颜色。 根据需要启用或禁用关于入场点、TP和SL的警报。 检测到模式时: 该算法在D点检测到模式。 如果启用了警报,它将通知您检测到的模式。 如果模式无效,则触发一个带有“模式已取消”消息的警报。 成功的模式在蜡烛关闭时触发“入场警报”。 如果价格达到TP1、TP2、TP3、TP4或SL,则会发出带有终端消息的警报。 价格现在为40美元,仅剩下几份副本,最终价格将为70美元。 发展计划: 该指标的当前版本(1.1)将检测Gartley和ABCD模式。 版本1.1将包括Butterfly、Bat和Crab模式。 未来版本将包括其他模式、潜在PRZ检

Subscribe to the 'MA7 Trading' channel to receive notifications about new programs, updates and other information. Ask questions in the profile on the MQL5 .
Description of work
The 'MA7 Aster' indicator is based on the standard Moving Average (MA) indicator. Shows the price deviation from the moving average. Detailed information about the 'MA7 Aster' indicator.
Indicator settings
General settings: Period – MA period; Method – MA method; Apply to – price type; Minimum distance – minimum dista
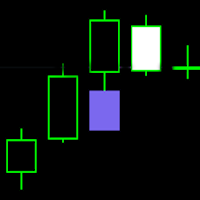
FVG - Fair Value Gap indicator is a three candle pattern indicator . It find inefficiencies or imbalances in market. It act as magnet before continue the trend.
indicator key function
1. No object is used to draw the plot. You can use this to build EA and backtest also.
2. Min and max value to Filter-out the noises .
It use as retest zone and can be use as entry price also. It popular among price action traders. your suggestion and comments are welcome and hopping that you will find this hel

Subscribe to the 'MA7 Trading' channel to receive notifications about new programs, updates and other information. Ask questions in the profile on the MQL5 .
Description of work
The 'MA7 Hypnum' indicator is based on the standard Commodity Channel Index (CCI) indicator. Shows overbought and oversold zones. Detailed information about the 'MA7 Hypnum' indicator.
Indicator settings
General settings: Period – period of the CCI indicator; Apply to – price type for calculating the CCI indicator; Up

This indicator is created for traders who realized the need to study fundamental changes in the economy on global trends of world markets. Understanding that there are no easy ways in the world of big money, your odds. Secret Fairway indicator is designed as a universal tool in the arsenal of trader, analyst, investor. With it, you can create your own dashboard that reflects your views on economic theory and practice. By evolving with each transaction, each read book, article, and every entry

Airplane Trend entry points should be used as potential market reversal points. The indicator works using the cyclic-wave dependence function. Thus, all entry points will be optimal points where the movement changes.
The simplest way to use the indicator is to open a trade in the direction of an existing trend. The best result is obtained by combining the indicator with fundamental news, it can act as a news filter, that is, it can show how the market reacts to this or that news.
The defa

The Mah Trend indicator was created on the basis of the original indicators for searching for extremes, the indicator is well suited for determining a reversal or a large sharp jerk in one direction, thanks to it you will know when this happens, it will notify you with the appearance of a blue dot to buy red to sell.
This is a fundamental technical indicator that allows you to assess the current market situation in order to enter the market of the selected currency pair in a trend and with min

Cryo is based on the process of identifying the rate of change in price growth and allows you to find entry and exit points from the market. A fundamental technical indicator that allows you to assess the current market situation in order to enter the market of the selected currency pair in a trend and with minimal risk.
The Cryo indicator was created on the basis of the original indicators for searching for extremes, the indicator is well suited for determining a reversal or a large sharp jer
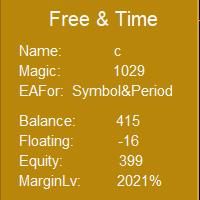
这个指标可以利用 EAMagic 来统计EA运行以来的收益数据和现在在交易的单量和交易数据统计,现在是第一版,后续应该会慢慢更新。使用时必须在加载时输入EA 的 Magic的号码,才能接收到EA的交易数据。其中输入的货币对和周期那部分,使用者可以填写以用来更加清晰的明白现在在交易的货币对和周期,同时方便截图分享交易的成果。 后续的版本中,会根据实际的使用体验减少或者增加功能,希望这个指标简洁有效是我的目标。设计的驱动力是自己更加简单清晰地了解EA的使用情况和方便的了解当前账户的使用情况。我也希望购买者能给我表达你想要的功能和想法,把这个指标进化得更完善些,但我不一定会更新到指标中,因为我发现很多功能其实并不是需要的,如非必要,勿增实体。 这个指标是EA编写中的意外产物,希望自己的EA也能写出来吧,go!go!go!!
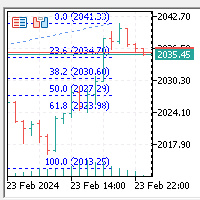
This indicator automatically generates Fibonacci regression lines in the K-line window: 0.0%, 23.6%, 38.2%, 50.0%, 61.8%, and 100.0%, following the displayed price. Zoom In, Zoom Out, Time Frame (M1, M5, M15, M30, H1, H4, D1, W1, MN) can automatically update and generate when the cycle changes, with the highest price worn up and the lowest level broken down. Both upward and downward trends can automatically adjust the direction of the Fibonacci regression line.

亲爱的外汇交易者, 我很高兴向您介绍GoldenCeres指标,这是我们过去一年交易旅程中的重要工具。我最亲密的朋友和我一直在使用这个指标成功地导航外汇市场,现在我们迫不及待地想与MQL5社区分享它。 GoldenCeres是一个直观且用户友好的指标,专为有一些外汇交易经验的交易者设计。它直接在图表上提供清晰的买入或卖出信号,简化决策过程,没有任何延迟。此外,它提供了一个推荐的TakeProfit水平,以图表上的小紫线表示。可以使用我们命名为“风险水平”的输入变量来自定义此推荐水平的准确性。 “风险水平”变量的范围从1到20。1的值表示保守策略,击中TakeProfit水平的概率很高,但奖励相对较小。10的值表明平衡的方法,有很好的机会击中TakeProfit水平并获得体面的奖励。20的值代表了一种激进的策略,击中TakeProfit水平的可能性较低,但潜在的奖励显著增大。 GoldenCeres专为XAUUSD 30分钟图表设计,尽管它可以应用于其他XAU图表。请注意,由于它针对30分钟的XAUUSD图表进行了优化,因此其在不同时间框架上的性能可能会有所不同。 我们致力于持续改进,
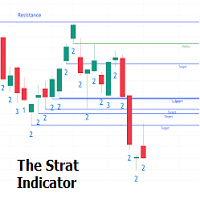
The Strat indicator is a full toolkit regarding most of the concepts within "The Strat" methodology with features such as candle numbering, pivot machine gun (PMG) highlighting, custom combo highlighting, and various statistics included.
Alerts are also included for the detection of specific candle numbers, custom combos, and PMGs.
SETTINGS
Show Numbers on Chart: Shows candle numbering on the chart.
Style Candles: Style candles based on the detected number. Only effective on non-line

指标 显示“支撑”和“阻力”线(这些线是使用 DRAW_LINE 绘图样式绘制的 - 也就是说,它们不是图形对象)。 对新最小值和最大值的搜索是在“信号条”的左侧和右侧执行的 - “信号条”是每个新构造的常规中间。 为什么指标名称中包含“灵活”一词?因为我们可以指定“信号条”左侧(“左条”)和右侧(“右条”)不同数量的条。 指标线在图表上从“信号条”到“右条”条的右侧绘制。 特征 : 为了在指标中显示更美观,使用了两个“支撑”缓冲区和两个“阻力”缓冲区(该技术解决方案与 MQL5 中绘制样式的限制有关)。 未来可能出现的情况 : 声音警报或(和)新指标缓冲区(箭头)。 如何使用该指标 : 该指标主要是为手动交易而创建的,因此用户只需监控两个指标缓冲区“支撑”和“阻力”以及当前价格。应特别注意价格突破指标线然后返回的时刻(几根柱线之后)。
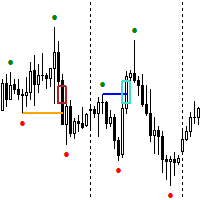
YouTube Channel: https://www.youtube.com/@trenddaytrader FREE EA for GOLD , Anticipation can be found here: https://www.mql5.com/en/market/product/123143
The Expert Advisor for this Indicator can be found here: https://www.mql5.com/en/market/product/115476 The Break of Structure (BoS) and Change of Character indicator with Fair Value Gap (FVG) filter is a specialized tool designed to enhance trading strategies by pinpointing high-probability trading opportunities on price charts. By

实时多币种波动扫描器 你好,交易者。 我向您介绍一种独特的解决方案 - 实时多币种波动扫描器。 这个指标是我多年个人市场观察的结果之一。 它解决了交易者遇到的几个关键痛点: 实时波动跟踪: 消除了不断刷新或切换图表以查看重要动态发生位置的需要。 理解国际关联: 自动识别一种货币对的运动如何预示其他货币对的变化,简化了市场预测。 工作空间简化: 扫描器消除了打开多个窗口和选项卡的需要,将所有内容合并到一个便捷的界面中。️ 发散检测: 通过分析货币对之间的差异帮助交易者识别潜在的逆转和趋势的开始。 节省时间: 减少了分析和市场监控所花费的时间,使交易者能够专注于策略的制定和执行。 增强决策信心: 为交易者提供了更多的数据和洞察力,以便进行更明智的交易决策。 与交易策略轻松集成: 扫描器可以轻松融入任何现有的交易策略中,为其增加宝贵的数据,无需进行重大更改。️ 该工具旨在使所有级别的交易者的交易更加直观、高效和有利可图。

Graphic Shapes -using history, it projects four types of graphical shapes at the moment, allowing you to determine the main ranges of price movement in the future, as well as gives an understanding of the main market reversals, while giving entry points by priority!The panel contains three types of figure sizes expressed by timeframes. They allow you to conduct a complete market analysis without using additional tools! The indicator is a powerful tool for forecasting price movements in the forex
MetaTrader市场是 出售自动交易和技术指标的最好地方。
您只需要以一个有吸引力的设计和良好的描述为MetaTrader平台开发应用程序。我们将为您解释如何在市场发布您的产品将它提供给数以百万计的MetaTrader用户。
您错过了交易机会:
- 免费交易应用程序
- 8,000+信号可供复制
- 探索金融市场的经济新闻
注册
登录