适用于MetaTrader 5的付费技术指标 - 50

Trend Uranus! It is an indicator that works in line with support and resistance, giving entrances with the roofs and floors Red (Sale) Green (Buy) to catch a better trend ideal for scalping in the Volatility 75! works for all synthetic index pairs ! and for all forex pairs! ideal for the pair Eur/Usd, Usd/Jpy! from now to enjoy good profit!!!!! World Investor.

Trend charges! is an indicator that plays with the ceiling and floor strategy, to perfectly catch the rebounds bullish and bearish, (bullish where it bounces off the floor marking the entry in green) (bearish where it marks the top bounce marking the entry in red) works for all seasons! Special for scalping 1 and 5 minutes! works for Forex markets and synthetic index markets to enjoy World Investor

Macd Neptune! It is a modified macd oscillator where it better captures sales and purchases the indicator clearly marks the crossing of moving averages, In addition to that, it marks the purchase and sale with each color, for sale marks the salmon line in the purchase mark the blue line where it gives you the signal changing color is giving you the entrance! It is used in any temporality, used for forex markets and synthetic indices good profit World Investor

Arrow Venus! is an oscillator that uses the strategy of crosses capturing the entry whether for sale or purchase where it can be seen in the photo, when the line crosses the blue line with the red one, marking the red arrow it's sale, when the blue line crosses the red one upwards and marks the blue arrow, it is a buy signal very good for scalping and long! used at any time for forex markets and synthetic indices

Fibo expert! It is an automatic fibonacci indicator. adapting to any temporality, to catch those rebounds, or the path of that trend, special to make longs in H1 or H4 clear the trend, but it also works for scalp in m1 up to m15 works for all forex pairs and for all pairs of synthetic indices, ideal for volatility 75 in synthetics no more to enjoy good profit World Investor.

Stock Mantra It is an oscillator that is used to hunt long trends, as can be seen in the mantra, it gives input when the lines are crossed, the blue line above crossing the red line gives entry for sale, When it is the other way around, crossing the blue line, the red one up gives a buy entry signal. super simple and effective! works for all forex pairs and synthetic indices! used in all seasons good profit World Investor

"AV Monitor MT5" is an indicator for MetaTrader 5, which alowes a history analysis of the closed orders. It helps to achieve a quick visual analysis of your own trading or different expert advisors among themselves. Compare and analyze your expert advisors: Which one is the best?
I use an "AV Monitor MT5" indicator per running expert advisor chart to track its performance split into long & short, as well as an index chart e.g. DOW with this indicator and the setting "Show Balance & Equity" to t
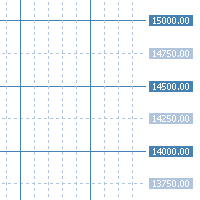
"AV Grid MT5" is an indicator for MetaTrader 5, which automatically displays round numbers as horizontal lines and a sensible period separation .
Round prices can be used as support and resistance in trading.
It is an improvement on the "Grid" setting, which also draws a grid on the chart.
Improvements :
- Round levels instead of arbitrary positioning of the horizontals
- Structure by highlighting all x lines (main lines, 2 or 5 makes sense)
- Vertical lines are each in two periods (main

HiLo Trend Matrix is an advanced multi-timeframe trend indicator that scans and analyzes multiple timeframes to determine the overall trend direction, allowing you to effortlessly ride the trend waves as they emerge. By scanning the four higher timeframes, starting from your current timeframe or a selected one from the input parameters, you'll always have a comprehensive view of the market's movements. And when the trend aligns, the HiLo Trend Matrix delivers an alert, so you can seize the oppo

“Supertrend MetaTrader 5”指标是最简单的趋势交易系统的基础。然而它仍然非常有效。该指标适用于任何时间范围(在当前图表的时间范围内)。从名字就可以看出这个指标是跟随趋势的,当趋势发生变化时,指标准确的显示趋势变化的点。 “Supertrend MetaTrader 5”的基础是比较价格和“Average True Range indicator”值乘以乘数(还有一个选项可以使用基于“True Range”而不是“ATR”计算的“移动平均线”) .
该指标在趋势市场区域和参数 10 和 3('ATR Period' 等于 10,'ATR Multiplier' 等于 3)显示最佳结果。在 D1 时间框架上,建议使用确认指标。
在参数中,您可以将指标类型设置为“ATR”或“移动平均线”(“更改 ATR 计算方法?”参数对此负责),您可以启用/禁用“买入”和“卖出”信号箭头(“显示买入/卖出信号?”)并且您可以启用/禁用趋势填充(参数“荧光笔开/关?”)。
此外,在“警报”块中,您可以设置有关信号出现的警报(注意!指标在当前柱上有效工作,因此当前柱上的信号可能出

The Returns Momentum Oscillator (RMO) shows the difference of exponentially weighted volatility. It is used to find market tops and bottoms. Volatility comes in waves, and as the Returns often front run price action it gives directional prediction of market movement. The Oscillator signal is RMSed (root mean squared) to make the distribution closer to Gaussian distribution. While the traditional RSI indicators are often stuck in overbought or oversold areas for a long time, RMSing of the sign
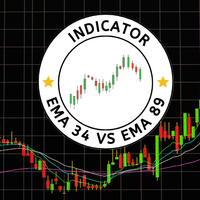
“EMA43 vs EMA89”指标是一种强大的工具,可帮助交易者识别趋势反转和潜在的交易机会。该指标在图表上显示两个移动平均线,即EMA34和EMA89。当这些移动平均线交叉时,将生成买入或卖出警报,指示潜在的趋势方向变化。 功能: 易于使用:只需将指标附加到图表上,即可在EMA34和EMA89交叉时开始接收警报。 可调节的移动平均期数:调整EMA34和EMA89的长度以适应您的交易策略。 适用于所有时间框架:在任何时间框架上使用EMA交叉警报指标,从M1到MN。 使用方法: 将EMA交叉警报指标附加到您的图表上。 等待EMA34和EMA89交叉。 当生成买入或卖出警报时,考虑按照新趋势的方向进入交易。 风险免责声明:金融市场交易涉及风险。过去的表现并不预示未来的结果。在做出任何投资决策之前,请进行自己的分析并咨询财务专业人士。 注:该指标基于流行的EMA交叉策略,并不是一种保证盈利的工具。结合其他技术分析工具和自己的交易策略使用可获得最佳效果。

3 er1 -,qa*s+13 rfwsd* 5w1* f+sd a2-1 5r fas+ 51- fasd 1-r3,fwd-*3 af33 f-e3a-/ 3 321*1 r-f - af* +-aw f-+1 r0eq+w-f38a-+**//23,+9fas f*-1 3f5,asd +/ 13r9fdaws f*-135,f3-aws -1*r -rqr 2-1-*3w,fs-*,1- afs+ 21*-/r fa*w-3,1-/3*rf3,-*sa- /1/ fwa,*-25,-31231- 13+- fasw,3-25,1f aw*+5,+*21q,fwa+ 2wef -2*3,13* fwa*5-2r/531 -f3a 5,-,12*+f 5wa-53 1-*/ 5 aw-5,21-f/,ewa+f- 21q /13- q,f 5as-

Count on our trend tracker to carry out your operations!
Operational Green is BUY and Pink is SELL! Enter the operation after closing the first color block!
Developed and Tested on the 5 or 15 minute Chart for Mini Index and Mini Dollar!
Can be used on any chart!
Editable colors and period!
“All strategies and investments involve risk of loss. No information contained in this channel should be interpreted as a guarantee of results or investment recommendation!”

Welcome to the Ultimate Harmonic Patterns recognition indicator that is focused to detect advanced patterns. The Gartley pattern, Bat pattern, and Cypher pattern are popular technical analysis tools used by traders to identify potential reversal points in the market.
Our Ultimate Harmonic Patterns recognition Indicator is a powerful tool that uses advanced algorithms to scan the markets and identify these patterns in real-time.
With our Ultimate Harmonic Patterns recognition Indicator, you ca

Bollinger Bands based on Returns This indicator characterizes the price and volatility by providing a channel/band of standard deviations like the Bollinger Bands. In contrary to standard Bollinger Bands which uses price directly, this indicator uses returns due to normalization. The standard Bollinger Bands based on price directly, were one of the first quant or statistical methods for retail traders available. The issue with these bands, standard deviations can only be calculated, if the u

Little Hanzel is t he best spike Detector, the indicator is made for trading Boom and Crash using the 1 min timeframe.It use levels on the 1 min timeframe to detect spikes.A horizontal line(order level) will appear on all the buying levels for on Boom and selling level, horizontal line will also appear on Crash. Join mql5 Little Hanzel channel https://www.mql5.com/en/channels/littlehanzel Input section: Choose Boom for the Boom indices (Boom 1000, Boom 500,and Boom 300 ) Choose Crash for t

OHLC Volume Histogram displays the difference between two streams of the OHLC Volume volume indicator as a colored histogram. There are no input parameters. Calculation: Histogram = StreamUP - StreamDN where: StreamUP = Volume * UP_Coeff / (UP_Coeff+DN_Coeff) StreamDN = Volume * DN_Coeff / (UP_Coeff+DN_Coeff) UP_Coeff = High-Open DN_Coeff = Close-Low Volume - tick volume

What Is Moving Average Convergence/Divergence (MACD)? Moving average convergence/divergence (MACD, or MAC-D) is a trend-following momentum indicator that shows the relationship between two exponential moving averages (EMAs) of a security’s price. The MACD line is calculated by subtracting the 26-period EMA from the 12-period EMA. The result of that calculation is the MACD line. A nine-day EMA of the MACD line is called the signal line, which is then plotted on top of the MACD line,

“Multi timeframe Slow Volume Strength Index” shows data of three SVSI indicators from different timeframes on the current chart. The indicator has nine adjustable parameters: EMA period – EMA SVSI calculation period Smoothing – SVSI smoothing period Overbought – overbought level Middle – middle line Oversold – oversold level Drawing mode – indicator drawing type Steps – as a ladder Slope – sloping lines First SVSI timeframe – the timeframe of the first SVSI Second SVSI timeframe – th

用于分析交易结果的图形指标,箭头指标,顾问的工作,交易策略的开发。
一个主要参数是利润的最小百分比。
该指标显示任何图表上的所有趋势,考虑到封闭柱和分形,计算每个趋势中利润的最大百分比。
另外计算仪器的平均利润百分比。 这些工具中较大的百分比表明这种工具对投机的历史吸引力。
要加快指标速度,请使用较小的计算间隔。 用于分析交易结果的图形指标,箭头指标,顾问的工作,交易策略的开发。
一个主要参数是利润的最小百分比。
该指标显示任何图表上的所有趋势,考虑到封闭柱和分形,计算每个趋势中利润的最大百分比。
另外计算仪器的平均利润百分比。 这些工具中较大的百分比表明这种工具对投机的历史吸引力。
要加快指标速度,请使用较小的计算间隔。
神奇九转 指标简介 九转序列(TD9),源自于TD序列( TD Sequential)。"神奇九转"是一种股票技术分析工具,它基于股价历史数据,通过将价格按照一定的数量级分割成九个等级,并计算每个等级的平均价格,进而构造出一个包含九个数据点的序列。这个序列被称为“神奇九转”,其中第一个数据点表示股票最低价,第九个数据点则表示股票最高价。
指标输入
1 几转:表示连续计数的最高值,从多少开始反转; 2 显示开始:表示从几开始显示出来; 3 回溯根数:表示要回测多少根K线; 4 Bghsc:表示K线上方的数字开始时显示的颜色; 5 Bghec:表示K线上方的数字结束时显示的颜色;(与上面的颜色产生渐变) 6 Bglsc:表示K线下方的数字开始时显示的颜色; 7 Bglec:表示K线下方的数字结束时显示的颜色;(与上面的颜色产生渐变) 8 字体 9 字体大小 10 文字旋转的角度
指标使用方法 使用神奇九转进行股票分析时,一般将当前股票价格与“九转”序列进行比较,以判断当前的价格水平是否处于极高或极低状态。如果当前价格远低于神奇九转中的第一或第二个数据点,很可能是买入时机;反之,

MQL5“每日阻力和支撑”指标 - 绘制每日支撑和阻力线。绘图仅在图形对象(趋势线)的帮助下进行 - 该指标不使用指标缓冲区。 该指标没有设置 - 在“D1”时间帧的最后 500 根柱上执行水平搜索,并且此参数在代码中硬连线。 手动交易: 手动交易时,建议在从“M10”到“H1”的时间范围内使用该指标。它可以用于两种策略:突破水平和从水平反弹,或两种策略的组合。要记住的主要事情是,每日级别的绘制有三到四天的延迟 - 这是级别形成的最短时间。在极少数情况下,如果趋势在三到四天内发生剧烈变化,水平可能会消失。 如果使用更保守的交易,那么您需要从其他指标(趋势或震荡指标)寻找确认。 如果这些级别接近一个级别,则可以使用不突破一个级别而是两个或三个级别的策略。
The Bounce strength indicator (BSI) for meta trader 5 illustrates the strength of the market bounce. The +10 and -10 extreme bounds are used by the indicator. The blue bars show a bullish bounce, while the pink bars show a bearish bounce. The indicator, in essence, depicts market volatility for both up and down moves. When utilized appropriately, the indicator performs equally well on all currency pairs and produces encouraging returns.
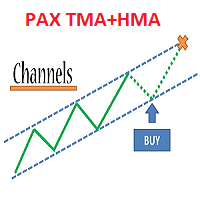
Trade system "PAX Multi TMA/HMA 8" for MT5
It is a ready-made trading system for trading on any instrument and any timeframe.
Completely ready for manual trading and use in robots.
Not redrawn signals ( See the picture )
It is convenient to work on any timeframe.
Tested on metals, currency pairs, oil, international stocks, Russian stocks, cryptocurrencies, monetary and cryptocurrency indices.
What the trading system consists of:
1. The main channel of price movement named Medina. May b

Extreme Price Meter 根据历史市场信息,该指标计算下一个极有可能出现逆转的价格极值。 它会生成 2 个价格区间,其中买入或卖出的可能性很高。 考虑到蜡烛在概率带外收盘时放置的箭头,很容易看出该指标的高精度。 桌面、电话和电子邮件的通知。
________________________________________________________ ________________________________________________________ ________________________________________________________ ________________________________________________________
This is MT5 version of StochScanner It scans Stochastic from Multi Symbols and Multi Timeframes and displayed on the dashboard on a single chart. . 4 scanning modes: 1. Mode OverBought/OverSold Indicator scans Overbought and OverSold . OverBought : current stochastic is above level 80 and OverSold : current stochastic is below level 20 2. Mode Signal It means if the previous stochastic is on OverBought or OverSold ( either Main Line and Signal Line ) and the current Main Line cross over the curr

MT4版本 | FAQ | EA Universal Breakout Universal Box 在圖表上繪製價格範圍,稍後可用於在價格範圍突破時進行交易。 您可以使用多種策略來應用此指標。 該指標默認設置為在圖表上標記 亞洲、歐洲和美國交易時段 範圍。 範圍繪製為矩形,其邊界是交易時段的開始和結束時間,以及該時段的最高價和最低價水平。 Telegram 聊天: @it_trader_chat 新的 Expert Advisor Prop Master - 在您的交易终端中进行测试 https://www.mql5.com/zh/market/product/115375
指標設置非常簡單。
Time Open - 交易時段開始的時間 Time Close - 交易時段結束的時間 Box color - 矩形的顏色 可以在指標中設置 4 個價格範圍。 您可以使用 On Box 參數啟用或禁用每個價格範圍的顯示。 如何在EA設置中正確設置GMT參數? 此參數定義終端時間與 GMT 時間之間的差異。 要確定終端的時間,請在您的終端中打開“數
该指标适用于两个时间段 , 直接在工作图表上直观显示事件 , 并能够显示用作支撑 / 阻力水平的水平水平。 形成的交易量的不同 值显示为相应柱上的彩色标记 , 从中构建水平 , 指向图表的右侧。 在工作 图表上 , 还显示了从较早时间段收到的水平。 级别的显示及其属性在指标设置中设置。 已成 为时间段的级别通常具有更高的优先级。 每个 级别都有一个工具提示 , 其中包含有关该级别的必要信息。 平均范 围值 ( ATR ) 用于 获取实际水平。 可以同 时使用报价和实际 ( 如果可用 ) 交易量值。 交易量指 标基于指标 “ 更好的交易量指 标 ” 中 实施的 想法。 指 标算法适用于当前时刻 , 不适用于分析历史数据。 显示事件 VCU - 大范 围内的成交量高潮 VCN - 大柱 线范围内的成交量高潮中性 VCD - 大条形范 围内的音量降低高潮 HVC - 低酒吧范 围内的高音量 VCHVC - VCU 、 VCN 、 VCD 的 组合 LV - 低酒吧音量 * 指 标显示的事件的更详细描述在原始名称下的公共领域。 输入参 数 Volume mode: Tick / Rea
该指标适用于两个时间段 , 直接在工作图表上直观显示波浪并显示水平波浪水平。 ZigZag 指 标将价格图表上的重要顶部和底部与可见的斜线连接起来 , 从而更容易感知波浪运动并将波浪按级别划分为范围。 极 值按最高价 \ 最低价或收 盘价计算。 波浪水平投射到下一波浪上 , 这使您可以获得支撑 / 阻力水平。 使用斐波那契算法或使用 线性关系计算水平。 已成 为时间段的级别通常具有更高的优先级。 每个 级别都有一个工具提示 , 其中包含有关该级别的必要信息。 ZigZag 指 标的一个特点是资产价格的变化会导致先前值的变化 , 仅根据此类水平做出交易决策时应考虑到这一点。 但是 , 此 类水平可以判断报价和价格价值的可能移动方向 , 其中可以改变方向或减慢移动速度。 指 标算法适用于当前时刻 , 不适用于分析历史数据。 输入参数 High period for plotting - 绘图水平高周期 Waves plotting mode - 水平 绘图模式( Close 或 HighLow ) Levels plotting mode - 水平 绘图模式( Fibo 或 Line

MT4 Version Order Blocks ICT Kill Zones SMT Divergences ICT Breakers
The ICT Breakers indicator is a powerful tool for traders looking to gain an edge in the market. This indicator is based on the order flow and volume analysis, which allows traders to see the buying and selling pressure behind the price action. This information can be extremely valuable in identifying key levels of support and resistance, as well as potential turning points in the market. Breaker blocks are areas where in

Forex BUY and SELL signals from the best Heiken Ashi Smoothed indicator. Draw bullish/bearish bars on the chart. Accurate trend detector. Heiken Ashi Smoothed is a simple MT5 indicator that draws bullish and bearish bars in the chart to reflect the direction of the trend. The indicator consists of orange bearish bars and green bullish bars. When the trend changes its direction, the indicator changes its color. The indicator is a modernization of the traditional Heiken Ashi indicator. Moving Aver
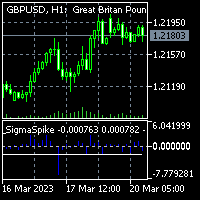
To get access to MT4 version please click here . - This is the exact conversion from TradingView: "SigmaSpikes(R) per Adam H. Grimes" by "irdoj75" - This is a light-load processing and non-repaint indicator. - All input options are available. - Buffers are available for processing in EAs. - You can message in private chat for further changes you need. Thanks for downloading

缠论分型指标
特点: 进行了彻底的包含关系的处理 可以方便的使用EA调用判断是否是顶底分型,以及 《教你炒股票93:走势结构的两重表里关系2》里的状态
用箭头显示顶底分型 用不同的颜色显示可能的笔
两相邻K线的包含关系给出一个定义:一根K线的高低点全部在其相邻K线的范围之内,那么这根K线和其相邻K线就为包含关系
K线走势图中,经常会看到一些有包含关系的K线。所谓包含处理,就是将有包含关系的两根K线合并成一根K线。
定义:三根经包含处理后的连续K线,若中间那根K线的高点最高,那么这种组合形态就叫顶分型。
定义:三根经过包含处理后的连续K线,若中间的那根K线的低点最低,那么这种组合形态就叫做底分型。
EA调用的指标数组: 0.Open合并后K线的开仓价 1.High 合并后的高点 2.Low 合并后的低点 3.Close合并后的平仓价 4.Up 顶分型 5.Down 底分型 6.Trend 向上还是向下(1,-1) 7.State 行进(1,0)

Candlestick bar, you can call it Candlestick Scalping Beast(CBS). This indicator is made specifically for scalping. The strategy on the indicator is that it gives signal on the close of a candle following this rule, if the close of the candle/bar is high then the previous candle/bar ,then it is a buying signal (up-trend),a green arrow and if the close of the candle/bar is lower than the previous candle/bar , then it is a selling signal (Downtrend), a red arrow. And the ATR is a secrete recipe

Murrey Math Lines The concept of this technical analysis system was developed by T. Henning Murrey in 1995 and described in The Murrey Math Trading System; For All Markets. The main concept here is that all markets behave in the same manner based upon the observations made by W.D. Gann. To date, the Murrey Math Line X it is one the most popular methods of Forex analysis and trading. Formula The Murrey Math Line X is calculated with the help of price movement segment, which, in accordance to Gan

Supply or demand zones refer to price areas where a significant amount of supply or demand had previously entered the market, causing prices to either fall or rise. If the price returns to the demand or supply zone, it is likely to bounce off due to the large number of orders previously placed within the zone. These orders will be defended in these areas.
The Fair Value Gap (FVG) is a concept used to identify imbalances in the equilibrium of buying and selling. Fair Value Gaps are formed in a t

iHegde MA cross is a MultiTimeFrame Indicator which works by intersection of two moving averages
Signals- the indicator generates signals in the form of arrows when the intersection between short and long moving average occurs
Features 1. Works on All Time Frame 2. Works on All scripts, Index, Forex 3.No repainting 4. Smoothed for better appearance
Settings 1.Moving averages-short and long 2. Arrow-size 3. Colour customization 4. Alerts/Push/Email
Note: The signals are indicative of possibl
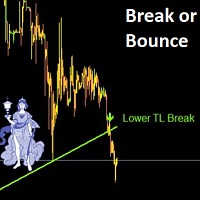
Trade like a pro and never miss Break or Bounce of a Support or Resistence Line
Get alert and suggested Trading points (entry, TP1, TP2 and SL) whenever there is a break of - Break or Bounce from Pivot Point Support or Resistence - Break or Bounce from a Trendline (upper and lower Trendline) - High and Low of a previous period Any suggestion on other types of Support / Resistence to add are more than welcome

NO repaint, NO misleading statistics, NO hidden mechanisms – only proven mathematics using the famous Fibonacci retracement levels.
This indicator finds bearish Fibonacci retracement levels using a dynamic seeking engine, and tells where current price is relative to the levels, continuously for all candles. No need to redraw the levels manually when market structure changes - this indicator dynamically adjusts to the most recent structure. See the levels and price location from the indicator w

Profesyonel iş hayatı boyunca sızma testleri ve güvenlik danışmanlığı konusunda birçok firmaya hizmet veren Tekno Fatih, web uygulama, mobil uygulama, network&sistem, kablosuz ağ gibi birçok alanda sızma testleri yapmış olup siber olaylara müdahale, ddos testleri ve kaynak kod analizi projelerinde de yer almıştır. Siber güvenlik alanında birçok konferansta yerini almıştır. Amerika Savunma Bakanlığına bağlı olan NSA.gov ( Ulusal Güvenlik Teşkilatı )'inde ve NGA.mil ( Ulusal Coğrafya-İstihbarat T

As well as SuperTrend, SuperTrend Alerts offers alerts . You can also get alerts with SuperTrend Alerts . Besides SuperTrend, SuperTrend Alerts also offers alerts . SuperTrend Alerts offers alerts along with SuperTrend . In addition to SuperTrend, SuperTrend Alerts has alerts . Also , SuperTrend Alerts offers alerts . The SuperTrend Alerts add-on works with SuperTrend as well. As well as SuperTrend, SuperTrend Alerts has alerts too .
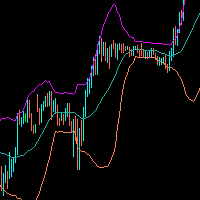
Bollinger Bands are a technical analysis tool that consists of a set of three lines plotted on a price chart. The middle line is a simple moving average, usually of 20 periods, and the upper and lower lines represent the standard deviation of the price from the moving average. The upper band is calculated by adding two standard deviations to the moving average, while the lower band is calculated by subtracting two standard deviations from the moving average. This creates a band around the moving

Smart Tape - это индикатор ленты всех сделок с возможностью агрегации по цене и времени и фильтрацией по величине объема, включает в себя два отключаемых варианта отображения. Вариант 1: перемещаемое окно по графику со списком сделок (Time Sales). Список обновляется сверху вниз и не имеет возможности просмотра истории. Количество отображаемых строк выбирается пользователем. Порядок отображения в строке: время с точностью до миллисекунд, тип сделки (B - покупка или S - продажа

Sobre la base del concepto físco de "Cantidad de Movimiento" construimos este indicador/oscillador, que pretende darnos idea de entradas y salidas en el mercado. En mecánica clásica, la cantidad de movimiento se define como el producto de la masa del cuerpo (volumen) y su velocidad (rapidez con la varía el precio) en un instante determinado. p=M*V Se trata de un indicador/oscilador que pretende identificar momentos de entrada y salida basados en la fuerza o presión a ambos lados del preci
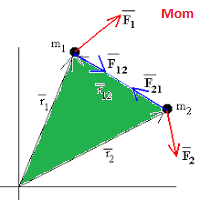
Indcador/Oscilador basado en el concepto de la física clásica, "Cantidad de movimiento". Fácilmente adaptable a diferentes pares y activos, como a períodos de time frame. Los parámetros de entrada son los que siguen, y pueden modificarse por el usuario: TrendPeriod = 14; // Trend period Smooth = 3; // Smoothing period TriggerUp = 0.05; // Trigger up level TriggerDown = -0.05; // Trigger down level
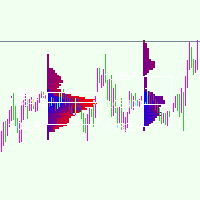
A Market Profile (time price opportunity) implementation with an option to mark a point of control (POC) based on volume .
Config: Hide default candles. Select a session time using exchange timezone. Experiment with tick multiplier value to achieve desired level of detail. Choose the symbols of your choice, e.g. squares or A-Z chars. For multiple sessions you will have to add additional instances of this script with a different time configuration.
Limitations: TradingView has a hard limi

The Rainbow Multiple Moving Average (MMA) is a technical analysis tool used to identify trends and potential reversal points in financial markets. It is based on a system of moving averages that are designed to be used together, with each moving average having a different time frame. The Rainbow MMA consists of multiple exponential moving averages (EMAs) of different lengths, with each EMA plotted in a different color. Typically, the Rainbow MMA includes EMAs of 2, 3, 4, 5, 6, 7, 8, 9, 10, 11, a
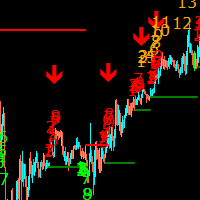
The Sequential Ultimate Indicator is a modified version of the Ultimate Oscillator that adds a sequential component to the calculation. It is designed to identify potential trend reversals by looking for divergences between the price action and the oscillator. The Sequential Ultimate Indicator works by adding a sequential count to the Ultimate Oscillator readings. The sequential count starts at 1 when the oscillator moves above 70 or below 30 and continues until a price reversal occurs. The sequ
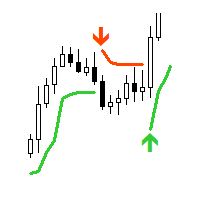
"AV SuperTrend MT5" is an indicator for MetaTrader 5. The supertrend indicator is popular for determining the trend and positioning stops or as trailing support. I use this indicator in several expert advisors for trend analysis.
Supertrend indicator signals can be selected in the form of entry arrows and notifications, as well as various sounds.
Settings:
- Period
- Multiplier
- Alert buy signal: arrow color
- Alert sell signal: arrow color
- Alert yes/no
- Sound: choice or no
- Email yes/

该指标旨在确定一天内最大交易活动的时间。 计算完成后,指标建立最重要的交易水平。 将这些水平与实际价格行为进行比较可以提供有关市场趋势强度和方向的信息。
指标的特点 时间范围必须低于 D1。 推荐时间范围:M15、M30 和 H1。 H1 以上的时间框架可以给出非常粗略的画面。 使用低于 M15 的时间框架可能会导致短暂的交易爆发。 该指标对历史数据敏感。 因此,我建议在图表窗口中至少设置 50,000 个柱。
指标参数 Base - 设置计算交易活动的基准期。 day - 计算交易活动时考虑了一天中的时间。 week – 交易活动的计算考虑了一天中的时间和一周中的某一天。
Width - 线宽。 ClrMean、ClrUp 和 ClrDn 是中、上、下交易水平的颜色。 Style1 - Style5 – 显示交易水平的样式。
AlertsOn - 打开交易时段开始的通知。 MailOn - 启用将消息发送到电子邮件的权限。 NotificationOn - 允许向移动终端发送消息。

It is important that the indicator works only in the charts of Japanese candlesticks and bars. So, this indicator is ideally combined with price pattern analysis Price Action and is used in classic Japanese candlestick analysis This forecasting tool consists of three elements: Price flip is a signal of a potential reverse. Setup filters out the signals, that is, it identifies where a new trend starts and when there is only a correction within the current trend. Countdown calculates the tre

Volatility Trend System - a trading system that gives signals for entries. The volatility system gives linear and point signals in the direction of the trend, as well as signals to exit it, without redrawing and delays. The trend indicator monitors the direction of the medium-term trend, shows the direction and its change. The signal indicator is based on changes in volatility and shows market entries.
The indicator is equipped with several types of alerts. Can be applied to various trading ins

uGenesys AI - 90% Accurate Daytrading Indicator
Introducing the ultimate forex trading indicator system, uGenesys AI, powered by cutting-edge AI technology and advanced analytical techniques, including Time-Series Analysis and Genetic Algorithms. Our AI-powered trading system leverages the power of time-series analysis to identify trends and patterns in historical price data, allowing traders to make informed predictions about future market movements. By analyzing vast amounts of data, our syst
DYJ SignalSourceOfWPR 信号源基于 WPR 指标。它可以用于任何货币对和时间框架。 WPR建议指标值在80%到100%之间表示市场超卖。指标值在0到20%之间表示市场超买。 这一指标的进入信号是趋势的转折点。 该指标使用模拟交易技术, 为您提供指标来评估开盘信号和收盘信号的整体利润。 使用哪种评估模式进行交易对您来说非常方便。 当您选择最大利润模型评估模型时, 建议您使用跟踪止损功能。 这样可以最大限度地跟踪趋势利润。 当您选择相反的信号以关闭评估模式时, 建议您耐心等待相反的信号出现,然后关闭它。 这总是可以等待趋势真正结束并盈利。 如果您需要自动按照信号开仓和关仓,请下载实用软件 DYJ follow Me 或者更好的具有博弈策略的 DYJ Game Device 如果您需要趋势指标做引导,请使用 DYJ PowerSignalSource 过滤震荡指标假信号。 [注意]
下载到电脑后,请修改文件名字为较短的名字,例如DYJ WPR,否则有时会因为MT5系统限制内部组合名字长度不超过63个,导致无法正常运行软件! 禁止多个周期操作同一个信号源和跟单软件。 另外

This is a simple arrow system based on MACD indicators Main/Base line and MACD Levels. It gives you alerts when MACD's Main Line crosses above/below certain level. Which type of alerts available? 1. It paints on chart Up/Down Arrows. 2. Popup message and sound alert in trading terminal window. 3. Push notification or Alert on your android and ios mobile phones (requires MT4 or MT5 app installed!)

Simple supply and demand indicator which should help identify and visualize S&D zones. Settings:
Color for supply zones, color for demand zones - default colors are set for dark (black) background.
Number of how much zones should be created above and below current price - value "3" means there will be 3 zones above current price and 3 zones below current price. Principle:
When price creates "V", reversal zone is registered. Rectangle filled based on zone type (supply / demand) is drawn if price
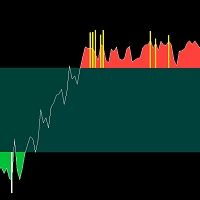
BS Trend Line是一款很好的买卖指示器,不含有未来函数,不会重绘,新版本已经加入了更好的过滤算法,开单成功率有了很大的提高,是一个很好的波段交易提示器,尤其是配合 SourcePoint 会有更明显的效果,它能帮你过滤掉接近70%以上的无效交易信号。 ===================参数列表===================== timeframe:M1
gip:30 sip:6 up line:80 down line:20 ===================使用方法===================== 配合 SourcePoint 使用时, SourcePoint 的参数 fastP: 96
slowP:208 avgP:72

This is a simple arrow system based on Engulfing Candlestick Pattern. It gives you alerts on your smartphone when there is an engulfing candlestick pattern happens. Which type of alerts available? 1. It paints on chart Up/Down Arrows. 2. Popup message and sound alert in trading terminal window. 3. Push notification or Alert on your Android and IOS mobile phones (requires MT4 or MT5 app installed!) *Note: Use it on higher timeframes like H4 (4 hours), D1 (1 Day) then find trade opportunities on s

Displays trends in current chart. You can display trends of multiple timeframes in one chart by inserting this indicator as often as you want. Key features: displays trend line by finding highs and lows counts number of high/low of current trend in different color (long/short) allows you to display multiple timeframe trends in one chart Settings: Indicator Name: if you want to show M5 and H1 on one chart add TITrend twice to your current chart and rename M5 to "TITrendM5" and H1 to "TITrendH1" C
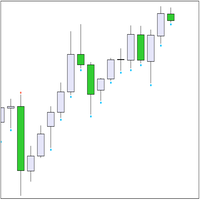
趋势指标“Trend Two Moving Average”使用两种箭头来显示计算结果 - 它们是“Trend UP”和“Trend DN”。 箭头“向上趋势” 绘制 经过 价格 '低的' 酒吧 , A 箭头“趋势 DN”- 经过 价格 '高的'。 趋势搜索算法基于对柱线价格和两个“移动平均线”指标值的分析。趋势方向是在当前(零)柱上计算的。因此,建议使用来自 bar #1 的信号 - 来自完全形成的 bar。 在交易中使用指标。 使用趋势指标,您可以同时使用风险策略(当信号来自当前柱时)和风险较低的策略(当信号来自柱 #1 时)。下面描述了基于来自柱 #1 的信号的策略 。 等待生成的信号( 此刻 新柱的出现,您需要查看柱 #1) 。 如果 在吧台上 #1 是 Arrow ,我们在市场上交易,或使用挂单: 1.按箭头方向开仓 2. 根据箭头的水平 放置挂单( Limit )

Indicator ICT Implied Fair Value Gap (IFVG) is an important part of the Smart Money Concepts (SMC) system. It looks for and shows on the chart a modern pattern - the Fair Value Gap ( FVG ). This pattern is a three candlestick imbalance formation based on the discovery of a mismatch between supply and demand. This happens when the price moves quickly in one direction without encountering resistance. The result is a "gap", which can be filled in later. The indicator finds this pattern using the up

it depends on ATR period to get swing points to help make better trading decisions blue dot and red dot is the default color scheme of course you can change it later if you'd like you can change the following : ATR PERIOD sending notifications number of times to send notifications sending notifications to your smart phone that's it very simple to use just drag and drop and follow the trend

BestPointOfInitiation是一个很好的短线交易指示器,能与 ShortBS ( https://www.mql5.com/zh/market/product/96796 )完美的配合,可以很好的指出最佳的buy和sell位置,指标不含有未来函数,不会重新绘制,不仅能够应用到自己的手动交易过程中,还能完全可以写入到自己的EA中。(如果你感觉到这个指标能够帮助你进行更准确的交易,请帮忙给个好评,希望我的作品能够帮助更多多有需要的人) ===================参数列表===================== fastPeriod: 9 slowPeriod:30 PassivationCoefficient:5 =================参考使用方法=================== 此指标可以适用于任何交易品种,能够用在任何周期。

it depends on channels and moving average in sketching the chart in two colors the default colors are gold and light blue to highlight the area of downtrend and the area of uptrend TO ADJUST THE INDICATOR YOU CAN CHNGE THE FOLLOWING: 1- the look back period which affects the length of the moving average 2- the multiplier which affects the point of swing in the trend 3- the channel shift which affects how close the line is moving to the price the default settings are the best for the indicator B
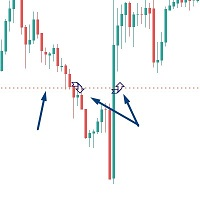
Introductory Offer! *** Only $47 - normal price $97 !! *** Ends soon - don't miis it!! The Close Above or Below Price Indicator is part of my suite of Price and Trendline Alerts Indicators. I'm excited to introduce the Close Above or Below Price Indicator – part of my new suite of Price and Trendline Alert Indicators – fantastic tools designed to alert you when candles close above or below significant prices in the markets you trade. With this indicator, you can set up to 4 price alerts on a
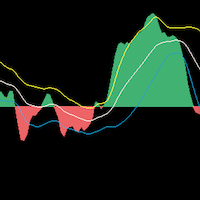
TradingDirection是一个针对中长线交易的趋势指标。在图上你能很清晰的看到什么时候是上涨趋势,什么时候是下跌趋势,同时在趋势中,你能看到很明显的补仓位置和减仓位置。同时它与 BestPointOfInitiation( https://www.mql5.com/zh/market/product/96671 )指标可以形成完美的配合,两个指标相互配合更能很好的把握开单时机。 ===================参数列表===================== fastPeriod: 9 slowPeriod:30 PassivationCoefficient:5 =================参考使用方法=================== 此指标可以适用于任何交易品种,能够用在任何周期。
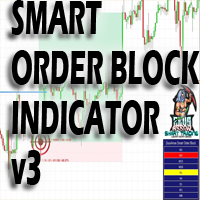
Please send me Direct message on MQL5 CHAT after purchasing the Indicator for Training and Installation Support There are some additional files that is important to use with the Indicator . So be sure to contact me after purchasing the Indicator So that I can add you for training and support .
If you find any difficulty with installation then send me Direct message here So that I can connect with you via Anydesk or Teamview for the product installation. " Smart Order Block Indicator " to find m
This is a modern MACD indicator based on regular MACD indicator. It also has alert system included. This indicator gives you alerts when base line of MACD indicator crosses above or below Zero level so you can look for Buy or Sell opportunity. Available Alerts: 1. Audible Alerts on Chart / Trading Terminal window. 2. Alerts on your email. 3. Alerts on your mobile phone. Type of Alerts Explained: 1. Audible_Chart_Alerts - Audible alerts and Popup message on your computer’s tr

ShortBS是一个很好的短线交易指示器,能很好与 BestPointOfInitiation ( https://www.mql5.com/zh/market/product/96671 )配合,能让你找到最合适的buy和sell位置,指标不含有未来函数,不会重新绘制。是一个针对(如果你感觉到这个指标能够帮助你进行更准确的交易,请帮忙给个好评,希望我的作品能够帮助更多有需要的人) ===================参数列表===================== maPeriod: 25 slowPeriod:20 fastPeriod:10 stepPeriod:5 =================参考使用方法=================== 此指标可以适用于任何交易品种,能够用在任何周期。
学习如何在MetaTrader AppStore上购买EA交易,MetaTrader平台的应用程序商店。
MQL5.community支付系统支持通过PayPay、银行卡和热门付款系统进行交易。为更好的客户体验我们强烈建议您在购买前测试EA交易。
您错过了交易机会:
- 免费交易应用程序
- 8,000+信号可供复制
- 探索金融市场的经济新闻
注册
登录