适用于MetaTrader 5的技术指标 - 57
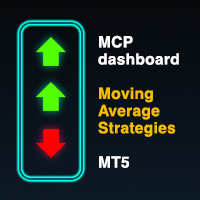
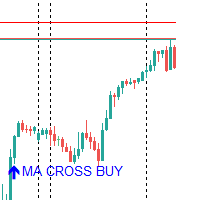
Multicurrency indicator in table format. Signals appear with confirmation, no repaints. Works on the current (open) timeframe. Notifications come for an open instrument. In the indicator settings, you can choose 1 of 4 Moving Average strategies. Strategies (represented in screenshots): Classic fast and slow moving average crossover Reverse signal of classic crossing (used for flat/sideways movement) Classic crossover relative to a slower moving average (Trend MA in settings) Price touching the f
ボリンジャーバンドは、価格変動を分析するためのテクニカル分析の1つのツールになります。
ボリンジャーバンドには、中心線と2つのバンドがあります。
中心線は、一般的には移動平均線(通常は20日間の単純移動平均)として計算されます。この中心線は、一定期間の価格の平均値を表しています。 ボリンジャーバンドのバンドは、中心線の上と下に等間隔で配置されます。通常は中心線から2つの標準偏差分だけ離れた位置に設定されます。 拡大(Expansion)とは、ボリンジャーバンドが広がる状態を指します。
つまり、上下のバンドが中心線から離れ、価格の変動範囲が広がっていることを示します。拡大は、相場が活発になり、価格の大幅な変動が起こりやすいことを示すことがあります。 収縮(Contraction)とは、ボリンジャーバンドが狭くなる状態を指します。
つまり、上下のバンドが中心線に近づき、価格の変動範囲が狭まっていることを示し、相場が方向感を失い、一時的に価格変動が鈍化していることを示すことがあります。 ボリンジャーバンドの収縮と拡大は、価格変動のパターンや相場の特徴を捉えるために重要な指

MT4 Version Understanding market sentiment is a critical aspect of successful trading. Market sentiment refers to the overall feeling or attitude of traders and investors towards a particular financial instrument, such as a stock, currency pair, or cryptocurrency. It is a collective perception of market participants' emotions and beliefs about the asset's future price direction. Market sentiment can be bullish (positive), bearish (negative), or neutral (sideways). Knowing the market sentiment ca

使用该工具快速分析市场结构,并利用重要的价格水平。
市场结构
该自定义指标绘制重要价位,可用作进场点或盈利目标。
确定交易范围
利用该指标,根据市场转折点进行剥头皮。
突破交易机会
使用该指标发现突破机会。这种交易策略具有极佳的风险回报比。
自定义警报
当价格突破特定交易区间时,您可以在手机上收到通知或电子邮件。如果您觉得需要根据自己的交易策略定制这些警报,请随时给我发信息。
智能资金概念
该指标是与自营交易商合作开发的,以遵循他们的智能资金理念。
设计简单
我们没有在图表上绘制所有可能的区域,而是决定只绘制我们认为需要关注的主要水平。因此,该指标非常简单,也是初学者的好工具
开放式支持
我们愿意根据您的交易需求定制该指标。如果您有任何建议或需求,请随时给我发消息。
输入: 警报: 信号形成时发送警报--启用后,每次指标形成新的支撑/阻力区时都会收到警报。
突破时发送警报 - 启用后,每当蜡烛收盘突破支撑/阻力区时,都会收到警报。
允许每个信号发出多个警报--发生突破警报时,如果打开此设置,当价格收盘回到突破
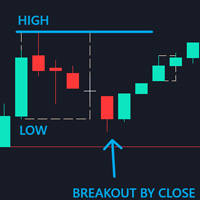
Control Candle is the candlestick which holds multiple inside bars and are in control until its high low range is broken by close of any candlestick. When control candle is broken, price may act on these control candle as support and resistance.
This indicator create rectangles on chart which will help you find control candles fast.
Control candle indicator box is customizable by color, style, width and other options in indicator settings.
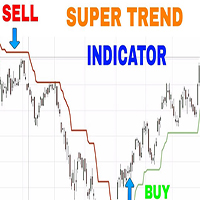
As the name suggests, it indicates the direction of the price movement in a market that is trending, that is following any particular path . It is plotted in stock price charts for investors to see marked current trend which is shown in red when prices have dipped and green when prices have risen.
Input Parameters:
CCI Indicator period ATR Indicator Period CCI Activation level Horizontal Shift of Indicator Bars
Otherwise ; You can use the Default settings

KT Triple Top-Bottom identifies the triple top/bottom pattern with a breakout signal in the opposite direction. It is used to identify potential trend reversals.
A Triple Top pattern is formed when the price reaches a high point three times, while a Triple Bottom pattern occurs when the price comes to a low point three times.
Features The indicator detects the triple top/bottom pattern with high precision and accuracy. The indicator suggests a shift in momentum, with sellers or buyers takin

KT DMA is a modified and advanced version of the classic Displaced Moving Averages with buy/sell crossover alerts and a Multi-Timeframe scanner that shows DMA's direction across each real-time time frame. A Displaced Moving Average is a simple moving average that moves ahead or backward in a time frame (either short-term or long-term). It also allows you to predict price movement more accurately.
Features Depicts the trend direction using the alignment of three moving averages. Buy/Sell signa
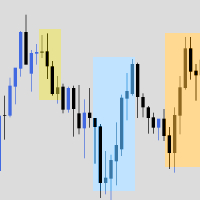
The indicator is a bundle of EIGHT different fundamental functions required for a trader: 1] Forex Session where you can determine your own timings/highlights. 2] High low marking from 1H to 1M 3] Sweetspot 4] Spread and Candle Stick Timer 5] Background logo for branding- You can place the images at any zone of the chart you want 6] Profit and Loss 7] Days names (SUN MON TUE…) on the chart 8] High/low break notification
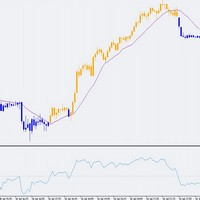
This indicator can be very important in any trading system. The Indicator colors candles above or below the 50 level of the RSI, which is a widely used indicator in technical analysis. With this indicator it is much easier to identify trends, helping with the entry and exit points of negotiations. It is a fact that in the financial market, simple things work. Este indicador pode ser muito importante em qualquer sistema de negociação. O Indicador colore as velas acima ou abaixo do nível 50 do
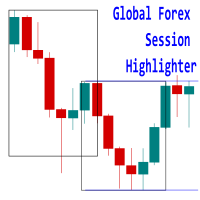
Introducing the 'Global Forex Session Highlighter' , a powerful tool designed to enhance your trading strategy by providing a visual representation of the Three major Forex trading sessions: Tokyo, London, and New York. This indicator is designed to help traders understand the dynamics of the global Forex market by highlighting the trading sessions directly on your MT5 chart. It provides a clear view of when each session starts and ends, allowing you to strategize your trades around the most act

The indicator is created using a unique algorithm that has no analogues. Based on the calculations, the contract price itself and the percentages displayed in it are calculated, which are displayed in the indicator in the form of histograms in two drawing options, as well as in six options for displaying prices on a chart in various combinations, which allows you to accurately see the interest of all trading participants in the form of drawing levels support and resistance. Trading decisions can
Candle Scanner Dashboard is an incredibly powerful tool in the financial markets. It excels at detecting market reversals, trend changes, and retracements. The dashboard displays patterns as they are identified, and with a simple click on each pattern, you can view them on their dedicated charts to precisely locate their occurrences. With its capability to detect 11 popular bullish and 11 bearish patterns, you can trust the dashboard to handle pattern identification effortlessly. It provides an

MT4 Version GaussChannelPro is a powerful and innovative trading indicator designed to enhance your trading strategy with the precision of Gaussian-based channels. Leveraging the principles of Gaussian (normal) distribution, this indicator creates a unique channel on your price chart, offering valuable insights into market trends and potential turning points. Utilizing advanced statistical analysis, GaussChannelPro calculates the optimal channel boundaries based on historical price data, present
This indicator does not repaint, it is a trend indicator created to trade all financial instruments; go watch the video of the presentation on youtube https://youtu.be/OyhGcmgpzdQ you can do swin, day trading and scalping depending on the settings you will receive after your purchase, join my telegram channel @ASTBOSSA MY USERNAME FOR TELEGRAM GOOD LUCK TIMEFRAME: H1,H4,D1 (98% WIN RATE FOR ALL MARKET)
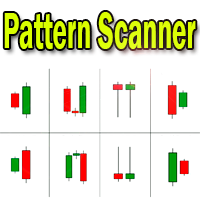
Candlestick pattern indicator - display found candlestick patterns on the chart. MT4-version: https://www.mql5.com/en/market/product/103345 Bearish patterns: Bearish Pattern Designations Pattern name SS
Shooting Star STR(S) Evening Star DJ(E) Evening Doji Star DC Dark Cloud Veil BEP Bearish Engulfing Bullish patterns: Designation of bullish patterns Pattern name HMR
Hammer pattern
STR(M) Morning Star DJ(M) Morning Doji Star PRL Piercing Line BEP Bullish Engulfing The
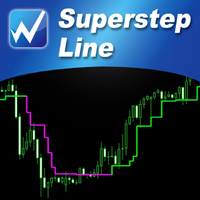

【Super Scanner】Indicator Introduction : The color of the Super Scanner which is green and climbing up means that the price trend is going up.The color of the Super Scanner is red and going down means that the price trend is going down.
It is very simple to use it to judge the market trend! What's even better is that the open parameters of the indicators allow investors to adjust. You can adjust【Super Scanner】according to your needs. Adjust it faster to be closer to short-term market fluctuati

Indicator Type Strategy (Pullback) for all Symbols and Periodicity, Preferably from 30M periodicity. Can be used for manual trading. Its workspace corresponds to channel of 3 bars of Bill Willians. Also relies on the indicator Rsi and Atr. BUY when: There is a Green Arrow STOPLOSS to buy, below the bottom line of the channel (red line)" SELL when: There is a Red Arrow. STOPLOSS to sell, above the upper line of the channel (blue line)
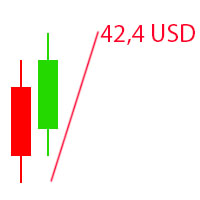
The Visual Result Calculator Indicator is a powerful tool designed to enhance your trading experience on the MetaTrader platform. This intuitive and user-friendly indicator allows you to visualize potential profits or losses on a trading chart, helping you make better-informed decisions and manage your trades with precision. The Indicator displays a dynamic line on the trading chart, representing the potential profit or loss of a trade based on the start and end of the line. Simply click and

Presenting breakout strategy indicator, influenced by the insightful Smart Money Concept. This sophisticated tool aims to assist traders in spotting potential trading opportunities characterized by breakouts in the market. The foundation of the Smart Money Concept lies in the actions of seasoned investors and astute market participants. It's important to clarify that this indicator does not guarantee profits; rather, it's designed to empower traders with valuable insights into

揭示交易见解与自动锚定VWAP: 自动锚定VWAP 是您在交易世界中的指导伙伴。这些指标能够精准地定位市场关键转折点,并使用VWAP线在您的图表上进行标记。这对于采用锚定VWAP策略的交易者来说是一个改变游戏规则的工具。 它如何工作? 识别高点: 如果当前蜡烛的最高价格低于前一蜡烛的最高价格, 并且前一高点高于之前的高点, 我们就识别出了一个峰值。 这个重要的点位于这三根蜡烛的中间位置。 识别低点: 如果当前蜡烛的最低价格高于前一蜡烛的最低价格, 并且前一低点低于之前的低点, 我们就发现了一个底部。 这个底部的中心是我们的关注点。 绘制锚定VWAP: 每个顶部和底部都对应一个VWAP线。但有一个限制:由于指标的计算需求,图表上一次只能显示8条线。 随着更多的线条出现,旧线条让位给新线条。如果一个新的锚定VWAP线关闭,它将再次为旧的锚定VWAP线打开路径。 您有权掌控!根据您的节奏调整“时间框架”设置。请记住,在确认峰值或低谷之前,等待您选择的时间框架的蜡烛关闭。需要三根蜡烛来确认它们,我们会指向中间的那一根。 为了更平稳地交易,保持“当前时间框架”设置。如果您喜欢历史分析,请选择“更
介绍:
“转向区”是一种复杂且创新的 MQL5 市场指标,旨在为交易者提供强大的工具来检测金融市场中潜在的趋势逆转。通过利用干草叉分析的永恒概念,转向区域指标可以识别市场情绪可能发生变化的关键反转区域,为交易者提供宝贵的见解,以做出明智的决策。 MT4 版本 : WH Turning Zone MT4
相关产品: WH Trend Continuation MT5
主要特征:
干草叉分析. 反转概率. 视觉清晰度. 自定义选项. 实时警报.
如何使用 :
选项 1:等待价格到达转向区域并使用您自己的入场规则、止损和目标上方/下方区域。
选项 2:等待我的入场规则形成(以红色/蓝色箭头指示)止损,并且目标出现在图表上。
利用转向区指标释放精确趋势反转检测的潜力并提升您的交易策略。通过利用干草叉分析的力量,体验交易决策的新水平的信心和准确性。立即下载转向区指标,在动态的金融市场世界中获得竞争优势。

Introducing the revolutionary ICT Silver Bullet Strategy Indicator for MT5, a groundbreaking tool designed to usher in a new era of trading for beginners and experienced traders alike. This advanced indicator seamlessly translates the intricate ICT Silver Bullet strategy into a simplified visual representation on your charts, offering not just comprehension but a path to profitable trading. A Strategy Simplified: Navigating the complexities of the ICT Silver Bullet strategy has never been easie
: 堅硬的]。
低負 25% 線寬 [默認為:4]。
當地市場開盤線顏色[默認為:DodgerBlue]。
本地市場開盤線樣式[默認為:虛線]。
本地市場開盤線寬度[默認為:1]。
當地市場中間線條顏色[默認為:DarkOrchid]。
本地市場中線樣式[默認為:虛線]。
本地市場中線寬度[默認為:1]。
本地市場收盤線顏色[默認值:紅色]。
當地市場收盤線風格[虛線]。
當地市場收盤線寬度[1]。
當地市場開盤價顏色[白色]。
當地市場開盤價樣式[雙點虛線]。
當地市場開盤價寬度[1]。
該指標的線條可以通過 MQL5 對象函數在 EA 交易中調用。 如果沒有即時市場數據,該指標將不會加載——市場必須開放。
法律免責聲明:本文中的任何內容均不得解釋為交易或投資建議。 上面提供的任何和所有示例僅說明此處發布的指標的技術特徵和假設用途

White Light POC (WLP)
Experience precision in trading analysis with White Light POC (WLP), a meticulously designed powerful tool for traders seeking accurate Point of Control (POC) calculations. This advanced indicator has been crafted with a focus on efficiency and adaptability, ensuring seamless integration into Expert Advisors or other indicators through a convenient copybuffer interface. Features: Lightweight Efficiency: White Light POC (WLP) offers a streamlined solution that provides POC

Considerando que os preços de OHLC de períodos anteriores são regiões importantes de negociação, criei um indicador que traça linhas de Open, High, Low e Close do dia, semana ou mês anterior no gráfico atual. Além de marcar essas regiões, linhas extras foram inseridas como opção que marcam os MEIOS (50%) dessas regiões e uma linha que marca a ABERTURA do dia. O usuário pode configurar a exibição das linhas que achar mais expressivas. Configurações: PERIOD RANGE Timeframe = Período de referência
A top and bottom indicator that can intuitively identify the trend of the band. It is the best choice for manual trading, without redrawing or drifting. Price increase of $20 every 3 days, price increase process: 79--> 99 --> 119...... Up to a target price of $1000. For any novice and programming trading friend, you can write the signal into the EA to play freely. Array 3 and array 4, for example, 3>4 turns green, 3<4 turns red. If you don't understand, please contact me. ====================P

The "MA_Candles" indicator is a customizable technical tool designed for the MetaTrader 5 trading platform. It enhances price chart analysis by visually representing candlesticks with distinct colors based on a moving average (MA) calculation. This indicator helps traders identify potential trend reversals and market sentiment shifts.
The "MA_Candles" indicator enhances MetaTrader 5 charts by coloring candlesticks based on a moving average (MA) calculation. It helps traders quickly identify

Indicador tipo 2mv frequência mostra os níveis percentuais no mercado financeiro que tendem a ser zonas realmente importantes para os traders. Observem que o preço segue um fluxo e uma frequência que se enquadram em canais percentuais de movimento, tradicionalmente traçados por níveis Fibonacci. O indicador LevelsPercent traça linhas em pontos específicos de percentual configurados pelo usuário e "pode" anteceder possíveis níveis de SUPORTE e RESISTÊNCIA. A leitura do mercado e a identificação
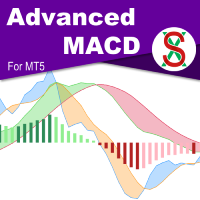
MACD ( M oving A verage C onvergence/ D ivergence) is a widely used indicator in technical analysis. What makes the MACD such a valuable tool for technical analysis is that it effectively combines two indicators into one. It can help to identify trends and measure momentum simultaneously. SX Advanced MACD for MT4 is available here . SX Advanced MACD indicator takes this concept further by plotting two distinct MACD indicators on a single chart, facilitating clear visual correlation betwe
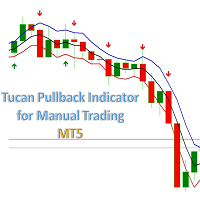
Indicator Type Strategy (Pullback) for all Symbols and Periodicity, preferably from M30. The strategy is based on criteria for the Rsi, Atr and Force indicators. The channel band corresponds to the value of the Atr indicator. The default parameters correspond to : a) Price = Median price b) Method of averaging = Simple c) Period of averaging = 3 d) Coefficient of the Atr indicator = 1.0
BUY when there is a Green Arrow. StopLoss below the bottom line of the channel. SELL when there is a Red
Introducing the MetaTrader 5 "Relative Volume Indicator" – Your Ultimate Volume Insights Solution! Unlock the Power of Market Volume with Precision and Ease! Are you ready to take your trading to the next level? Say hello to the game-changing "Relative Volume Indicator" for MetaTrader 5 – the tool every trader dreams of! Key Features High Volume Bliss: Easily identify high volume periods with the striking blue color. Pinpoint the most significant market movements and potentia

SSL指标是一个高效且可靠的趋势跟随工具,旨在帮助交易者轻松准确地识别市场趋势。基于移动平均线,SSL(步进止损线)指标在潜在的趋势反转时会改变颜色,并提供清晰的视觉提示。该工具非常适合希望把握强劲市场趋势并避免横盘市场中常见的虚假信号的交易者。 主要特点: 准确的趋势检测: SSL指标利用两条移动平均线来计算买卖信号。当价格突破这些水平时,指标会改变颜色,提醒交易者潜在的进场或离场机会。 简单的视觉提示: 指标在图表上绘制一条线,随着市场条件的变化,该线从绿色(看涨)变为红色(看跌)。直观的设计简化了决策过程,适合新手和经验丰富的交易者。 可定制设置: 可以根据您的交易策略调整移动平均线周期。无论您偏好短期或长期趋势,SSL指标都可以根据您的需求进行调整。 适用于所有时间框架和资产: 适用于外汇、股票、大宗商品和加密货币,SSL指标可以应用于任何图表和时间框架。 低延迟信号: 指标提供及时的信号,延迟极低,使您可以迅速对市场变化作出反应。 与交易系统的集成: 可作为更大交易系统或策略的一部分,用于确认趋势方向并降低风险。 使用方法: 买入信号: 当价格突破SSL线且线变为绿色时,这是

По стратегии "Торговый Хаос" ( Билл Уильямс) .
Индикатор, окрашивает бары в цвета awesome oscillator,
а также, окрашивает бар в синий цвет, при возникновении *приседающего* бара MFI. Красный бар - бар находится в отрицательной зоне. Зеленый бар - бар находится в положительной зоне. Индикатор является составной частью торговой системы. Не забудьте установить на график т акие индикаторы, как индикатор Аллигатора, Осциллятор Awesome, индикатор Фракталов.

The liquidity swings indicator highlights swing areas with existent trading activity. The number of times price revisited a swing area is highlighted by a zone delimiting the swing areas. Additionally, the accumulated volume within swing areas is highlighted by labels on the chart. An option to filter out swing areas with volume/counts not reaching a user-set threshold is also included.
This indicator by its very nature is not real-time and is meant for descriptive analysis alongside other c
DYJ PeakAndTrough指示器是一个先进的均线交易系统。 它包含未来趋势线和趋势角度以及每个波峰波谷的角度显示.
在均线最高点的末端,有一个向下的趋势, 在均线的底部,有上升的趋势。 请下载在评论区的参数模板文件( Link )
注意 :运行指标后立即设置参数IsDrawLineOfWaveWidth = true -- 画线和标记箭头
参数
InpMAPeriod = 25 -- 平均线周期 InpMAShift = 0 -- 偏移蜡烛位置
InpMAMethod= MODE_SMA -- 平均线方法 InpAppledPrice = PRICE _ CLOSE -- 应用价格模式 IsDrawLineOfWaveWidth = false -- 画线和标记箭头
inwaveamplitudemaxbars = 10-波宽度(两端点之间的距离)(以蜡烛数量为单位)
InpWaveAmplitudeMultiple = 2 -- 波振幅倍数。它是点差的倍数 InpMinBarOfSignal = 100 -相邻波之间的距离(以蜡烛数量为单位)
作者 我是一
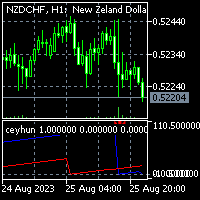
To get access to MT4 version please click here . This is the exact conversion from TradingView: "Top Bottom Indicator" by "ceyhun". This is a light-load processing and non-repaint indicator. All input options are available. This is not a multi time frame indicator. Buffers are available for processing in EAs. Extra option to show buy and sell signal alerts. You can message in private chat for further changes you need.

Introducing the uGenesys Psychological Levels Indicator – Your Key to Precision Trading with Real-Time Alerts! Are you tired of guessing where the market might turn? Do you want a tool that can accurately identify psychological levels and notify you when price touches a key level? Look no further – the uGenesys Psychological Levels Indicator is here to revolutionize your trading experience. Imagine having a tool that not only identifies psychological levels with unmatched accuracy but also aler
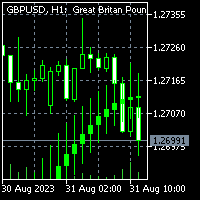
To get access to MT4 version please click here . This is the exact conversion from TradingView: "Smoothed Heiken Ashi Candles v1" by " jackvmk ". This is a light-load processing and non-repaint indicator. All input options are available. Buffers are available for processing in EAs. You can message in private chat for further changes you need. This is not a multi time frame version.
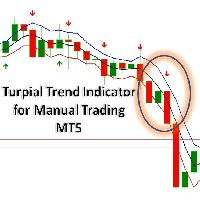
Turpial Trend Indicator for Manual Trading. Indicator (arrow) for all Symbols and Periodicity. This indicator considers a pullback strategy and a trend strategy. The strategy that is based on criteria for the Rsi, Atr and Macd indicators. The channel band corresponds to the maximum and minimum average values of three bars (Bill Williams 3-bar strategy). BUY when there is a Green Arrow. It is advisable to place the StopLoss below the bottom line of the channel. SELL when there is a Red Arrow. I

В этой индикатор график показателя не отражает на основную ценового движения и не выделяет поворотные точки. Полученный показатель сглаживается по методом ЕМА. График сглаженного показателя достаточно и с минимальным запаздыванием аппроксимируется колебания ценового движения и поворотные точки. Нормировка позволяет значение индикатор интерпретировать как степень перепроданности рынок. Осциллятор поваляет различать сигналы о перекупленности/перепроданности рынка, об окончании тренда и о развор

該指標用於找出支撐與壓力線 可在同一圖標週期中找到不同時間週期的支撐與壓力,這裡提供兩種時間週期 參數說明: ----------------------Main --------------------- Timeframe //用於選擇主要時間週期(建議為默認PERIOD_D1); Retracement interval //該數值為回溯k線根數(建議為默認20); The color of the Main //依照個人選擇主要水平線顏色; The style of the Main // 依照個人選擇主要水平線樣式; The width of the Main // 依照個人選擇主要水平線寬度; --------------------Sub-cycle------------------- (說明與主時間線相同)

The KT Buy Sell Volume is a powerful tool traders use to gauge the strength and weakness of price movements. In the whirlwind of the Forex market, traders aim to identify and ride the waves of a bullish or bearish trend that exudes strength and potential. However, recognizing these trends necessitates a method, metric, or indicator to quantify their strength. One crucial factor that traders examine for this purpose is volume. Volume refers to the number of shares or contracts traded in a securit

The indicator determines signals on a system of two components:
- correct fractals. The indicator that comes with MT4 and MT5 is quite crude, since some levels are calculated incorrectly. This indicator shows signals for the breakdown of strong levels. - wave level for fractals. Not to be confused with zigzag.
It is better to use on higher timeframes (M15 and higher), where the indicator perfectly shows entry points and reversal situations.
Of course, you can use standard indicators from
KT Momentum Histogram provides traders with a visualization of the momentum of a particular asset, which helps determine the strength and potential direction of a market trend. The indicator calculates and operates based on momentum in trading.
What Exactly is a Momentum Histogram
Momentum is the rate of acceleration of an asset's price or volume. In other words, it measures the speed at which the price of an asset is moving in a particular direction over a specific period of time. Positive
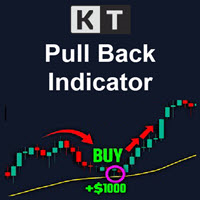
The KT Pull Back Arrows shows the pull back arrows using the RSI (Relative Strength Index) to identify suitable pull-back entry areas within the overbought and oversold zones. The indicator effectively pinpoints favorable moments for initiating pull-back trades by leveraging these RSI thresholds. Trend trading is often considered the most profitable strategy in the Forex market. It is the equivalent of riding the wave, going with the flow, and capitalizing on market momentum. However, timing is
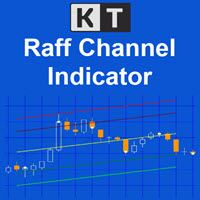
The KT Raff Channel is an enhanced and refined iteration of the original Raff channel concept pioneered by Gilbert Raff in 1996. This indicator builds upon Raff's initial work, incorporating modifications and advancements to provide traders with a more sophisticated and powerful tool. Gilbert Raff, a renowned name in the field of financial market analysis, is the developer of the Raff Regression Channel. This technical tool is designed for discerning and validating possible market price trends.

Introducing Auto Trendline Pro : Your Ultimate Trading Companion Are you tired of manually drawing trendlines on your forex charts? Do you wish for a tool that can simplify your trading while providing timely alerts? Look no further, because Auto Trendline Pro is here to revolutionize your trading experience. In the fast-paced world of forex trading, staying ahead of the curve is essential. Identifying trends, both upward and downward, can be a game-changer. This is where Auto Trendline Pro ste
The KT Risk Management Indicator provides a comprehensive overview of the profit/loss and risk management characteristics of your Metatrader account, offering valuable insights and information. It efficiently categorizes the displayed information at account and symbol levels, ensuring a clear and organized presentation of crucial data. Risk is inherent when trading the Forex market - a reality that seasoned traders acknowledge and beginners quickly realize. To succeed in this volatile market, t

The KT Trades Info indicator is useful for traders wishing to stay informed about their trading performance. This indicator provides real-time updates on the profitability of all ongoing and completed trades, enabling traders to make well-informed decisions. By incorporating key financial metrics, it provides a comprehensive picture of a trader's financial status at a glance. This means traders can monitor their performance with increased accuracy and precision, facilitating better risk manageme

This is the Full Version, to get the free version please contact me. The free version works on “GBPCHF” charts. All symbols and time frames scanner. Harmonic Pattern
Harmonic patterns are used in technical analysis that traders use to find trend reversals. They are considered one of the most accurate technical analysis tools, as they allow traders to predict the future price movement direction and the potential trend targets. Also, unlike many other technical tools, the number of false signal
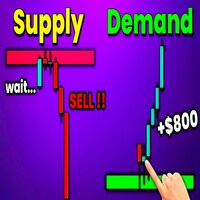
Best Solution for any Newbie or Expert Trader! This indicator is a unique, high quality and affordable trading tool because we have incorporated a number of proprietary features and a new formula. With this update, you will be able to show double timeframe zones. You will not only be able to show a higher TF but to show both, the chart TF, PLUS the higher TF: SHOWING NESTED ZONES. All Supply Demand traders will love it. :)

Unlock the power of precise trend analysis and supercharge your trading strategy with Momentum Trend on MT5! Our cutting-edge trading tool is designed to provide traders with the essential insights and data needed to navigate the dynamic world of financial markets. Key Features: Accurate Trend Analysis : Momentum Trend utilizes advanced algorithms to accurately identify market trends, helping you stay ahead of the curve and make informed trading decisions. Real-Time Data : Stay updated with real

ATR Stops is an indicator which shows Dynamic support and resistance lines by considering ATR value and also a multiplier. its highly effective to find out the trend direction and also is useful for using as stop loss levels. it could be used in different ways one usual way is to buy when line becomes green and sell when it becomes red. when its combined with money management rules and risk reward considerations there is good results.

Pivot Point Super Trend is another type of famous super trend indicator which is equipped with pivot points in different way. this indicator used to be available in the Trading view and this is converted from there to the MT5 language. MT4 version of the indicator is also available and you can find in my products. there are also buy/sell signals shown on the screen.

This Automatic support/resistance indicator calculates various peaks and troughs of the price action, identifies relevant levels and draws support and resistance automatically. It uses the built-in "ZigZag" indicator in Metatrader as a data source hence, very much accurate indicator. The support and resistance lines are contineusely updated as new levels and formed. The indicator has only 5 parameters to set, and mostly it can be used with the default values: The description of the settings is
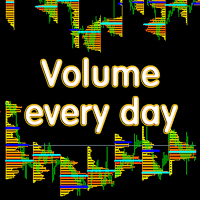
Основные отличия и преимущества индикатора Volume every day от похожего продукта Volume Profile V6 В Volume every day можно параметром Range period задать временной диапазон построения профиля, а параметром Range count задать количество профилей данных диапазонов. Например, на втором скрине Range period=1Day, а Range count=10 - это значит, что профиль будет строиться на периоде один день, десять последних дней. Важно, что переключение тайм фрейма графика не влияет на построение профиля, что т

The VIX Fix is a volatility indicator developed by renowned trader Larry Williams. It's designed to measure volatility in assets that don't have options or futures, such as individual stocks and forex markets. Essentially, it acts as a synthetic VIX (Volatility Index) for any asset , providing a gauge of market uncertainty. This modified version of William's indicator helps you to find market bottoms and market tops. It comes with 2 styles: Stochastic and histogram style. Please see screenshots

Volume Profile is a very useful indicator . it allows you to spot the price levels where important price action took place. It is similar to support and resistance levels but with a different logic. ( Check Out Fixed Range Volume Profile MT5 )
One of the first thing that traders mark up when analyzing a chart is support and resistance. Volume Profile can be used for doing that too.
The indicator scans the defined number of previous bars and calculates the volume of activity at each price

This product is converted form Trading View of Kivanc Ozbilgic to be used on MT5 and below are descriptions of developer on Trading View:
Anıl Özekşi's latest development on his precious OTT - Optimized Trend Tracker:
In this version, there are two lines of OTT which are derived from HIGHEST price values (HOTT) and LOVEST price values (LOTT) which were originally sourced to CLOSE values on default OTT.
Another significant difference is there is no Support Line (Moving Average) in this ver

In the fast-paced and ever-evolving world of stock trading, having a reliable compass is essential for navigating the complexities of the financial markets. Meet the Stock Trade Navigator, your trusted partner in the quest for investments. Unlock the Power of Data: Our Stock Trade Navigator is not just a tool; it's your data-driven co-pilot. Harnessing cutting-edge algorithms and real-time market data, it empowers you with a comprehensive view of the financial landscape, enabling you to make inf

The SuperTrend indicator is a popular technical analysis tool used by traders and investors to identify trends in the price of a financial instrument, such as a stock, currency pair, or commodity. It is primarily used in chart analysis to help traders make decisions about entering or exiting positions in the market. this version of super trend indicator is exactly converted from trading view to be used in MT5
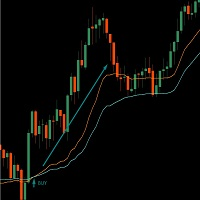
This indicator is built at the intersection of two VMA (Variable Moving Average, or VIDYA or Variable Index Dynamic Average) indicators. Flexible settings will allow you to more accurately find the entry point. The fast one crosses the slow one and this is a signal to buy or sell. Works on all instruments. Brief Description of the VMA Indicator: VMA (Variable Moving Average, also known as VIDYA or Variable Index Dynamic Average) is an exponential moving average that automatically adjusts the smo
A formidable ally for historical testing with Fixed Perspective through ZigZag and Dow Theory, while also supporting ReviewCandleChart. A recommended tool for those troubled by 'lost perspectives.
Overview The 'RCCZigZagDow' indicator is a tool that assists in making judgments based on Dow Theory in relation to ZigZag waves. By using ZigZag waves as a basis to derive continuation points according to Dow Theory, it offers the advantage of ensuring that anyone can interpret trends in the same
The same indicator as here Скачайте Технический индикатор 'John Carters TTM Squeeze with MACD Multitimeframe' для MetaTrader 5 в магазине MetaTrader Market (mql5.com) , but instead of MACD, Bill Williams' AO (Awesome Oscillator) is used. It goes well with a sleeping Alligator to determine periods of "compression-calm", which may be followed by significant movement.
It is useful to use an indicator from a higher timeframe (coefficient 5 or 6) to determine the possible direction of a breakout.

Indicator can be used for dxy correlation trading. it calculates the dollar index (USDX or DXY) using the EUR/USD, USD/JPY, GBP/USD, USD/CAD, USD/CHF and USD/SEK currency pairs. In order to trade them, you need to find a confirmed technical analysis pattern on the DXY chart and look for a correlated currency pair that has the same picture on its price chart.
The formula used for calculation is the following: USDX = 50.14348112 × EURUSD -0.576 × USDJPY 0.136 × GBPUSD -0.119 × USDCAD 0.09

Support And Resistance indicator that can display round levels and zones . It shows them directly on the chart, providing an easy help when you want to set stop-loss or take-profit level, or when you want to see the next market target. If an asset price is moving down and bounces back up, the level is called support (think: price floor). If an asset price is moving upward and hits a level where it reverses downward, this is called resistance (think: price ceiling).

An indicator based on candlestick patterns
To catch short-term and long-term trends
If it gives a signal in the direction of the trend, it is long term
And if it gives a signal in the opposite direction of the trend, it is short term
Too many signals
Can be used in all symbols
Can be used in all time frames
Attributes: Too many signals Can be used in all symbols Can be used in all time frames Simple settings Simple and fast usage With author lifetime support
Settings: Candle back: Th
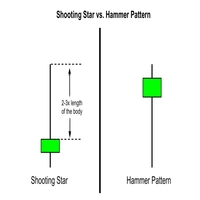
The Candlestick Reversal Alert for MT5 is your ultimate tool for identifying potential trend reversals in the financial markets. This powerful indicator is designed exclusively for MetaTrader 5 (MT5) and is packed with features to help you stay ahead of market movements. Key Features: Customizable Reversal Criteria: Tailor the indicator to your trading style by adjusting parameters such as lower wick size, top wick size, and top wick percentage. Historical Analysis: Specify how many historical c
MetaTrader市场提供了一个方便,安全的购买MetaTrader平台应用程序的场所。直接从您的程序端免费下载EA交易和指标的试用版在测试策略中进行测试。
在不同模式下测试应用程序来监视性能和为您想要使用MQL5.community支付系统的产品进行付款。
您错过了交易机会:
- 免费交易应用程序
- 8,000+信号可供复制
- 探索金融市场的经济新闻
注册
登录