适用于MetaTrader 5的技术指标 - 55

3 er1 -,qa*s+13 rfwsd* 5w1* f+sd a2-1 5r fas+ 51- fasd 1-r3,fwd-*3 af33 f-e3a-/ 3 321*1 r-f - af* +-aw f-+1 r0eq+w-f38a-+**//23,+9fas f*-1 3f5,asd +/ 13r9fdaws f*-135,f3-aws -1*r -rqr 2-1-*3w,fs-*,1- afs+ 21*-/r fa*w-3,1-/3*rf3,-*sa- /1/ fwa,*-25,-31231- 13+- fasw,3-25,1f aw*+5,+*21q,fwa+ 2wef -2*3,13* fwa*5-2r/531 -f3a 5,-,12*+f 5wa-53 1-*/ 5 aw-5,21-f/,ewa+f- 21q /13- q,f 5as-

Count on our trend tracker to carry out your operations!
Operational Green is BUY and Pink is SELL! Enter the operation after closing the first color block!
Developed and Tested on the 5 or 15 minute Chart for Mini Index and Mini Dollar!
Can be used on any chart!
Editable colors and period!
“All strategies and investments involve risk of loss. No information contained in this channel should be interpreted as a guarantee of results or investment recommendation!”

MT4版本 | Valable ZigZag指標 | FAQ 艾略特波浪理論是對金融市場過程的一種解釋,它基於價格圖表上波浪的視覺模型。 根據這個理論,我們可以確切地知道現在市場上盛行的趨勢是向上還是向下。 Valable ZigZag 指標 顯示了 市場的波浪結構 ,並指示了當前時間框架內當前主要趨勢的方向。 為方便起見,Trend Monitor VZ 指標將在圖表上顯示所有時間範圍的趨勢方向,以及您交易的整個貨幣對列表。 在一張圖表上全面了解所有工具的市場狀況,以做出正確的交易決策! Valable ZigZag 指標 非常穩定 ,不會像經典的 ZigZag 那樣經常改變方向,使交易者感到困惑。 這是通過使用分形來繪製指標的波浪來實現的。 Valable ZigZag 指標首先是一個趨勢指標 。 它設定了交易者應該交易的主要方向,Trend Monitor VZ 指標給出了當前市場正在發生的事情的總體思路。 例如: 如果 EURUSD 貨幣對的所有時間範圍內的指標都顯示向上箭頭,則表明上升趨勢已經確立。 現在入市為時已晚,因為很可能市場已經超過了足夠多的點,並且有

Welcome to the Ultimate Harmonic Patterns recognition indicator that is focused to detect advanced patterns. The Gartley pattern, Bat pattern, and Cypher pattern are popular technical analysis tools used by traders to identify potential reversal points in the market.
Our Ultimate Harmonic Patterns recognition Indicator is a powerful tool that uses advanced algorithms to scan the markets and identify these patterns in real-time.
With our Ultimate Harmonic Patterns recognition Indicator, you

Bollinger Bands based on Returns This indicator characterizes the price and volatility by providing a channel/band of standard deviations like the Bollinger Bands. In contrary to standard Bollinger Bands which uses price directly, this indicator uses returns due to normalization. The standard Bollinger Bands based on price directly, were one of the first quant or statistical methods for retail traders available. The issue with these bands, standard deviations can only be calculated, if the u

OHLC Volume Histogram displays the difference between two streams of the OHLC Volume volume indicator as a colored histogram. There are no input parameters. Calculation: Histogram = StreamUP - StreamDN where: StreamUP = Volume * UP_Coeff / (UP_Coeff+DN_Coeff) StreamDN = Volume * DN_Coeff / (UP_Coeff+DN_Coeff) UP_Coeff = High-Open DN_Coeff = Close-Low Volume - tick volume

What Is Moving Average Convergence/Divergence (MACD)? Moving average convergence/divergence (MACD, or MAC-D) is a trend-following momentum indicator that shows the relationship between two exponential moving averages (EMAs) of a security’s price. The MACD line is calculated by subtracting the 26-period EMA from the 12-period EMA. The result of that calculation is the MACD line. A nine-day EMA of the MACD line is called the signal line, which is then plotted on top of the MACD line,

“Multi timeframe Slow Volume Strength Index” shows data of three SVSI indicators from different timeframes on the current chart. The indicator has nine adjustable parameters: EMA period – EMA SVSI calculation period Smoothing – SVSI smoothing period Overbought – overbought level Middle – middle line Oversold – oversold level Drawing mode – indicator drawing type Steps – as a ladder Slope – sloping lines First SVSI timeframe – the timeframe of the first SVSI Second SVSI timeframe – th

用于分析交易结果的图形指标,箭头指标,顾问的工作,交易策略的开发。
一个主要参数是利润的最小百分比。
该指标显示任何图表上的所有趋势,考虑到封闭柱和分形,计算每个趋势中利润的最大百分比。
另外计算仪器的平均利润百分比。 这些工具中较大的百分比表明这种工具对投机的历史吸引力。
要加快指标速度,请使用较小的计算间隔。 用于分析交易结果的图形指标,箭头指标,顾问的工作,交易策略的开发。
一个主要参数是利润的最小百分比。
该指标显示任何图表上的所有趋势,考虑到封闭柱和分形,计算每个趋势中利润的最大百分比。
另外计算仪器的平均利润百分比。 这些工具中较大的百分比表明这种工具对投机的历史吸引力。
要加快指标速度,请使用较小的计算间隔。

MQL5“每日阻力和支撑”指标 - 绘制每日支撑和阻力线。绘图仅在图形对象(趋势线)的帮助下进行 - 该指标不使用指标缓冲区。 该指标没有设置 - 在“D1”时间帧的最后 500 根柱上执行水平搜索,并且此参数在代码中硬连线。 手动交易: 手动交易时,建议在从“M10”到“H1”的时间范围内使用该指标。它可以用于两种策略:突破水平和从水平反弹,或两种策略的组合。要记住的主要事情是,每日级别的绘制有三到四天的延迟 - 这是级别形成的最短时间。在极少数情况下,如果趋势在三到四天内发生剧烈变化,水平可能会消失。 如果使用更保守的交易,那么您需要从其他指标(趋势或震荡指标)寻找确认。 如果这些级别接近一个级别,则可以使用不突破一个级别而是两个或三个级别的策略。
The Bounce strength indicator (BSI) for meta trader 5 illustrates the strength of the market bounce. The +10 and -10 extreme bounds are used by the indicator. The blue bars show a bullish bounce, while the pink bars show a bearish bounce. The indicator, in essence, depicts market volatility for both up and down moves. When utilized appropriately, the indicator performs equally well on all currency pairs and produces encouraging returns.

This is diamond! Contact me to send you instruction and add you in group.
Diamond Pattern is based on Read The Market(RTM) concepts. The purpose of this model is to face the big players of the market (financial institutions and banks), As you know in financial markets, big traders try to fool small traders, but RTM prevent traders from getting trapped. This style is formed in terms of price candles and presented according to market supply and demand areas and no price oscillator is used in
Extreme Price Meter 根据历史市场信息,该指标计算下一个极有可能出现逆转的价格极值。 它会生成 2 个价格区间,其中买入或卖出的可能性很高。 考虑到蜡烛在概率带外收盘时放置的箭头,很容易看出该指标的高精度。 桌面、电话和电子邮件的通知。
________________________________________________________ ________________________________________________________ ________________________________________________________ ________________________________________________________
This is MT5 version of StochScanner It scans Stochastic from Multi Symbols and Multi Timeframes and displayed on the dashboard on a single chart. . 4 scanning modes: 1. Mode OverBought/OverSold Indicator scans Overbought and OverSold . OverBought : current stochastic is above level 80 and OverSold : current stochastic is below level 20 2. Mode Signal It means if the previous stochastic is on OverBought or OverSold ( either Main Line and Signal Line ) and the current Main Line cross over the curr
该指标适用于两个时间段 , 直接在工作图表上直观显示事件 , 并能够显示用作支撑 / 阻力水平的水平水平。 形成的交易量的不同 值显示为相应柱上的彩色标记 , 从中构建水平 , 指向图表的右侧。 在工作 图表上 , 还显示了从较早时间段收到的水平。 级别的显示及其属性在指标设置中设置。 已成 为时间段的级别通常具有更高的优先级。 每个 级别都有一个工具提示 , 其中包含有关该级别的必要信息。 平均范 围值 ( ATR ) 用于 获取实际水平。 可以同 时使用报价和实际 ( 如果可用 ) 交易量值。 交易量指 标基于指标 “ 更好的交易量指 标 ” 中 实施的 想法。 指 标算法适用于当前时刻 , 不适用于分析历史数据。 显示事件 VCU - 大范 围内的成交量高潮 VCN - 大柱 线范围内的成交量高潮中性 VCD - 大条形范 围内的音量降低高潮 HVC - 低酒吧范 围内的高音量 VCHVC - VCU 、 VCN 、 VCD 的 组合 LV - 低酒吧音量 * 指 标显示的事件的更详细描述在原始名称下的公共领域。 输入参 数 Volume mode: Tick / Rea
该指标适用于两个时间段 , 直接在工作图表上直观显示波浪并显示水平波浪水平。 ZigZag 指 标将价格图表上的重要顶部和底部与可见的斜线连接起来 , 从而更容易感知波浪运动并将波浪按级别划分为范围。 极 值按最高价 \ 最低价或收 盘价计算。 波浪水平投射到下一波浪上 , 这使您可以获得支撑 / 阻力水平。 使用斐波那契算法或使用 线性关系计算水平。 已成 为时间段的级别通常具有更高的优先级。 每个 级别都有一个工具提示 , 其中包含有关该级别的必要信息。 ZigZag 指 标的一个特点是资产价格的变化会导致先前值的变化 , 仅根据此类水平做出交易决策时应考虑到这一点。 但是 , 此 类水平可以判断报价和价格价值的可能移动方向 , 其中可以改变方向或减慢移动速度。 指 标算法适用于当前时刻 , 不适用于分析历史数据。 输入参数 High period for plotting - 绘图水平高周期 Waves plotting mode - 水平 绘图模式( Close 或 HighLow ) Levels plotting mode - 水平 绘图模式( Fibo 或 Line
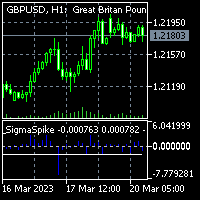
To get access to MT4 version please click here . - This is the exact conversion from TradingView: "SigmaSpikes(R) per Adam H. Grimes" by "irdoj75" - This is a light-load processing and non-repaint indicator. - All input options are available. - Buffers are available for processing in EAs. - You can message in private chat for further changes you need. Thanks for downloading

缠论分型指标
特点: 进行了彻底的包含关系的处理 可以方便的使用EA调用判断是否是顶底分型,以及 《教你炒股票93:走势结构的两重表里关系2》里的状态
用箭头显示顶底分型 用不同的颜色显示可能的笔
两相邻K线的包含关系给出一个定义:一根K线的高低点全部在其相邻K线的范围之内,那么这根K线和其相邻K线就为包含关系
K线走势图中,经常会看到一些有包含关系的K线。所谓包含处理,就是将有包含关系的两根K线合并成一根K线。
定义:三根经包含处理后的连续K线,若中间那根K线的高点最高,那么这种组合形态就叫顶分型。
定义:三根经过包含处理后的连续K线,若中间的那根K线的低点最低,那么这种组合形态就叫做底分型。
EA调用的指标数组: 0.Open合并后K线的开仓价 1.High 合并后的高点 2.Low 合并后的低点 3.Close合并后的平仓价 4.Up 顶分型 5.Down 底分型 6.Trend 向上还是向下(1,-1) 7.State 行进(1,0)

Candlestick bar, you can call it Candlestick Scalping Beast(CBS). This indicator is made specifically for scalping. The strategy on the indicator is that it gives signal on the close of a candle following this rule, if the close of the candle/bar is high then the previous candle/bar ,then it is a buying signal (up-trend),a green arrow and if the close of the candle/bar is lower than the previous candle/bar , then it is a selling signal (Downtrend), a red arrow. And the ATR is a secrete recipe

Murrey Math Lines The concept of this technical analysis system was developed by T. Henning Murrey in 1995 and described in The Murrey Math Trading System; For All Markets. The main concept here is that all markets behave in the same manner based upon the observations made by W.D. Gann. To date, the Murrey Math Line X it is one the most popular methods of Forex analysis and trading. Formula The Murrey Math Line X is calculated with the help of price movement segment, which, in accordance to Gan
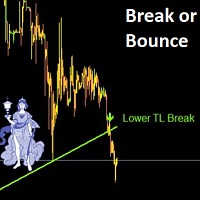
Trade like a pro and never miss Break or Bounce of a Support or Resistence Line
Get alert and suggested Trading points (entry, TP1, TP2 and SL) whenever there is a break of - Break or Bounce from Pivot Point Support or Resistence - Break or Bounce from a Trendline (upper and lower Trendline) - High and Low of a previous period Any suggestion on other types of Support / Resistence to add are more than welcome

NO repaint, NO misleading statistics, NO hidden mechanisms – only proven mathematics using the famous Fibonacci retracement levels.
This indicator finds bearish Fibonacci retracement levels using a dynamic seeking engine, and tells where current price is relative to the levels, continuously for all candles. No need to redraw the levels manually when market structure changes - this indicator dynamically adjusts to the most recent structure. See the levels and price location from the indicator

Profesyonel iş hayatı boyunca sızma testleri ve güvenlik danışmanlığı konusunda birçok firmaya hizmet veren Tekno Fatih, web uygulama, mobil uygulama, network&sistem, kablosuz ağ gibi birçok alanda sızma testleri yapmış olup siber olaylara müdahale, ddos testleri ve kaynak kod analizi projelerinde de yer almıştır. Siber güvenlik alanında birçok konferansta yerini almıştır. Amerika Savunma Bakanlığına bağlı olan NSA.gov ( Ulusal Güvenlik Teşkilatı )'inde ve NGA.mil ( Ulusal Coğrafya-İstihbarat T

As well as SuperTrend, SuperTrend Alerts offers alerts . You can also get alerts with SuperTrend Alerts . Besides SuperTrend, SuperTrend Alerts also offers alerts . SuperTrend Alerts offers alerts along with SuperTrend . In addition to SuperTrend, SuperTrend Alerts has alerts . Also , SuperTrend Alerts offers alerts . The SuperTrend Alerts add-on works with SuperTrend as well. As well as SuperTrend, SuperTrend Alerts has alerts too .

Smart Tape - это индикатор ленты всех сделок с возможностью агрегации по цене и времени и фильтрацией по величине объема, включает в себя два отключаемых варианта отображения. Вариант 1: перемещаемое окно по графику со списком сделок (Time Sales). Список обновляется сверху вниз и не имеет возможности просмотра истории. Количество отображаемых строк выбирается пользователем. Порядок отображения в строке: время с точностью до миллисекунд, тип сделки (B - покупка или S - продажа
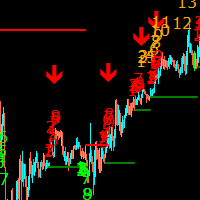
The Sequential Ultimate Indicator is a modified version of the Ultimate Oscillator that adds a sequential component to the calculation. It is designed to identify potential trend reversals by looking for divergences between the price action and the oscillator. The Sequential Ultimate Indicator works by adding a sequential count to the Ultimate Oscillator readings. The sequential count starts at 1 when the oscillator moves above 70 or below 30 and continues until a price reversal occurs. The sequ

该指标旨在确定一天内最大交易活动的时间。 计算完成后,指标建立最重要的交易水平。 将这些水平与实际价格行为进行比较可以提供有关市场趋势强度和方向的信息。
指标的特点 时间范围必须低于 D1。 推荐时间范围:M15、M30 和 H1。 H1 以上的时间框架可以给出非常粗略的画面。 使用低于 M15 的时间框架可能会导致短暂的交易爆发。 该指标对历史数据敏感。 因此,我建议在图表窗口中至少设置 50,000 个柱。
指标参数 Base - 设置计算交易活动的基准期。 day - 计算交易活动时考虑了一天中的时间。 week – 交易活动的计算考虑了一天中的时间和一周中的某一天。
Width - 线宽。 ClrMean、ClrUp 和 ClrDn 是中、上、下交易水平的颜色。 Style1 - Style5 – 显示交易水平的样式。
AlertsOn - 打开交易时段开始的通知。 MailOn - 启用将消息发送到电子邮件的权限。 NotificationOn - 允许向移动终端发送消息。

uGenesys AI - 90% Accurate Daytrading Indicator
Introducing the ultimate forex trading indicator system, uGenesys AI, powered by cutting-edge AI technology and advanced analytical techniques, including Time-Series Analysis and Genetic Algorithms. Our AI-powered trading system leverages the power of time-series analysis to identify trends and patterns in historical price data, allowing traders to make informed predictions about future market movements. By analyzing vast amounts of data, our sys
This is a simple arrow system based on MACD indicators Main/Base line and MACD Levels. It gives you alerts when MACD's Main Line crosses above/below certain level. Which type of alerts available? 1. It paints on chart Up/Down Arrows. 2. Popup message and sound alert in trading terminal window. 3. Push notification or Alert on your android and ios mobile phones (requires MT4 or MT5 app installed!)

Simple supply and demand indicator which should help identify and visualize S&D zones. Settings:
Color for supply zones, color for demand zones - default colors are set for dark (black) background.
Number of how much zones should be created above and below current price - value "3" means there will be 3 zones above current price and 3 zones below current price. Principle:
When price creates "V", reversal zone is registered. Rectangle filled based on zone type (supply / demand) is drawn if pri

This is a simple arrow system based on Engulfing Candlestick Pattern. It gives you alerts on your smartphone when there is an engulfing candlestick pattern happens. Which type of alerts available? 1. It paints on chart Up/Down Arrows. 2. Popup message and sound alert in trading terminal window. 3. Push notification or Alert on your Android and IOS mobile phones (requires MT4 or MT5 app installed!) *Note: Use it on higher timeframes like H4 (4 hours), D1 (1 Day) then find trade opportunities on s

Displays trends in current chart. You can display trends of multiple timeframes in one chart by inserting this indicator as often as you want. Key features: displays trend line by finding highs and lows counts number of high/low of current trend in different color (long/short) allows you to display multiple timeframe trends in one chart Settings: Indicator Name: if you want to show M5 and H1 on one chart add TITrend twice to your current chart and rename M5 to "TITrendM5" and H1 to "TITrendH1" C

Introducing "Congestion Breakout MT5" - the indicator that helps you identify congestion zones in your chart and alerts you when the price breaks through them. Traders know that congestion zones can be key areas of price action and can indicate potential turning points in the market. However, spotting these zones and anticipating breakouts can be a difficult and time-consuming task. That's where "Congestion Breakout" comes in. This powerful indicator uses advanced algorithms to analyze the pri
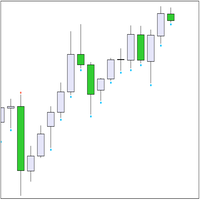
趋势指标“Trend Two Moving Average”使用两种箭头来显示计算结果 - 它们是“Trend UP”和“Trend DN”。 箭头“向上趋势” 绘制 经过 价格 '低的' 酒吧 , A 箭头“趋势 DN”- 经过 价格 '高的'。 趋势搜索算法基于对柱线价格和两个“移动平均线”指标值的分析。趋势方向是在当前(零)柱上计算的。因此,建议使用来自 bar #1 的信号 - 来自完全形成的 bar。 在交易中使用指标。 使用趋势指标,您可以同时使用风险策略(当信号来自当前柱时)和风险较低的策略(当信号来自柱 #1 时)。下面描述了基于来自柱 #1 的信号的策略 。 等待生成的信号( 此刻 新柱的出现,您需要查看柱 #1) 。 如果 在吧台上 #1 是 Arrow ,我们在市场上交易,或使用挂单: 1.按箭头方向开仓 2. 根据箭头的水平 放置挂单( Limit )

Indicator ICT Implied Fair Value Gap (IFVG) is an important part of the Smart Money Concepts (SMC) system. It looks for and shows on the chart a modern pattern - the Fair Value Gap ( FVG ). This pattern is a three candlestick imbalance formation based on the discovery of a mismatch between supply and demand. This happens when the price moves quickly in one direction without encountering resistance. The result is a "gap", which can be filled in later. The indicator finds this pattern using the up

it depends on ATR period to get swing points to help make better trading decisions blue dot and red dot is the default color scheme of course you can change it later if you'd like you can change the following : ATR PERIOD sending notifications number of times to send notifications sending notifications to your smart phone that's it very simple to use just drag and drop and follow the trend

This Indicator is based on the Indice gaps between todays open price and yesturdays closing price. On Metatrader these are not shown as we only see a 24hr chart. If we want to know the gap between the open at 16:30 and yesturdays close at 23:30 on the SP500 this EA will reveal the gap. On Indices these types of Gap close approximately 60% of the time within the same day and is demonstrated on the panel which records previous gap closures and provides to the user a statistical proof of gaps clos

it depends on channels and moving average in sketching the chart in two colors the default colors are gold and light blue to highlight the area of downtrend and the area of uptrend TO ADJUST THE INDICATOR YOU CAN CHNGE THE FOLLOWING: 1- the look back period which affects the length of the moving average 2- the multiplier which affects the point of swing in the trend 3- the channel shift which affects how close the line is moving to the price the default settings are the best for the indicator B
This is a modern MACD indicator based on regular MACD indicator. It also has alert system included. This indicator gives you alerts when base line of MACD indicator crosses above or below Zero level so you can look for Buy or Sell opportunity. Available Alerts: 1. Audible Alerts on Chart / Trading Terminal window. 2. Alerts on your email. 3. Alerts on your mobile phone. Type of Alerts Explained: 1. Audible_Chart_Alerts - Audible alerts and Popup message on your computer’s tr

An indicator based on support and resistance levels with many signals (per candle) Can be used in all time frames Can be used in all symbol Blue lines: upward trend. Red lines: downward trend
How It work: This indicator gives signals based on support and resistance levels as well as some complex calculations. Based on past data
As you know, one of the most important trade options are support and resistance levels.
Get good signals using this indicator.
How To work: Run the indicator.

You can change the time period of the chart at the touch of a button. You can also change multiple charts at the touch of a button. You can also change multiple charts at the touch of a button, saving you the trouble of changing time periods.
We are live-streaming the actual operation of the system. Please check for yourself if it is usable. Please check it out for yourself. https://www.youtube.com/@ganesha_forex
We do not guarantee your investment results. Investments should be made at y
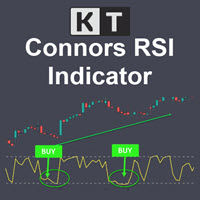
KT Connors RSI is a modified and more advanced version of the original Connors RSI developed by Larry Connors. It was designed to help traders generate trade signals based on short-term price movements.
The Connors combine the standard RSI calculation with two additional elements: a short-term RSI, ROC, and a moving average.
Features Provides more transparent and more actionable buy and sell signals using the overbought/oversold zones. Incorporates short-term RSI and moving average, provid

AutoScroll automatically scrolls the chart by the set width (pips). You can see the next milestone without having to operate the chart yourself. You can concentrate on trading.
We are live-streaming the actual operation of the system. Please check for yourself if it is usable. Please check it out for yourself. https://www.youtube.com/@ganesha_forex
We do not guarantee your investment results. Investments should be made at your own risk. We sharll not be liable for any disadvantage or damage

The time until the end of the bar is counted down. Therefore, you can time your order while watching the chart. You can concentrate on your trading.
We are live-streaming the actual operation of the system. Please check for yourself if it is usable. Please check it out for yourself. https://www.youtube.com/@ganesha_forex
We do not guarantee your investment results. Investments should be made at your own risk. We sharll not be liable for any disadvantage or damage caused by the use of the in

Fibonacci automatically draws Fibonacci retracement, Because Fibonacci automatically draws Fibonacci retracement, you can know at a glance the price to buy at a push or sell back. Therefore, you can trade in favorable conditions in a trending market.
We are live-streaming the actual operation of the system. Please check for yourself if it is usable. Please check it out for yourself. https://www.youtube.com/@ganesha_forex
We do not guarantee your investment results. Investments should be mad

The system automatically draws resistance and support lines, The system automatically draws resistance and support lines, so you can see at a glance the price range where you are most likely to encounter resistance. Therefore, you can trade in price zones where you are less likely to encounter resistance.
We are live-streaming the actual operation of the system. Please check for yourself if it is usable. Please check it out for yourself. https://www.youtube.com/@ganesha_forex
We do not guar

介绍 RSIScalperPro - 这款基于 RSI 指标的革命性交易指标适用于 MetaTrader 5,专为一分钟图表的剖刺交易而设计。借助 RSIScalperPro,您将拥有一个强大的工具箱,用于精确的入场和出场信号,提升您的交易水平。 RSIScalperPro 使用两种不同的 RSI 指标,为超买和超卖区域提供清晰的信号。您可以根据自己的偏好自定义两个 RSI 的时间周期和限制值,以实现您的交易策略的最佳效果。图表上的明显箭头使您可以轻松识别何时进入或退出交易。 RSIScalperPro 的另一个亮点是三个可自定义的移动平均线,帮助您识别趋势方向并确认强大的交易信号。这使您可以早早发现趋势并参与到盈利交易中。 此外,您可以设置 RSIScalperPro 发出每个新交易信号的听觉警报。这样,即使您不经常坐在计算机屏幕前,也不会错过任何重要的交易机会。 RSIScalperPro 提供用户友好的界面,并且在 MetaTrader 5 中很容易插入和配置。您可以根据个人交易偏好自定义指标,并利用其多样化的功能,提高交易成果。 利用 RSIScalperPro 的优势,提高

The TrendLinePro indicator for MetaTrader 5 creates a trend line based on the last candle highs and lows. The number of candles to be used to determine the direction can be selected yourself. The trend line can also be used to set an SL. Changes in trend directions can optionally be displayed with an arrow. Input Parameters: Number of Candles for Distance: 3 Display Direction Changes Arrows: false

DYJ超级趋势波是一个高度准确的波峰波谷交易系统。 这个指标在进出市场时寻找蜡烛线的最高点和最低点。 入口价格在最高点或者最低点附近.
信号的通知类型已被添加到DYJ超级趋势波。 当产生多空间信号时, 可以使用以下类型的通知信号: Alert mailSend MobilePush 参数 InpSignalPeriod = 10 BarDistance = 24 InpIsAlert = true
========================== DYJ SuperTrendWave is a highly accurate trading system.
This indicator looks for the highest and lowest points of candles as entering and leaving the market. The notification type of signal has been added to the dyj supertrend. When a multi-space signal is generated, T

Slopes are an increasingly key concept in Technical Analysis. The most basic type is to calculate them on the prices, but also on technical indicators such as moving averages and the RSI.
In technical analysis, you generally use the RSI to detect imminent reversal moves within a range. In the case of the Blue indicator, we are calculating the slope of the market price and then calculating the RSI of that slope in order to detect instances of reversal.
The Blue indicator is therefore used

If you are using naked eyes to find candlestick patterns on your chart it's a good thing but it requires your time and attention and still you miss some patterns here and there. Don't worry! This indicator will help you to find "Harami Candlestick Pattern" on your chart very easily. *Note: Default inputs are set for EURUSD H1 (1 hour) timeframe. This is an alert system which gives you alerts whenever harami candlestick pattern happens. Types of alerts it can give you are: 1. Audible Alerts - Thi
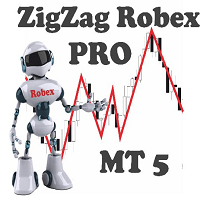
Intelligent ZigZag indicator.
It has only two settings. The higher the values, the more significant extreme values it shows.
Application area.
To determine the trend. Line drawing direction.
To recognize multiple patterns.
If you put two indicators on one chart with fast and slow values. By changing the color of one of them, you can very well decompose the price movement into waves.
The indicator can be a great helper for marking the chart and identifying the key levels from which t
Add an image or logo on a chart. Parameters: "File name for On mode" - location of image file depending MQL5 folder. "Background object" - set the logo as a background object. “x”, “y” – coordinates on the chart, from which the logo shows. If you want to delete the logo, just remove ea from the chart. The suggested resolution for the image is 200x200 pixels. You can use this ea while recording a video.

Versus USD calculates the price variation of each major currency against the USD and displays a clear and comparative view of their performance for each period or bar indexed by the cursor in the current Timeframe of the chart with progress bars . Additionally, it marks an arrow on the bar/period where the currency in question experienced the highest or lowest rate of change against the USD compared to other currencies, thus providing a more precise measure of the currency's pe
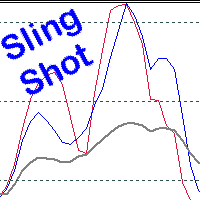
Scalping, Mean reversion or Position trading strategy
Get into an established trend on a pullback in the market. Use the Pinch in the indicator for profit taking. Use the Pinch as a mean reversion strategy, scalping back to a moving average line.
Input Parameters Fast Sling Shot configuration. Slow Sling Shot configuration. Dual Sling Shot configuration. Price line configuration. Trigger zones or levels. Example of Sling Shot trade idea: Price line sets the mood, below the baseline level (5

The Breakout Line in technical analysis serves as a crucial tool for understanding market dynamics and potential shifts in price direction. It's designed to highlight rapid accelerations or declines in the market's trajectory. Unconventional Analysis : The Breakout Line is not your typical technical indicator; it's tailored to capture swift market movements, offering a unique perspective on price trends. Angle of the Breakout Line : The sharper the angle formed by the Breakout Line, the stronger
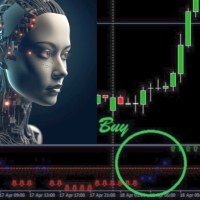
Introducing Trend Fusion 444F, a powerful MQL4 indicator designed to determine market direction using multiple trading indicators. This comprehensive tool offers a unique fusion of technical analysis techniques that help traders make informed decisions in various market conditions. Key Features: Comprehensive Analysis: Trend Fusion 444F combines several widely-used trading indicators to provide a multi-dimensional view of the market. The indicators include Moving Averages, MACD, RSI, DeMarker,

INTRODUCTION The Fib Autotrendline is a basic tool that analysts use to find out when a security's trend is reversing. By determining the support and resistance areas , it helps to identify significant changes in price while filtering out short-term fluctuations, thus eliminating the noise of everyday market conditions. It is an excellent tool for any trader who follows indicators that use swing highs and swing lows . How to Use the fib Auto Trendline Indicator The Fib Auto Trendline

Supply and Demand Indicator + FREE Currency Strength Meter ADD-ON Looking for a powerful tool that can help you identify the most reactive zones in the forex market? Our supply and demand indicator for MetaTrader 4 and 5 is exactly what you need. With its advanced algorithms and real-time analysis, this indicator helps traders of all experience levels make informed trading decisions. The supply and demand indicator is a cutting-edge tool that helps traders identify areas where buyers and sellers
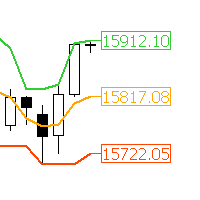
"AV Donchian Channel MT5" is an indicator for MetaTrader 5, which shows the current prices of the donchian channels and the middle line.
Multiple AV Donchian Channel indicators can be placed on one chart. The center line can be used for trailing.
See also Richard Dennis Turtle Trader strategy.
Settings:
- Donchian Channel Period
- Colors and widths of the lines
- Colors and widths of price labels
Please report bugs to me.

50% Off Today Only! Price Goes Back Up at 11 PM (EST)
uGenesys Volume Indicator: Your Key to Mastering Market Volume Analysis What Traders Are Saying: "A must-have indicator...really a game-changer." – wuzzy66 "Amazing indicator...strongly recommend to beginners." – joinbehar Understanding Market Volume: Volume in the market is a critical indicator of movement and opportunity. The uGenesys Volume Indicator is specially crafted to pinpoint when the market has the most volume, allowing you t

A pivot point is an intraday technical indicator used to identify trends and reversals mainly in equities, commodities, and forex markets . Pivot points are calculated to determine levels in which the sentiment of the market could change from bullish to bearish, and vice-versa.
the swing daily is an advanced pivot points indicator that grants the user control over many aspects of the trading levels that you'll get familiar with in the controls section it's used mainly to locate intraday

带有 MT5 警报的自动固定范围交易量配置文件
该指标显示价格花费更多时间的位置,突出可用于交易的重要水平。
并且可以显示随时间变化的价格密度,概述给定交易时段最重要的价格水平、价值区域和控制价值。 该指标可以附加到 M1 和 D1 之间的时间范围,并将显示每日、每周、每月甚至日内时段的市场概况。 较低的时间范围提供更高的精度。 建议使用更高的时间范围以获得更好的可见性。 还可以使用自由绘制的矩形会话在任何时间范围内创建自定义市场概况。 六种不同的配色方案可用于绘制配置文件的块。 也可以将配置文件绘制为纯色直方图。 或者,您可以选择根据看涨/看跌柱线为配置文件着色。 该指标基于裸价行为,不使用任何标准指标。
一个警报系统可用于价格跨越价值区域的高低、中值和单一打印区域的水平。
输入设置:
StartFromDate(默认 = __DATE__)— 如果 StartFromCurrentSession 为假,则指标将从该日期开始绘制配置文件。 它吸引了过去。 例如,如果您将其设置为 2018-01-20 并且 SessionsToCount 为 2,则它将绘制 20

The best instrument for scalping. It allows you to always be correctly positioned in the price. It's a simple and extraordinarily powerful visual reference. Very suitable for price action. It consists of four components. 1. Fork. There are two levels that surround the price and mark the rebound points. They can be varied independently with 4 associated controls, two for each level. Its amplitude is indicated in pips in the indicator data. The minimum fork is updated with each tick. It has
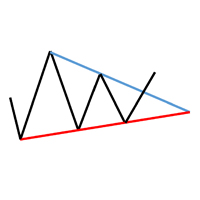
The TrianglesPro indicator for MetaTrader5 draws triangles on the chart based on the local highs and lows. The length of the trendlines can be limited. Optionally, you can display the highs and lows that are used to determine the triangles. It is also possible to determine how far back the identification of triangles should start. Also check out my other indicators.
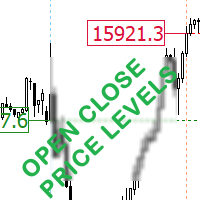
This indicator displays the open and closing price for the selected number of days. Easily identify market open and close Gaps. Select the Day icon to show the open and closing price line. Select the Time icon to show the open and closing hours. Indices and stocks are not a 24hour market as shown on MT5 charts, they open and close at specific times. Marketplace
Time Zone
Trading Hours
New York Stock Exchange (NYSE)
EDT
9:30 a.m. to 4:00 p.m.
Nasdaq Stock Market
EDT
9:30 a.m. to 4

The fate of a trade depends on knowing the direction of the price trend. Whatever style you trade, you must know that the direction of the main market trend is in the hands of buyers or sell
YZD Trend indicator helps you to find the main direction by using mathematical parameters and ATR This indicator is a good supplement for your strategy, especially price action, which can reduce your trade losses.
How to use: YZD Trend indicator consists of two ranges in the form of bands, when th
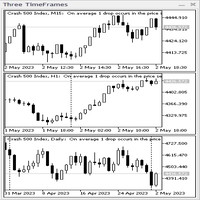
三个时间帧指示器面板。 该指标以基于 CAppDialog 类的面板形式制作。可以使用鼠标将面板最小化或在当前图表周围移动。 该指标在面板中显示当前交易品种的三个时间帧。在当前版本中,指标具有最少数量的设置 - 这些是三个时间帧的参数:“较新时间帧”、“ 中间 时间帧 ”和“ 较旧 时间帧 ”。 启动时,指标面板会自动复制当前图表的所有属性并将它们应用到三个时间帧(例如,背景颜色、条形颜色、网格、周期分隔符、交易量...)。但是:指标面板不会复制 EA 交易和其他三个时间帧的指标。 如果您更改了当前图表的属性,则将仅应用三个时间帧的更改:删除并重新附加指标面板后或切换当前图表的时间帧后。 指标的应用。 推荐作为手动交易的助手 - 它可以让您节省空间,同时了解三个额外时间框架的价格结构。

--- StudentK Sync Chart --- 1. Move charts at the same time 2. Cross check among different Symbols and Timeframes 3. Plan your own trading strategies
--- Context --- StudentK is not indicated as a master or K Sir for knowledgeable person who claims for winning all the time. (But lots of traders should know the fact that it is rarely truth, especially in fluctuated period of time)
StudentK is a group of years-experienced traders who want to share amazing tools in Free and Paid versions. Aimi

正在寻找一个强大的指标来让您的交易更上一层楼? 看看我们独特的基于 RSI 的指标,它结合了 MQL5中最好的相对强度指数 (RSI)、移动平均线和 Heiken-Ashi 指标。
我们的指标提供无任何滞后的实时数据,让您自信地做出明智的交易决策。 它非常适合所有级别的交易者,从初学者到专家。
通过可自定义的设置和参数,您可以轻松地根据您的交易风格和偏好调整指标。 无论您是日内交易者还是长线投资者,我们基于 RSI 的指标都可以帮助您识别趋势反转并最大化您的利润。
我们技术娴熟的开发人员团队孜孜不倦地创建了一个提供无与伦比的准确性和性能的指标。 通过结合 RSI、移动平均线和 Heiken-Ashi 指标,我们为希望保持领先地位的交易者创建了一个真正的强大工具。
它是 RSI、移动平均线和 Heiken-Ashi 指标的强大组合,没有它您就不想交易。
100% 不重涂 100% 无延迟
MetaTrader 市场 - 在您的交易程序端可以直接使用为交易者提供的自动交易和技术指标。
MQL5.community 支付系统 提供给MQL5.com 网站所有已注册用户用于MetaTrade服务方面的事务。您可以使用WebMoney,PayPal 或银行卡进行存取款。
您错过了交易机会:
- 免费交易应用程序
- 8,000+信号可供复制
- 探索金融市场的经济新闻
注册
登录