适用于MetaTrader 5的技术指标 - 36
Professional traders know that volume is the fuel for price movement. Large players try to hide their true intentions, but they can be recognized by volume bursts. The standard vertical volume does not show us specific price levels, but the cluster volume and especially its surges provide a very clear picture and specific price levels (areas).
The DBS Cluster Search indicator searches for clusters of the specified size in tick data and highlights them with colored figures on the chart. These
Time Adjusted ATR The Time Adjusted ATR indicator is used to determine the anomalous volatility for exactly specified time of day. The indicator is useful for early identification of reversals, breakthroughs and considering volatility corrections. Options • ATR period: the number of bars of the standard ATR indicator for which the averaging is taken (recommended value = 1). • Normalized Base: how many days (bars) are used to calculate normalization (recommended value = 10 ~ 50). How is "Time

Gamma Bands 这个指标用变色柱子来显示趋势。简单易用。 使用方法: 如果柱子从青色变成紫红色,意味着趋势向上了。 如果柱子从紫红色变成青色,意味着趋势向下了。 参数: MaPeriods: 移动均线周期。 f1: 内层通道扩展系数。 f2: 外层通道扩展系数。 Popup Window Alert Email Alert Mobile Push Alert 报警: 当趋势发生改变后,从多头改成空头,或者空头改成多头 当价格从下向上穿越最上边的外层通道时,报警平多单 当价格从上向下穿越最下边的外层通道时,报警平空单 MT4版本: Gamma Bands 简单易用,回调是加仓做多,反弹是加仓做空.可以根据内层通道设置较小的止损,可以达到以以小博大的目的. 我们知道,没有完美的指标,需要配合你的策略,最终是依赖资金管理. 盈亏比和胜率就像鱼和熊掌不可兼得, 也就是盈亏比和胜率你只能搞定其中之一.

This indicator calculates the Daily VWAP and projects its Bands in 3 upper levels and 3 lower levels (Supports and Resistances), offset by the Standard Deviation selected by the user.
How to configure: Choose the symbol and the desired graphic time; Choose the type of price that is most suitable to calculate the Desired VWAP; Choose whether or not you want the Bands to be plotted; Choose the type of Volume you want to use (Ticks or Real); Choose the type of Calculation of the Bands (Deviation
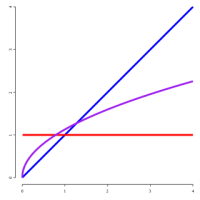
From https://en.wikipedia.org/wiki/Fractional_calculus:
Fractional calculus is a branch of mathematical analysis that studies the several different possibilities of defining real number powers or complex number powers of the differentiation operator D
This indicator execute fracional differentiation on data, you can select the differentiation D value and execute some tweaks like execute Log(value) before difefrentiation or execute a window normalization on last [diffNormalizeWindo
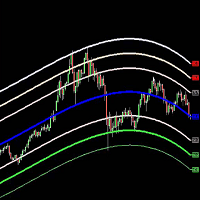
The Belkhayate center of gravity indicator is best used to confirm major turning points, and distinguish price extremes. Generally if price reaches the upper or lower levels one should expect a turn around coming soon, or at least a pull back towards the centre line if there is a strong trend. The upper and lower levels are red and green lines.
Our indicator use the same parameters as the well known trader M.Mostafa Belkhayate the inventor of the indicator, allow the use of buffers for your EA
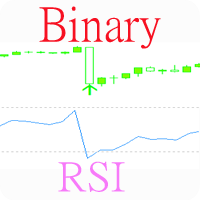
Индикатор, показывающий моменты пересечения важных уровней индикатора RSI. Может быть использован для поиска моментов пересечения уровней для успешной торговли на отскок или по тренду. Подходит для бинарной торговли, т.к. имеется возможность посчитать точность сигналов, в зависимости от времени экспирации.
Входные параметры Inform about finding the signal - параметр, отвечающий за получение уведомлений (Alert) о найденном сигнале. По умолчанию - да Show Panel - Показать/ скрыть панель Period
This indicator implements the well-known trend trading strategy for Stochastic, with two levels for purchases (40 and 80) and two levels for sales (60 and 20). When an upward movement begins, the oversold level rises, from 20 to 40. When there is a downward movement, the overbought level goes down, from 80 to 60. Thus, the strategy has 4 levels. Obviously, tracking signals using the usual 4-level Stochastic is not very convenient, therefore, this indicator illuminates the inputs and outputs with

TradeLeader PD - Pontos Decisivos
O indicador TradeLeader PD completa seu trade system com as informações realmente relevantes.
No painel você verá diversas informações consolidadas e sua relação com o preço. Compare os fluxos de compras e vendas(agressão), delta e muito mais.
Veja abaixo o que somente o TradeLeader PD pode oferecer em um só indicador, elevando o Metatrader a outras plataformas profissionais especializadas.
Painel Variação em porcentagem e ícone. Livro de ofertas: Resist
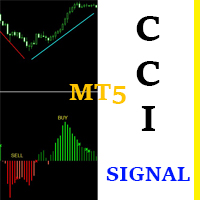
CCI Signal This indicator is based on a custom CCI that is colored to reflect the trend. It was created with the idea in mind: "THE TREND IS YOUR FRIEND". It is simple and easy to use. Even a newbie can understand and use it to achieve great trade results. Simply follow the colors. RED means SELL. GREEN means BUY. It DOES NOT repaint and can be used for Scalping, Day Trading and Swing Trading. It can be used for any time-frame and any currency pair. CCI Signal is highly reliable and provides p
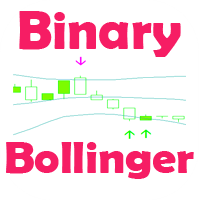
Стрелочный индикатор, выдающий сигнал при пересечении канала боллинждера. Сигналы выдаются в виде стрелок и подходят для торговли бинарными опционами.
Входные параметры Period of BB - период боллинджера Shift of BB - смещение боллинджера Deviation of BB - отклонение боллинджера Type of BB Signals - тип поиска сигналов Invert signals - Возможность давать инвертированные сигналы (для работы по тренду) Inform about finding the signal - параметр, отвечающий за получение уведомлений (Alert) о н
Стрелочный индикатор, выдающий сигнал при пересечении 2 SMA. Сигналы выдаются в виде стрелок и подходят для торговли бинарными опционами.
Входные параметры First period- период 1 MA Second period - период 2 MA Invert signals - Возможность давать инвертированные сигналы (для работы по тренду) Candles to count - количество свечей для подсчета статистики Expiration - время экспирации сигнала Length - расстояние для сигналов Особенности :
Возможность использовать инверсию сигналов Возможн

Индикатор, показывающий момент преодоления нулевой отметки индикатора MACD. Подходит для бинарной торговли, т.к. имеется возможность посчитать точность сигналов, в зависимости от времени экспирации.
Входные параметры Period of SMA1 - Период 1 скользящей средней Period of SMA2 - Период 2 скользящей средней Period of SMA3 - Период 3 скользящей средней Price Type - Тип цены, используемый индикатором MACD Invert signals - Возможность давать инвертированные сигналы (для работы по тренду) Infor

该指标是基于中值和移动平均特性的组合的顺序混合滤波器。
使用中值允许滤除价格序列值中的异常异常值和随机脉冲。同时,中值滤波器不会对价格变动的趋势起作用,而是保持不变。 由于中值滤波器是非线性的,因此使用简单移动平均值进行平均来平滑其值。这种方法使我们不仅可以更准确地识别趋势,还可以更准确地识别价格变动中的周期性成分。此外,它还增加了指标对价格变化的敏感度,并减少了价格序列与指标读数之间的延迟。因此,指标可以相当准确地警告新趋势的开始,以及旧趋势的结束。
您可以使用 FL 参数调整滤波器的深度及其灵敏度。其允许值为0到63.同时, 2 * FL + 1 条用于计算指标值。因此,FL值越大,指标显示价格图表的趋势越强。

该指标是两个改进的Lanczos滤波器的组合。 第一个过滤器用于推断价格。根据过去的价值,他预测当前柱内可能的价格变动。也就是说,它表明如果过去的趋势保持不变,价格会是多少。 第二个过滤器,用于平滑和平均窗口内的价格,由过滤器的级别决定。由于选择了权重,此过滤器最积极地响应价格变动中存在的周期性组件。 可以使用 EF 和 IF 参数调整指标。通过选择 EF 和 IF 的值,您可以获得有关趋势价格变动开始的信号。 EF - 指数滤波器的窗口大小。有效值为 EF = 0 ... 255 。并且在计算期间处理的条数是 2 * EF + 1 。该参数越大,价格序列的过去价值的影响越大。结果以实线绘制。 IF - 调整平均窗口的大小。 IF = 0 ... 255 的值。要计算的条数是 2 * IF + 1 。 IF 值越大,使用此过滤器检测到价格变动的较长时段。结果以虚线显示在图表上。
It's a simple indicator that execute GARCH(1,1) function, it can be used with basis stocks and options, when garch is bellow implied volatility probably implied volatility tend to goes down, and when garch is higher than implied volatility probably implied volatility goes up. Can be used with options trading when buying / selling volatility, for example, buy ATM put and call when garch is higher than implied volatility and sell when it's lower.

This indicator works in Brazil market, it should be used on options symbols. the indicator create 8 buffers, Delta, Gamma, Vega, Rho, Theta, Time(working days), Implied Volatility, R (interest rate), and can be used to view greeks over time. It shouldn't be used to trade, since it's cpu intensive, it's just a historic viewer, you can see what happened with greeks and teach friends :)

Oscillator trading signals - это динамический индикатор, определяющий состояние к продолжению тенденции роста или падению цены торгового инструмента и отсечению зон с нежелательной торговлей. Индикатор состоит из 2 линий осцилляторов. Медленная и быстрая сигнальная линия. Шкала отображения перевернутая. Зоны вблизи 0 свидетельствуют о тенденции роста цены валютной пары. Зоны -100 свидетельствуют о падении цены валютной пары. На основном графике в виде стрелок отображается потенциально выгодные
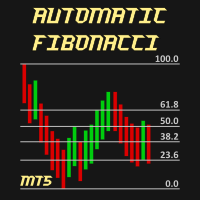
Automatic Fibonacci is an indicator for automatic Fibonacci Levels drawing. It is fully customizable by user. User can also select different Fibobonacci Levels by user settings or can use multiple Automatic Fibonacci indicator in one chart.
All details can be found >>HERE<<
Instructions Move Indicator to the chart (simply drag and drop) When pop up window appears select desired settings. Confirm settings and enjoy the Automatic Fibonacci indicator.
Features Any chart Any time-frame C

Ultra Trend Hunter
Indicador encargado de seguir la tendencia de cualquier par de divisas, índice, materia prima, futuros, etc. Fácil de usar y muy intuitivo, te permite jugar con la mejor configuración para cada símbolo permitiendo con ello lograr excelentes entradas y salidas de cada operación de compra o venta. Su gráfica te permite identificar cuando entrar en una operación de compra/venta y te indica cuando salir de esa operación. Una vez que el indicador cambia de color, se debe esperar
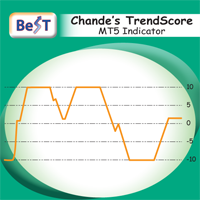
BeST_Chande TrendScore Indicator points the start of a trend with high degree of accuracy and it is amazing for scalping on the 1min timeframe. It is also a simple way to rate trend strength. It indicates both the direction and strength of a trend and can be easily combined with various trend-following, swing and scalping strategies.As of a trend’s direction and strength a value of +10 signals a strong uptrend while a value of -10 signals a strong downtrend. Generally a positive score shows an

ZigZag with backlight Fibonacci levels. The indicator has the ability to set any number of levels, the signals of the intersection of which can be sent to your mobile device email, as well as viewed via alerts. The indicator is designed to perform wave analysis, search for harmonic petterns, as well as search for other technical analysis figures. This Zigzag uses the principle of constructing extrema in which any trader will understand very easily. First, the indicator finds the upper and lower

Exit Area Ultimate 是一种技术指标,旨在通过在图表上指示每日 平均真实范围 (ATR) 和 平均每日汇率 (ADR) 水平来增强交易决策。通过了解这些水平,交易者可以轻松评估资产全天的平均变动。这个多功能指标为日内交易者提供多种用途,帮助下单、识别日内趋势、设置追踪止损水平以及建立每日获利水平。 该指标的主要特征之一是它依赖于 ATR 和 ADR 指标,这些指标提供了对市场波动和价格范围的宝贵见解。交易者可以使用此信息来确定适当的获利和止损水平,从而优化他们的风险管理策略。该指标还根据指示的水平计算剩余点数,从而可以快速评估潜在的利润或损失。 Exit Area Ultimate 与每个符号兼容,使交易者能够将其应用于广泛的资产。此外,每个指标级别都可以根据个人偏好和交易策略激活或停用。交易者可以根据他们的具体要求灵活地定制指标水平。 为确保及时通知,该指标提供手机、电子邮件和弹出式警报,让交易者随时了解重要的市场动态。这些警报可以快速配置和定制,以满足个人喜好。 在参数方面,Exit Area Ultimate 提供了 ATR 和 ADR 的各种设置。交易者可以调整

This indicator would help you I DENTIFY different HORIZONTAL SUPPORT / RESISTANCE LEVELS AND TRENDLINES.
ADVANTAGES: Use up till 5 different levels of Support and Resistance Use up till 5 different trend lines Use true/false options to display for Support/Resistance or Trend line Image
PARAMETERS: nPeriod: the time period to decide
Limits: the candles limit to look back
UseHorizontalLines: true/false option to display Horizontal Support and Resistance Lines UseTrendline: true/false opti

This indicator allows you to monitor and correlate several assets simultaneously. Using an operational reading technique applied in Multimarkets, the user is able to observe the behavior of other assets visible to the current asset that is operating. With this, the user's ability to make decisions becomes more robust and grounded.
The indicator has the capacity to list up to 4 assets, with the possibility, also, to change the type of quote and be used both for the current price and the past p

The Quantum GBPX is the latest addition to our suite of currency indices, and one which we have been asked for many times, and even more so since Brexit. It is an index which has taken us some time to develop, and through a series of complex calculations draws its primary data from a basket of currencies based on the old style dollar index, the Dixie. This is converted to a chart for the British pound. The result is an accurate index which describes strength and weakness for the GBP currency in

Hunter Trend: Arrow Indicator for Binary Options Trading Hunter Trend is an arrow indicator designed for trading binary options (turbo options) on the M1 timeframe, allowing for short-term trading opportunities. How to Trade with this Tool: Signals may appear when a candlestick forms. Once such a signal appears, wait for the closure of that candlestick. Upon the opening of a new candlestick, open a trade for 1-2 candlesticks in the indicated direction. In this case, for 1-2 minutes. A blue dot

The indicator compares quotes of a given symbol and a synthetic quote calculated from two specified referential symbols. The indicator is useful for checking Forex symbol behavior via corresponding stock indices and detecting their convergence/divergence which can forecast future price movements. The main idea is that all stock indices are quoted in particular currencies and therefore demonstrate correlation with Forex pairs where these currencies are used. When market makers decide to "buy" one

Sensey Candlestick Pattern Recognition Indicator Sensey is an advanced tool capable of accurately recognizing candlestick patterns. It not only detects patterns but also identifies price highs and lows over specific periods. Sensey works flawlessly across various timeframes and is compatible with all currency pairs, futures, and commodity markets. Unlike some other indicators, Sensey does not repaint historical data, providing reliable analysis even in cryptocurrency markets. You can verify its
This indicator implements the High Low Volatility Estimator based on Advances in Financial Machine Learning 2018 - Marcos Lopez de Prado, page 284. It's a robust estimator using High/Low values from past bars (configurable). It's robusto to Gaps (open/close of days to stock markets) since it's using high/low ration and not the close price. It's interesting when you need to avoid trading at a specific level of volatility
This indicator implements the Rool Model Estimator based on Advances in Financial Machine Learning 2018 - Marcos Lopez de Prado, page 283. It's a spread estimator using trade by trade (copytick) values from last trades (configurable). It works with low liquidity markets as a robust estimator considering the covariance between price diferences. It's interesting when you need to track spread changes
This indicator implements the Corwin and Schultz Estimator based on Advances in Financial Machine Learning 2018 - Marcos Lopez de Prado, page 284. It's a spread estimator using high/low and a rolling window (configurable). It works with low liquidity markets as a robust estimator. It's interesting when you need to track spread changes, more information can be found at Marcos book.

In Kyle’s model, the variable captures price impact. Illiquidity increases with uncertainty about v and decreases with the amount of noise Kyle argues that the market maker must find an equilibrium between profit maximization and market efficiency. This indicator is based on Advances in Financial Machine Learning 2018 - Marcos Lopez de Prado book, Page 288.
Amihud studies the positive relationship between absolute returns and illiquidity. In particular, he computes the daily price response associated with one dollar of trading volume, and argues its value is a proxy of price impact. Despite its apparent simplicity, Hasbrouck [2009] found that daily Amihud’s lambda estimates exhibit a high rank correlation to intraday estimates of effective spread. This indicator is based on Advances in Financial Machine Learning 2018 - Marcos Lopez de Prado book,

Hasbrouck follows up on Kyle’s and Amihud’s ideas, and applies them to estimating the price impact coefficient based on trade-and-quote (TAQ) data. Consistent with most of the literature, Hasbrouck recommends 5-minute time-bars for sampling ticks. This indicator is based on Advances in Financial Machine Learning 2018 - Marcos Lopez de Prado book, Page 289. --- This code can run slow when using big timeframes, it use copytick to get dollar volume, in a next version I will implement a temporary i
Easley et al. [2011] proposed a high-frequency estimate of PIN, which they named volume-synchronized probability of informed trading (VPIN). This procedure adopts a volume clock, which synchronizes the data sampling with market activity. For additional details and case studies of VPIN, see Easley et al. [2013]. A number of studies have found that VPIN indeed has predictive power: Abad and Yague [2012], Bethel et al. [2012], Cheung et al. [2015], Kim et al. [2014], Song et al. [2014], Van Ness et
Easley et al. study the frequency of trades per trade size, and find that trades with round sizes are abnormally frequent. For example, the frequency rates quickly decay as a function of trade size, with the exception of round trade sizes {5, 10, 20, 25, 50, 100, 200,…}.
These authors attribute this phenomenon to socalled “mouse” or “GUI” traders, that is, human traders who send orders by clicking buttons on a GUI (Graphical User Interface).
In the case of the E-mini S&P 500, for example, si

A useful feature may be to determine the normal frequency of round-sized trades, and monitor deviations from that expected value. The ML algorithm could, for example, determine if a larger-than-usual proportion of round-sized trades is associated with trends, as human traders tend to bet with a fundamental view, belief, or conviction. Conversely, a lower-than-usual proportion of round-sized trades may increase the likelihood that prices will move sideways, as silicon traders do not typically hol

iVolX indicator horizontal volumes for all time periods
Main settings of the indicator: VolumeSource - select data for volumes (tick or real) PeriodMinutes - selection period for rendering of volumes PeriodsNumber - number of periods to show on the chart StartDate - the start date of the calculations ClusterPoints - cluster width Color - color MaxVolColor - maximum volume color ValueArea - the value of the zone of balance ValueAreaColor - color of the balance zone MaxVolFontSize - font size Ma

this indicator very simple and easy if you understand and agree with setup and rule basic teknical sba you can cek in link : please cek my youtube channel for detail chanel :
an for detail info contact me basicly setup buy (long) for this indicator is Magenta- blue and green candle or magenta - green and green candlestik and for setup sell (short) is Black - yellow - and red candle or black - red and red candlestik

This indicator was developed to support multiple timeframe analysis. In the indicator settings, the user can set the color, width, and style of the horizontal lines for each timeframe. This way, when the horizontal lines are inserted into the chart, they will be plotted with the timeframe settings.
MTF Lines also allows visibility control of another objets like rectangles, trend lines and texts.
This is a product developed by Renato Fiche Junior and available to all MetaTrader 4 and 5 users!
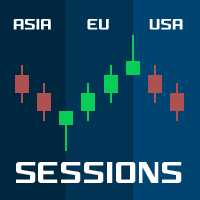
Sessions PRO is a perfect tool which divide your chart screen by 3 main market sessions: 1> asian 2> european (with division for Frankfurt and London start) 3> american
Sessions PRO is perfect especially for trading indices, where main pivot points often occurs along with new market center enters the market. With Sessions PRO you see what events happened at their exact corresponding time - European and American moves and pivot points are much more important than asian. Stop analyzing your
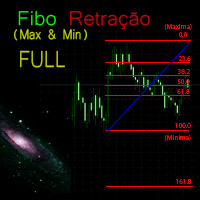
Functional in the Forex market. Functional in the B3 market - Bolsa Brasil Balcão.
Motivation The technical indicator of Fibonacci retraction for many is essential and the basis for all forecasts of market movements. The name of the tool comes from the Italian mathematician Leonardo de Pisa (13th century). This FULL version will work in Meta Trader 5 on any type of account.
This FULL version will work in Meta Trader 5 on any type of account.
To test on the DEMO account, download the free

In spite of a very simple indicator, it assists the trader who is eventually positioned several days in an operation if the asset swap is for or against its operation.
It is the ideal indicator for long-term operators.
The Swap is the rate that the operator pays for being positioned from one day to another or sometimes from week to week.
There are strategies that, besides a setup and risk management, also contemplate operating in favor of the Swap.
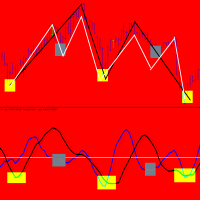
TimingCycleWithLLV is an excellent tool to determine the timing of your entry point! Everyone knows that cycles exist both in nature and in financial markets.Cycles are present in all time frames,from 1 minute to 1 year.Sometimes they are very clear to identify,others there is overlap between cycles of varyng duration. I can say this:the one-day cycle corresponds to the duration of a trading day( for example the one-day cycle for GERMAN DAX index is 14 hours as the trading day is 14 hours). Obvi

Indicador multi-nivel y multi-timeframe que permite seguir la tendencia del precio de cualquier par de divisas, metales, acciones, CFD's, etc. Intuitivo y fácil de aplicar sobre cualquier gráfico.
Parámetros: Timeframe : Marco de tiempo que se le aplicará al nivel Period : Periodo que se aplicará Applied Price : Precio a aplicar
Aplicaciones: Se puede usar aplicando diferentes niveles sobre el mismo gráfico, por ejemplo, in nivel de 8, 14, 20, etc.
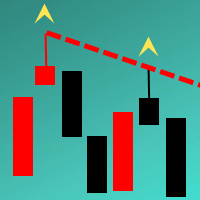
The Indicator automatically draws trend lines on the specified timeframe ( Trend lines period parameter). The lines are drawn based on the last two known fractals of the specified period. If you want the lines to be drawn only on the confirmed fractal, then set the Confirmed or unconfirmed fractal parameter to True . Indicator feature - lines are drawn with the accuracy of any timeframe. It allows analyzing the chart on smaller timeframes without loosing the precision of drawing the lines in re
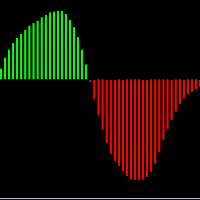
É um indicador oscilador baseado no "MACD" convencional porém com suavização . Através desse indicador você será capaz de operar sem os ruídos produzidos pelo indicador "MACD" convencional. Em quais ativos o indicador funciona: Em qualquer ativo do mercado, tanto em forex, como B3 ou binárias. Qual é o novo parâmetro: Smooth Period ou período de suavização, que representa o período que será suavizado no "MACD".

Индикатор показывает развороты рынка в виде стрелок. Разворотные сигналы основаны на моих личных наблюдениях за поведением рынка. В основу взяты такие принципы как поиск экстремумов, объемы и Price Action. Индикатор дает сигналы на следующих принципах: Поиск окончания тенденции на рост/снижение рынка Поиск модели разворота на основе Price Action Подтверждение разворота объемом контракта. Также в индикатор встроен сигнал при появлении стрелки. Индикатор не перерисовывается. Индикатор не перерисов
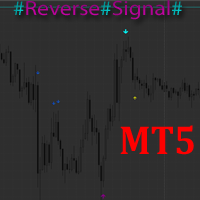
Версия индикатора MT4 - https://www.mql5.com/ru/market/product/16415 Индикатор обозначает предполагаемые развороты рынка в виде стрелок. В индикатор встроены 3 вида разворота. Основной сигнал на разворот. Это более сильный и важный разворот. Обозначается самой крупной стрелкой. Альтернативный сигнал - это дополнительный сигнал без использования дополнительных фильтров в отличие от основного. Подойдет для скальпирования на малых таймфреймах. Смесь основного разворота и альтернативного, но с доба

BeST_Trend Exploiter is a Metatrader Indicator based on a smart proprietary algorithm which can detect the market Median Trend while it filters out the noise providing Buy and Sell Signals and also wherever it is applicable it provides us with TP Levels of High Probability. Additionally as it has Built Inside all the necessary features it can be used as a Complete Strategy of very Impressive Results. Essential Advantages of the Indicator
Clear and Easily Understandable trading rules. Real

让我们看一下外汇市场价格变化的本质,而不是关注这些变化发生的原因。这种方法将使我们能够确定影响价格变动的主要因素。 例如,让我们看一下欧元兑美元货币对和H1时间框架的开盘价。对于这些价格,我们构建了Lameray图(图1)。 在该图中,可以看出价格变动基本上根据线性方程发生。要确定此等式的参数,可以使用最小二乘法。在这个特定的例子中,改变开盘价的等式采用以下形式: Open [i] = 0.99989 * Open [i + 1] +0.00013。 让我们来看看这个等式如何充分描述价格变动。为此,我们删除线性分量并分析残差(图2)。 从图中可以清楚地看出,这些残留物相当混乱,如果我们将它们视为噪声,我们可以得到一个相当简单的系统来预测下一个柱的开盘价,这是以该指标的形式实现的。

Технический индикатор "Reversal patterns" является математической интерпретацией классических разворотных паттернов: Pin Bar, Harami и Engulfing. То есть «Разворотного бара», «Харами» и «Поглощения». Данный индикатор позволяет определить момент разворота котировок на основе рыночной динамики и победителя между «быками» и «медведями». Индикатор отображает момент разворота на локальных максимумах и минимумах графика любого таймфрейма, что позволяет повысить точность сигнала. Также индикатор имеет

Niubility Trend Niubility Trend displays the trend direction for all time frames in real time.
You'll see at a glance at which direction the trends are running, how long they last and how powerful they are.
All this makes it an easy-to-use trend trading system for beginners, advanced and professional traders.
Features
Easy to trade Customizable colors and sizes It is non-repainting and non-backpainting It is fantastic as a trailing stop method It implements alerts of all kinds

该指标的独特之处在于交易量核算算法:在所选时段内直接进行累积,而无需参考当天的开始。可以从计算中排除最后的柱线,那么当前数据对之前形成的显着水平(交易量)的影响较小。 为了更精确的计算,默认使用 M1 图表中的数据。规范了价格量的分配步骤。默认情况下,显示的右边框设置为用于分析的数据开头对应的栏,但如果需要,可以设置为您需要的栏。显示的音量带的长度(右边界)由系数调节,也可以向左或向右移动到 0(当前)条或参照当前条进行镜像。 参数: Accumulation period - 累积量计算周期 Number of excluded last bars - 从计算中排除的最后一根柱线的数量 Accumulation price step - 按价格参数的成交量总和步骤 Graph length multiplier - 显示数据的长度比例 Use data from timeframe - 用于分析的图表(时间范围) Graph show shift - 开始显示数据的移位,如果留为0,则数据将从分析数据周期开始时间对应的条开始显示; “-1”——显示在左侧; “-2” - 显示

Niubility Scalping The Niubility Scalping indicator detects trend, give sell point and buy point. this indicator can use for scalping technique, and also use for trend technique.
Attention
Chart statistics will help you to optimize your trading, statistical accuracy to the hour.
It can works on every timeframe.
The indicator analyzes its own quality and performance.
Losing signals are highlighted and accounted.
The indicator is non-repainting.
It implements sound alerts.
Parame
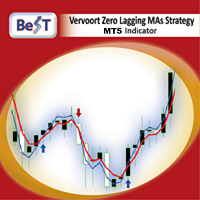
All those involved in trading do certainly know that Moving Average Crossovers for being tradable should be reliable and also they need to have minimal lag.
BeST_Vervoort Zero Lagging MAs Strategy is an outstanding indicator that can help you to achieve it and is based on S.Vervoort's work about Reliable and of Zero Lag MAs Crossovers as described in his TASC_05/2008 article " The Quest For Reliable Crossovers ". It's a Multipotentiality Indicator as it can display of either simply the Zero Lag

Niubility RSI and Fibo The RSI will send an alert when the RSI value of the price gets to the level specified in the settings.
The input of the indicator can allow for change of RSI period, overbought and oversold.
The RSI will work for multi timeframe.
The RSI will scan different pairs.
This Fibo is designed to draw a Fibonacci retracement, using as a basis the ZigZag indicator.
Description:
'up' word means up trend.
'down' word means down trend.
' -- ' word means no tre

Alert Stochastic plus delay and level Filter
A stochastic oscillator is a momentum indicator comparing a particular closing price of a security to a range of its prices over a certain period of time. We added many types of alerts plus the Level Cross Filter to aid in your search for better opportunities in the market. Product Features Sound alert Push Notification (Alerts can be sent to your mobile phone) Signs on chart Alert box Level Filter Delay Level Filter
Indicator Parameters K
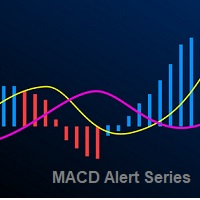
The Moving Average Convergence Divergence Indicator (MACD) is both a trend–seeking and momentum indicator which uses several exponential moving averages set to closing prices to generate trading signals. We added many types of alerts plus the Delay Cross Filter to aid in your search for better opportunities in the market.
Product Features Sound alert Push Notification (Alerts can be sent to your mobile phone) Signs on chart Alert box Alert on zero histogram cross or line sign cross. DelayCros

Description Very robust and powerful indicator, which allows through its 4 components, trade the market in trend or not trending conditions. it based on a very reliable trading strategy and gives you all you need to be succesful in trading. KEY LINKS: Indicator Manual – How to Install – Frequent Questions - All Products How is Clever Scalper Pro useful to you? A complete and reliable trading strategy. Easy to understand and trade Allow to identify trend, confirm it, look for retraceme
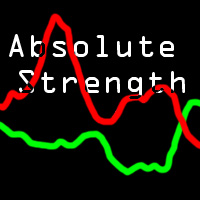
The Absolute Strength (AS) is intended to chart the current and historical gain or loss of an underlying based on the closing prices of a recent trading period. It is based on mathematical decorrelation. It shows absolute strength momentum.
This indicator is not measured on a scale like Relative Strength (RSI). Shorter or longer timeframes are used for alternately shorter or longer outlooks. Extreme high and low percentage values occur less frequently but indicate stronger momentum of the un

该指标更具信息量。他的工作基于这样的假设,即市场中的价格变动可以表示为特定颜色的噪声,这取决于价格值分布的参数。由此,可以从不同角度分析价格变化,并将价格变动视为特定颜色的噪声,可以获得有关市场当前状态的信息并对价格行为进行预测。 在分析指标读数时,会考虑指标线的位置 - 它们位于当前柱的开盘价的上方或下方以及距离它的距离。 白噪声(白噪声) - 这种方法的特点是价格(当前和史前)被认为功率相等,这与简单的移动平均值相结合。白噪声信号更有可能证实这一特征 - 它越偏离当前价格,市场中的趋势运动就越强烈。相反,如果白噪声线接近开盘价,那么这就是趋势结束或横向价格变动的证据。 闪烁噪声(闪烁噪声)概述了趋势的上边界或下边界(取决于线是否高于或低于价格)。此外,这种噪音线与货币对价格的交叉点可以作为新趋势开始的证据,甚至是短期趋势的开始。 布朗噪声在很多方面的行为类似于指数平滑。因此,噪声线跟随价格,只有市场突然和突然的变化才有可能出现大的偏差。 蓝噪声显示趋势对当前趋势的强烈程度。由于蓝色噪声线与当前价格存在较大偏差,我们可以说趋势已经耗尽其力量并接近完成。 紫色噪音表明周期性或周期性价

尽管“ AIS Color Noise Filter ”指示器存在一些缺点,但使用它来平滑价格序列和预测价格的想法看起来非常有吸引力。 这是由于以下几个原因: 首先,考虑到几个噪声成分,可以建立相互独立的因素预测,从而提高预测质量; 其次,价格序列的噪声特征在整个历史中表现得相当稳定,从而可以获得稳定的结果; 最后,噪声变化使我们希望预测系统非常敏感,并且它对价格变化的反应将非常快。 因此,我们得到一个指标,尽管有所有简化,但能够准确预测价格将会移动的渠道。该指标的主要优点是速度快,易于学习。主要缺点是指标无法选择最重要的预测因素。 LH 是一个参数,用于设置进行预测的历史数据的长度。其允许值为0 - 255,而指标处理的柱数超过此参数指定的单位数。

This is Gekko's Bollinger Bands indicator. It extends the use of the famous Bollinger Bands and calculates strong entry and exit signals using price action on the edge and on the middle bands. You can set it up in many different ways, eg: pullback, pullback against trend, middle band crossing and middle band crossing against trend. Inputs Number of Bars to Plot Indicator: number of historical bars to plot the indicator, keep it low for better performance; Produces Signal Only When a Bar Closes:

The Larry Wiliams' indicator named WillSpread considers the influence of the secondary Asset (Symbol) on the current Asset (trading). Indicator essence is to transform the correlation between assets in accumulated history data, providing an opportunity to detect various peculiarities and patterns in price dynamics which are invisible to the naked eye. Based on this information, traders can assume further price movement and adjust their strategy accordingly. As exposed on his Book, Larry says: "a
THRUST BAR ALERT!!!! THRUST BAR ALERT!!!
Now you dont have to worry about going through each currency pair, your favorite stocks watch list or crypto to find BIG CANDLES (also called THRUST BARS ). This indicator does everything for you.
This indicator has the capability to SCAN different CURRENCY PAIRS and TIMEFRAMES to give you BIG CANDLE (THRUST BAR) information through ALERT (MOBILE NOTIFICATION, EMAIL AND PUSH NOTIFICATION)
NOTE: If you are willing to scan more currency

很多时候,在金融系列的研究中应用他们的平滑。使用平滑,您可以删除高频成分 - 据信它们是由随机因素引起的,因此无关紧要。平滑总是包括一些平均数据的方法,其中时间序列中的随机变化相互吸收。大多数情况下,为此目的,使用简单或加权移动平均方法,以及指数平滑。 这些方法中的每一种都有其优点和缺点。因此,简单的移动平均值简单直观,但其应用需要时间序列的周期和趋势分量的相对稳定性。另外,信号延迟是移动平均值的特征。指数平滑方法没有滞后效应。但即使在这里也存在缺陷 - 只有在将系列与随机异常值对齐时,指数平滑才有效。 简单和指数平均值之间的合理折衷是使用加权移动平均线。但是,存在选择特定重量值的问题。让我们一起尝试解决这个问题。 因此,首先要定义我们希望从平滑过程中实现的目标: •首先,我们需要从价格序列中删除随机变化和噪音; •其次,我们希望识别异常排放和异常价格行为,这些行为也可用于贸易; •最后,平均程序应确定市场中存在的可持续趋势。 当然,我们希望平滑程序适应当前的市场情况。 为了获得理想的结果,我们将根据此价格水平与研究期间的最高和最低价格之间的差异来计算权重。通过这种方法,我们得到一个

为了隔离长期和非随机组件,不仅要知道价格变化了多少,还要知道这些变化是如何发生的。换句话说 - 我们不仅对价格水平的价值感兴趣,而且对这些水平相互替代的顺序感兴趣。通过这种方法,人们可以找到影响(或可能影响)特定时间点价格变化的长期和稳定因素。了解这些因素可以让您做出或多或少准确的预测。 让我们确定我们希望从财务系列的分析中得到什么具体结果: •首先,我们需要强调这一趋势,如果它存在于市场中; •其次,我们需要确定周期性成分; •第三,结果应足够稳定,可用于预测; •最后,我们的分析方法应该适应当前的市场形势。 为了满足指定的条件,我们使用相对价格变化的回归分析,并基于该模型做出指标。该指标的算法基于对历史数据的学习,其工作在交易者的完全控制之下。 LH 是一个参数,用于确定用于平滑金融系列的柱数。其允许值介于0到255之间。 UTS 是影响学习速度和深度的参数。它的值也在0到255之间。如果UTS的值为零,则在整个历史记录中进行学习。在所有其他情况下,训练集会不时更新。更新越频繁,UTS值越小。 该指标的主要缺点是,当平滑金融系列被认为是静止时,这可能会导致一些延迟。

Automatic MIDAS positioning, the indicator allows the placement of two MIDAS, each one have 3 lines that can be calculated using Open/High/Low/Close/Median/Typical or Weighted prices, you can attach each MIDAS to the Open/High/Low or Close bars of any day, including the current day, once attached, if the price of this bar changes or you change the time frame, the indicator will do the repositioning and recalculation. You can also do a manual repositioning of the two MIDAS by moving its start lab
学习如何在MetaTrader AppStore上购买EA交易,MetaTrader平台的应用程序商店。
MQL5.community支付系统支持通过PayPay、银行卡和热门付款系统进行交易。为更好的客户体验我们强烈建议您在购买前测试EA交易。
您错过了交易机会:
- 免费交易应用程序
- 8,000+信号可供复制
- 探索金融市场的经济新闻
注册
登录