适用于MetaTrader 5的技术指标 - 20
利用 MetaTrader 5 的终极仪表板指标 XDashboard MT5 充分发挥您的交易指标的潜力。 XDashboard MT5 专为追求精准和效率的交易者而设计,可提供跨多个符号和时间范围的任何指标的无与伦比的视图, 全部通过单一、可定制的界面进行。 ** 此价格为限时优惠 ** 特征: 自定义指标集成
全面的多符号监控 多时间框架分析 用户友好界面 实时更新 灵活的警报系统 性能优化
XDashboard MT5 不仅仅是一个指标;它是一个可提高您的交易效率和效力的强大工具。
通过提供市场的整体视图,它使您能够自信地做出明智的决策。
无论您是初学者还是经验丰富的专业人士, 指标仪表板(XDashboard MT5)都能适应您的需求并提升您的交易体验。

This Price indicator aid you to read prices of a bar without using native MT5 instuments like crosshair.
The indicator gives you the OPEN HIGH LOW CLOSE and 50% bar prices of the current or one of the previous bar.
Parameter setting are: TimeShift: Used for bar selection (0 stand for current 1 for previous 2 for 2 bars ago) Other parameter are using for esthetics. Each Label can be moved away from its initial position.
FEEL FREE TO REPORT BUG AND REVIEW THIS INDICATOR. THANKS
FREE

This indicator displays MTF (Multi-Time Frame) Candles on your Chart. It helps to see the overall Trend of Market.. It also help to MTF Analysis in fast way because you dont need look in many Time-Frames.. You get 4TF Bars/Candles on your current chart.. It can help you to identify trend or Reversal early as you get overall picture at one place...
Customizable Settings are : 1. Where to place MTF Candles.. 2. Show or Hide for each Candle 2. Time-Frame for each Candle
FREE

Donchian通道(唐奇安通道指标)是用于交易突破的最古老、最简单的技术指标之一。 一般来说,唐奇安通道的宽度越宽,市场波动就越大,而唐奇安通道越窄,市场波动性也就越小 。此外,价格走势可以穿过布林带,但你看不到唐奇安通道的这种特征,因为其波段正在测量特定时期的最高价和最低价。 交易实用必备工具指标 波浪自动计算指标,通道趋势交易 完美的趋势-波浪自动计算通道计算 , MT4版本 完美的趋势-波浪自动计算通道计算 , MT5版本 本地跟单复制交易 Easy And Fast Copy , MT4版本 Easy And Fast Copy , MT5版本 本地跟单复制交易 模拟试用 Easy And Fast Copy , MT4 模拟账号运行 Easy And Fast Copy , MT5 模拟账号运行 唐奇安通道指标计算: 唐奇安上阻力线 - 由过去N天的当日最高价的最大值形成。 唐奇安下支撑线 - 由过去N天的当日最低价的最小值形成。 中心线 - (上线 + 下线)/ 2 唐奇安通道信号 唐奇安通道常用作突破指标。它提供了两种主要类型的突破信号,一个是上阻力线或下支
FREE

The Mono Waves indicator is designed to display the wave behavior of the market on a chart. Its appearance is presented on slide 1. This indicator uses the PPPC (Point-Percent Price Channel) indicator, which can be downloaded for free from the Market . When the market moves up, the upper border of the price channel is built on High candlestick prices (for more details, see the description of the PPPC indicator at the link given above). The higher the High prices rise
FREE

Trading Signal for MetaTrader5 PC platform
The Signal is based on the Investologic EA trend strategy . Trend following indicator’s and oscillator’s, can work with any symbol or market in MT5 platform FOREX, GOLD, OIL, STOCKS, INDEXES, NASDAQ SPX500 The strategy
the strategy uses multi time frame combination of indicators and moving averages to find the best entry point wen the fast MA slow MA Crossover And Stochastic , RSI , Average Directional Movement Index ,combined together
FREE

The M Extensions are variations of the Golden Ratio (Fibonacci Sequence). It is the World's first technique developed for Candle Projections.
Advantages:
Easy to plot. Candle anchoring; High and accurate precision as support and resistance; Excellent Risk x Return ratio; Works in any timeframe; Works in any asset / market. The M Extensions are classified into:
M0: Zero point (starting candle) RC: Initial candle control region M1: Extension region 1 M2: Extension region 2 M3: Extension r
FREE

The Advanced Pivot Point Indicator is a powerful tool designed to help traders identify key support and resistance levels in the market. This versatile indicator offers a customizable and user-friendly interface, allowing traders to select from five different pivot point calculation methods: Floor, Woodie, Camarilla, Tom DeMark, and Fibonacci. With its easy-to-read lines for pivot points (PP), support (S1, S2, S3, S4), and resistance (R1, R2, R3, R4) levels, the Advanced Pivot Point Indicator pr
FREE

Bollinger Bands % or Bollinger Bands Percentage is one of the indicators used in the Sapphire Strat Maker - EA Builder .
It is calculated using the following formula:
Perc = (CLOSE_PRICE - LOWER_BOLLINGER) / (UPPER_BOLLINGER - LOWER_BOLLINGER) * 100
Thus, by taking the difference between closing price to the lower band and dividing it by the difference of the upper and the lower price levels of a Bollinger Bands indicator, we can calculate this indicator.
It shows how far the price is f
FREE

基于CCI的顺势原理,改良使其成为即可辨别趋势的反转与其发展的方向,即在趋势行情当中来识别震荡走势的顶底衰减的指标。
特征 红色、绿色立柱体部分为当前周期下的趋势多头发展或空头发展。 蓝色线条为当前周期下的当前价格走势的位置和衰减情况。 红色线段的上下轨为价格走势极值趋势,蓝色线条达到价格红色线段上方为极值超买衰减区域,蓝色线条达到价格达到红色线段下方为极值超卖衰减区域。 黄色实线的上下轨为价格走势持续方向,蓝色线条高于黄色实线为持续多头发展,下破完结。蓝色线条低于黄色实线为持续空头发展,上破完结。 右侧看板,给出的是当前走位数字提醒,同时给出了当前趋势是涨、是跌的提醒,以及给出了可入场的区域提醒。 使用 作趋势交易者建议在1H周期下使用 ; 作快进快出震荡交易者建议在5M周期下使用 ;
FREE

El indicador técnico propuesto es un sistema de medias móviles de múltiples marcos temporales diseñado para ayudar a los operadores del mercado financiero a seguir de cerca los movimientos tendenciales. Al combinar medias móviles de diferentes períodos, este indicador ofrece una visión más completa de la dirección de la tendencia, lo que permite a los traders identificar oportunidades de trading con mayor precisión. Al utilizar este indicador, los operadores pueden maximizar sus ganancias al tom
FREE

This indicator shows ratios between extremes on the chart. You can specify your own ratios (e.g. Fibonacci).
Parameters Most important Density - how much in details to search ratios in extremes. Bigger number means less details, smaller number means more details. Base unit is 1 bar on the chart. History - how far to go in history while searching. When you set -1, the indicator processes all bars from history. Base unit is 1 bar on the chart. Range - how far search ratios from given extreme. Ba
FREE

This indicator is based on the Fractals indicator. It helps the user identifying whether to buy or sell. It comes with an alert that will sound whenever a new signal appears. It also features an email facility. Your email address and SMTP Server settings should be specified in the settings window of the "Mailbox" tab in your MetaTrader 5. Blue arrow up = Buy. Red arrow down = Sell. Line = Trailing Stop. You can use one of my Trailing Stop products that automatically move the Stop Loss and includ
FREE

下午好。. 我们为交易者和市场分析师准备了一个新产品。 我们的volumespreadtompson指标旨在查看机构市场参与者对当前价格的影响。 该指标显示每单位时间点差的变化水平,当其值较高时。 实践表明,交易量的变化与投机活动的警告和提前有关, 特别是在关键时刻:美联储新闻,石油新闻,国家领导人的演讲等。 Practice shows that the change in volumes is associated with the warning and advance of speculative activity, especially at key moments: Fed news, oil news, speeches by leaders of the IDR countries. We are very happy to present new developments. Thanks.
FREE

多货币和多时间范围指标 Inside Bar (IB)。 在参数中,您可以指定任何所需的货币和时间范围。 该面板显示最后找到的内部柱线(和母柱线)形态、当前价格位置以及母线和内部柱线水平的突破。 您可以设置单元格中的条形和文本的大小和颜色。 当水平被突破时,该指标还可以发送通知。 通过单击带有句点的单元格,将打开指定的交易品种和句点。 这是 MTF 扫描仪。
默认情况下,从图表中隐藏仪表板的键是“D”。
参数 How long pattern will be valid after first breakout (bars) — 信号将在单元格中显示多少柱。 IB body must be inside of the MB body - IB 主体必须位于 MB 主体内部。 IB body and wicks must be inside the MB body - IB 主体和灯芯必须位于 MB 主体内。 If MB is IB, choose the next MB — 如果找到的母柱是前一个信号的内柱,则将显示前一个信号。 MB body must be larg

Spread Pulse MT5 指标是一种有效的工具,可为交易者提供有关图表上当前点差的信息。 点差是一种工具的买入价和卖出价之间的差额。
该指标以图表上显示的文本形式呈现。 这使得交易者可以轻松跟踪当前的点差。
Spread Pulse 指标的主要优点之一是其颜色可视化。 根据跨页大小,文本颜色会发生变化。 默认情况下,当点差较小时,文本将为绿色,这意味着点差较低,交易可能会更有利可图。 然而,当点差变高时,指示文字会自动变为红色。
此外,用户还可以自定义与高差和低差相关的颜色。 您还可以更改字体大小以使信息更易于阅读。
Spread Pulse 指标对于任何交易者来说都是理想的选择,无论经验水平和交易策略如何。 它可以快速、轻松地访问有关当前点差的信息,帮助交易者做出明智的决策并改善交易结果。
如果您发现该指标有用,请留下评论。 您的意见对我们非常重要,将帮助我们使指标变得更好。
选项 Spread size - 确定文本颜色的展开大小。 如果跨度大于跨度大小值,则文本为红色(默认情况下)。 当价差较高时,颜色为绿色。 High spread
CandleCloseCountdown is technically an indicator. Its purpose is to show the time a candle has left on a given timeframe before it closes. All possible time frames of MetaTrader 4 are supported. The way the remaining time is displayed depends on the selected timeframe. For M1 only the seconds are displayed. Above that at all timeframes up to H1 the remaining minutes and seconds are displayed and so on for timeframes above D1.
FREE

Vegas Tunnel, with up to 20 levels, allowing you to plot or not each level with color change, line thickness and ON/OFF visualization for easy use 100% free and lifetime Recommended use for time frames: Original --> H1 Fractals --> M15, M30, H4, D1 and W1 When the black dots are above the tunnel, start short positions. When the black dots are below the tunnel, start long positions. It's important to remember that just because the market breaks the line of lying doesn't mean it's time to enter a
FREE

Este indicador imprime 2 médias com distância de 1 ATR (Average True Range) da média principal. As demais médias móveis só são mostradas se estiverem fora desse intervalo. Parâmetros: mediaprincipal = Média que será criado o intervalo, não será mostrada. mediasec1, mediasec2, mediasec3 = médias secundárias. periodatr: periodos do ATR Este indicador faz parte do Trade System MarketStrengthRadar
FREE

The Keltner Channel is a volatility-based technical indicator composed of three separate lines. The middle line is an exponential moving average (EMA) of the price. Additional lines are placed above and below the EMA. The upper band is typically set two times the Average True Range (ATR) above the EMA, and the lower band is typically set two times the ATR below the EMA. The bands expand and contract as volatility (measured by ATR) expands and contracts. Since most price action will be encompasse
FREE

FREE
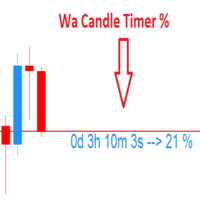
Wa Candle Timer Percentage MT5 is an indicator which shows the user how much time is remaining until the next candle will form. The percentage of the evolution of the current candle is also displayed. The user can set the percentage that the candle timer will change the color. These are the settings: 1- The percentage that the candle timer will change the color. 2- Color of Candle Timer when it's BELOW the percentage set by the user. 3- Color of Candle Timer when it's ABOVE the percentage set b
FREE

This indicator draws a vertical line repeatedly at the set time. The number of lines that can be set can be set arbitrarily. In addition, it is possible to set 4 types of lines. It is possible to change different times, colors, line types, etc. The time can be set to any time in minutes.
In the next version, we plan to display the high and low prices within the setting range.
FREE

The Trail Stops Point indicator shows the deviation from the current price by a certain distance. It has been developed as an additional indicator for Trail Stops by Custom Indicator , to provide a simple trailing of a position stop loss at a specified distance in points.
Indicator Parameters Distance - trailing stop distance in points. Buffer numbers: 0 - Support, 1 - Resistance.
FREE

Non-lagging VOLATILITY indicator A radical modification of the ATR indicator, which corrected all of its shortcomings (the picture shows the difference with ATR). The indicator shows the swing size of the current market movement. Features: does not have a time window period, i.e. any subjective settings non-delayed, the extremums of the indicator always coincide with the extremum of the price (note the picture) is normalized by means of a color solution, i.e. it has the properties of an oscillat

Boom Scalper Gold It is an indicator, programmed to scalp in a timeframe of 1/5 and 15 Minutes, perfect for hunting spikes and trend sails, where in the parameters of (70) it sends you a sale/sell alert and in the level parameter (8) it sends you a buy signal It is used for indices (BOOM) of synthetic indices (Deriv) It's easy and simple to use, it does all the work by sending you the alerts! the indicator during this period will remain on SALE! Without further ado, enjoy! Good profit. World Inv
Crash Scalper Gold It is an indicator, where it marks points of purchase and points of sale As the name says, it is used to scalp in the pairs of (Crash) 1000/500/300 where it sends you signals of sale/Sell and purchase/Buy at level points (90) he sends you the sell signal, (Spike) at the level point (27) it sends you the buy signal, (Trend Candles) It is very simple and easy to use. to make the best tickets possible! For this period it will remain on sale! Without further ado, enjoy! Good profi

"AV Monitor MT5" is an indicator for MetaTrader 5, which alowes a history analysis of the closed orders. It helps to achieve a quick visual analysis of your own trading or different expert advisors among themselves. Compare and analyze your expert advisors: Which one is the best?
I use an "AV Monitor MT5" indicator per running expert advisor chart to track its performance split into long & short, as well as an index chart e.g. DOW with this indicator and the setting "Show Balance & Equity" to

Supply or demand zones refer to price areas where a significant amount of supply or demand had previously entered the market, causing prices to either fall or rise. If the price returns to the demand or supply zone, it is likely to bounce off due to the large number of orders previously placed within the zone. These orders will be defended in these areas.
The Fair Value Gap (FVG) is a concept used to identify imbalances in the equilibrium of buying and selling. Fair Value Gaps are formed in a
This is one of the most powerful indicators I've ever made.
I was tired of looking at other windows/websites for economical news, and regularly something would happen without me realising.
So I made this indicator which displays all news at the exact time of arrival, directly on the charts!
Now you too can just focus on the charts and know that you won't miss any news events.
There are options:
1. You can choose to display on the price line, or at the bottom of the chart. 2. You can

this is an indicator to clarify seeing Low and High in the market and is very useful for facilitating those who are studying technical price action
this is a type of indicator that gives color to the candlestick where the indicator is divided into 3 colors red = bearish green = Bullish
Gray = base
this indicator can be used on the forex market or the mt5 binary market. https://t.me/SBA_FOREX_SIGNAL

Description :
VWAP (Volume-Weighted Average Price) is the ratio of the value traded to total volume traded over a particular time horizon. It is a measure of the average price at which pair is traded over the trading horizon. Read More.
All Symbols and All Timeframes are supported.
Indicator Inputs :
VWAP Mode : Mode of VWAP Calculation. Options can be selected : Single,Session,Daily,Weekly,Monthly
Volumes : Real Volumes,Tick Volumes
Price Type : Used price for cal

ATR Scanner Pro is a multi symbol multi timeframe volatility scanner that monitors and analyzes Average True Range indicator value in up to 28 symbols and 9 timeframes in 3 modes : ATR value: As a volatility dashboard it shows the ATR indicator value in all pairs and timeframes and signals when the ATR value reaches a maximum or minimum in a given duration. Short term ATR/Long term ATR ratio: It shows ratio of 2 ATRs with different periods. It's useful in detecting short term volatility and

The Wave Splash technical indicator measures the deviation of the price of an instrument from the average values over a specified period of time. It forms divergence patterns with the price chart and generates leading signals that make it possible to timely detect signs of an upcoming correction in the price of an instrument or a reversal with a trend change even at the moment the price updates extreme values. The Wave Splash indicator is effective in an active market.
Settings:
S
FREE

Forex Indicator Arrows is an arrow Indicator used as an assistant tool for your trading strategy. The indicator analyzes the standard deviation of bar close for a given period and generates a buy or sell signals if the deviation increases. It good to combo with Martingale EA to follow Trend and Sellect Buy Only/Sell Only for EA work Semi-Automatic. You can use this Indicator with any EAs in my Products.
FREE

Recommended broker to use the indicator: https://tinyurl.com/5ftaha7c Indicator developed by Diogo Sawitzki Cansi to show possible trade points. Do not repaint. The results displayed in the past are exactly what happened. We also use it to hold trades longer and not get out on false reversal signals which are actually just a profit taking of trades and no one is trying to reverse the direction of the trend. Indicator Parameters: PERIOD: Period for analyzing the buying or selling force to fin
FREE

The Market Thermometer can be used to help traders identify sleepy or turbulent periods.
It helps beginners to check when is the ideal time to enter operations, that is, when the value of the thermometer is below its average for several periods, identifying a peaceful market. When the market is heated, that is, the thermometer is above three times its average, it is time to make profits. The Thermometer measures the extent to which the end of a period, maximum or minimum price, projects outsi
FREE

New Candle Alert is a simple indicator that notify you when a new candle is formed. Func tions : Alert type - option to choose between message with sound or only sound. Message - alert message. Push notifications - enable push notifications. Show timeframe - show the symbol timeframe. Show hour - show the alarm time. Test message - if you don't want to wait a new candle formed to see the message. MT4 version: https://www.mql5.com/pt/market/product/37988 Hope you enjoy it. Any doubt or su
FREE
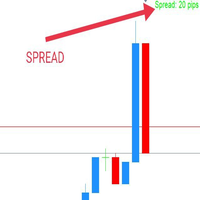
WaSpread MT5 Indicator shows the current spread in pips with color.
* Set the Spread Threshold and the color to identify when the current spread is below or above the Spread Threshold.
* Set X axis and Y axis and chose the Corner and the Anchor to position the Spread Label on the chart.
* Write the font and the font size for more confort.
* Activate alert if the current spread is above the spread threshold.
* For more precision, the user can choose to show the decimal numbers.
* The
FREE

This indicator measures volatility in a multi-timeframe fashion aiming at identifying flat markets, volatility spikes and price movement cycles in the market. [ Installation Guide | Update Guide | Troubleshooting | FAQ | All Products ]
Trade when volatility is on your side Identify short-term volatility and price spikes Find volatility cycles at a glance The indicator is non-repainting The ingredients of the indicator are the following... The green histogram is the current bar volatility The
FREE

This indicator's formula is quoted from that [NEW MARKET TIMING TECHNIQUES] by Thomas R. DeMark It consists of setup phase & countdown phase. But not Intersection & TDST. Countdown starts from the first of setup bar. It shows setup count number under the price & countdown number above the price on charts. SETUP: For buy first of setup bar; Close(4 bars ago)> Close(current)&Close(4 bars ago)< Close(previous bar). For sell first of setup bar follows opposite process. From the second bar; Close(4 b
FREE

The "VSA on the FLY" indicator is designed to quickly display various Volume Profile / Market Profile parameters.. The indicator takes the initial data for operation from the M1 timeframe. The indicator is installed on any timeframe and starts displaying data starting from the selected left border. This can be the beginning of a day, a week, a trading session, any hour, etc.
The version of this indicator for MetaTrader 4 can be found here .
The following input parameters are available: Show

Displays a USD DXY chart in a seperate window below the main chart. YOUR BROKER MUST HAVE THESE SYMBOLS FOR THE INDICATOR TO WORK Based on EUR/USD, USD/JPY, GBP/USD, USD/CAD, USD/CHF and USD/SEK All these pairs must be added to Market Watch for the indicator to work correctly As this is calculated using a formula based on the 6 pairs it will only work when the market is open.
YOUR BROKER MUST HAVE THESE SYMBOLS FOR THE INDICATOR TO WORK
Displays a USD DXY chart in a seperate window below the
FREE

Candle cross MA is an indicator that works "silently", that is, drawing only a moving average on the chart.
It alerts you when the last candle cross with a moving average that you set. Alert is given only when the candle closes.
The moving average settings are fully customizable.
The indicator sends popup, and push notifications. You can also deactivate alerts when the chart is inactive. Are you the trend type? Do not miss another opportunity!
FREE

This indicator displays the remaining time of the current candle, providing a visual representation of the time left until the candle closes and a new one begins, helping traders to make more informed decisions and stay on top of market fluctuations with precise timing, enhancing their overall trading experience and strategy execution, and allowing them to optimize their trades and maximize their profits.
FREE

StartPoint是一个很好的短线交易指示器,这个指标可以单独使用,但是最好是配合 HighQualityMap 一起使用,适用于任何时间框架,喜欢超短线的朋友可以使用M5时间框架。它能很好的体现出短期趋势的启动点,你可以很快的从这个指示器上寻找到最佳的buy和sell位置,同时也能很好根据指示器去坚守自己的持仓定订单。指标不含有未来函数,不会重新绘制,不仅能够应用到自己的手动交易过程中,还能完全可以写入到自己的EA中。(如果你感觉到这个指标能够帮助你进行更准确的交易,请帮忙给个好评,希望我的作品能够帮助更多有需要的人) ===================参数列表===================== 所有参数均采用默认参数即可,无需更改,若为激进型交易者,可以根据自己的需要来调整参数。 =================参考使用方法=================== 此指标可以适用于任何交易品种。

MOST is applied on this RSI moving average with an extra default option added VAR/VIDYA (Variable Index Dynamic Moving Average)
MOST added on RSI has a Moving Average of RSI and a trailing percent stop level of the Moving Average that can be adjusted by changing the length of the MA and %percent of the stop level.
BUY SIGNAL when the Moving Average Line crosses above the MOST Line
LONG CONDITION when the Moving Average is above the MOST
SELL SIGNAL when Moving Average Line crosses belo

This indicator is an extended implementation of Weis waves. It builds Weis waves on absolute volumes (which is the classical approach) or delta of volumes (unique feature) using different methods of wave formation and visualization. It works with real volumes, if available, or with tick volumes otherwise, but also provides an option to use so called "true volume surrogates", as an artificial substitution for missing real volumes (for example, for Forex symbols), which was introduced in correspo

MT4 Version Understanding market sentiment is a critical aspect of successful trading. Market sentiment refers to the overall feeling or attitude of traders and investors towards a particular financial instrument, such as a stock, currency pair, or cryptocurrency. It is a collective perception of market participants' emotions and beliefs about the asset's future price direction. Market sentiment can be bullish (positive), bearish (negative), or neutral (sideways). Knowing the market sentiment ca

This indicator is created by using an exclusive algorithm to indicate you Buy or Sell in an accurate way all the possibles reversals within a normalized trending bands. The main goal for this algorithm is to achieve fast profitable movements and aggressive retracement. Thanks to the normalized bands, using the noises of the market. We have added the "Golden Trade", we define it as the perfect order: For those orders that had the perfect entry price. They were always in profit, or the final pr

I present the well-known Moving Average indicator connected to the ATR indicator.
This indicator is presented as a channel, where the upper and lower lines are equidistant from the main line by the value of the ATR indicator.
The indicator is easy to use. The basic settings of the moving average have been saved, plus the settings for the ATR have been added.
Moving Average Parameters:
MA period Shift MA Method
Moving Average Parameters:
ATR TF - from which timeframe the values are t
FREE

Esse Indicador é uma boa opção para quem gosta de operar a longo prazo e com paciência. Ele trabalho com os níveis de fibo na media de 200 são 9 níveis onde você pode operar nas reversões o mercado partir do níveis abaixo. Level 1 = 550 pontos Level 2 = 890 pontos Level 3 = 1440 pontos Level 4 = 2330 pontos Level 5 = 3770 pontos Level 7 = 9870 pontos Level 8 = 15970 pontos Level 9 = 25840 pontos Level 6 = 6100 pontos
FREE

FRB Agression Opposite Candle
This indicator shows when the candle has opposite direction to the aggression balance of the same period. Not intended to be used in the Forex market. Only use markets that have volume and aggression information, such as B3 (Brazil)
Settings Color - Define the color that will be shown for the candle ( Color 1 - When the candle is positive and the balance of aggression is negative / Color 2 - When the candle is negative and the balance of aggression is positive )
FREE

加速点是一个强大的工具,用于检测价格运动的临界点,基于计算价格波动的加速度的想法。
_________________________________
如何使用指标信号:
指标在新的价格条出现后产生信号。 建议在价格突破指定方向的临界点后使用生成的信号。 指标不重绘其信号。
_________________________________
指标参数建议更改信号箭头的显示样式。 不提供更改用于计算的参数-这是由于我的产品的哲学:稳定性和客观性。
_________________________________
欢迎您的任何问题和建议,可以私信发送
_________________________________
提前感谢所有有兴趣的人,祝你好运征服市场!
FREE

The "Deviation Scaled Moving Average Crosses" indicator is a powerful technical analysis tool designed for the MetaTrader 5 trading platform. It facilitates informed trading decisions by visually presenting the interaction between two moving averages, both of which are smoothed and scaled to offer enhanced insights into market trends. This custom indicator is developed by mladen and is copyright-protected for the year 2023.
Using a unique approach, the indicator displays two types of deviatio
FREE

This particular moving average adjusts to the average number of highest highs and lowest lows recorded over a defined period, thereby accommodating changes in trend strength. Utilizing this moving average in a crossover system or as dynamic support/resistance can yield compelling outcomes. Configuration: Length: Determines the indicator's period, with larger values delivering smoother outcomes. Application: The Dynamic Trend Adaptive Moving Average functions akin to conventional moving averages,
FREE

金融指标 SolarTrade Suite:水星市场指标 - 您在金融市场世界中的可靠指南!
这是一种移动平均线,使用特殊的创新和先进算法来计算其值,并且具有令人赏心悦目的设计。
理解此指标的读数非常简单:蓝色 - 买入,红色 - 卖出。
颜色越亮,信号越强。
在说明底部查看我们的其他 SolarTrade Suite 产品。
您想自信地驾驭投资和金融市场的世界吗? SolarTrade Suite 金融指标:水星市场指标是一款创新软件,旨在帮助您做出明智的投资决策并增加利润。
SolarTrade Suite 金融指标:水星市场指标的优势:
- 准确预测:我们的指标使用先进的算法和分析方法来准确预测市场走势。
获取有关买卖资产最佳时机的信号。
- 用户友好界面:直观的界面将使您能够轻松掌握该程序并在安装后立即开始享受其好处。 您可以从设置中更改线条的颜色、粗细和样式,所有其他设置均自动完成。 - 专家支持:我们的专业团队随时准备为您解答任何问题,并为您提供有关使用该程序的建议。
为什么选择 SolarTrade Suite 财务指标:水星市场

Triple Exponential Moving Average (TRIX) It is a strong technical analysis tool. It can help investors determine price momentum and identify oversold and overbought signals in a financial asset.
Advantages of having an indicator like TRIX.
One of the main advantages of TRIX over other trend-following indicators is its excellent filtering of market noise and its tendency to be an early rather than late indicator.
To aid in the operations, a coloring was configured to facilitate the identif
FREE

The indicator displays trend slowdown or possible end of trend and price reversal. The indicator has no parameters. When red bars appear and when they become shorter, we can talk about the approaching end of the downtrend. When green bars become shorter, we can expect the approaching end of the uptrend.
FREE

The idea behind this indicator is to find all currency pairs that are over-bought or over-sold according to the RSI indicator at one go.
The RSI uses the default period of 14 (this can be changed in the settings) and scans all symbols to find the RSI level you will have specified. Once currency pairs that meet the specification are found, the indicator will open those charts for you incase those charts aren't open and proceed to write the full list of currencies on the experts tab.
FREE

如果产品有任何问题或者您需要在此产品上添加功能,请联系我 Contact/message me if you encounter any issue using the product or need extra feature to add on the base version.
PA Touching Alert is a tool to free you from watching price to touch certain critical price levels all day alone. With this tool, you can set two price levels: upper price and lower price, which should be greater than/less than the current price respectively. Then once price touches the upper price or lower price, alert and/or notification would be sent
FREE

This indicator calculates trend via two different moving averages and draw zigzag trend lines. You can change fast and slow Moving Averages settings for customization. Inputs:
Fast MA Time Period : 64 Fast MA Shift: 0 Fast MA Method: Smoothed Fast MA Apply To: Median Price Slow MA Time Period: 32 Slow MA Shift: 0 Slow MA Method: Smoothed Slow MA Apply To: Median Price ZigZag Color: Red ZigZag Type: DashDot ZigZag Width: VeryThin
FREE

This creates a mean-reversion chart using a moving average as a reference, detaching ourselves from the changing value of fiat currencies. [ Installation Guide | Update Guide | Troubleshooting | FAQ | All Products ] Get a mean-based view of the market Find real overbought/oversold situations easily Isolate your perception from the changing value of fiat currencies The center line represents the moving average Your imagination is the limit with this indicator Customizable chart period and Bolling
FREE

The Fibonacci indicator automatically displays the Fibonacci retracement levels, representing significant support and resistance. The range for calculating the indicator can be taken from the previous day, week, month, year or user-specified session.
Levels 100 % (High) of the range from the previous session. 0 % (Low) of the range from the previous session. 76,4 % of the range from the previous session. 61,8 % of the range from the previous session. 50 % of the range from the previo
FREE

Time to Trade Trading timing indicator is based on market volatility through 2 ATR indicators to determine the timing of a transaction. The indicator determines the times when the market has strong volatility in trend. When histogram is greater than 0 (blue) is a strong market, when histogram is less than 0 (yellow) is a weak market. Should only trade within histograms greater than 0. Based on the histogram chart, the first histogram value is greater than 0 and the second histogram appears, this
FREE

this indicator has the finality of show in graph the size of candle in formation to show the force of market in some moments of the day. This indicator is free and based on example disponible on the comunity. I'm disponibilizing here to anyone who don't know about programing. Please enjoy this indicator and leave a coment or a rate to help this indicator to other people who needs.
FREE

商品通道指数 (CCI) 指标的多货币和多时间框架修改。 您可以在参数中指定任何所需的货币和时间范围。 此外,该面板还可以在跨越超买和超卖水平时发送通知。 通过单击带有句点的单元格,将打开该符号和句点。 这是 MTF 扫描仪。
默认情况下,从图表中隐藏仪表板的键是“D”。
参数 CCI Period — 平均周期。 CCI Applied price — 价格类型。 Clear the chart at startup — 启动时清除图表。 Set of Pairs — 符号集 — Market Watch — 来自“市场观察”的货币对; — Specified manually — 在参数“Pairs”中手动指定对。 — Current pair — 当前对。 Pairs (separated by a space or semicolon) — 由空格或分号分隔的符号列表。 货币名称的书写方式应与经纪商的名称完全相同,并保留大小写和前缀/后缀。 Time Frames (separated by a space or semicolon) — 由空格或分号分隔的时

Highly configurable Momentum indicator.
Features: Highly customizable alert functions (at levels, crosses, direction changes via email, push, sound, popup) Multi timeframe ability Color customization (at levels, crosses, direction changes) Linear interpolation and histogram mode options Works on strategy tester in multi timeframe mode (at weekend without ticks also) Adjustable Levels Parameters:
Momentum Timeframe: You can set the lower/higher timeframes for Momentum. Momentum Bar Shift:
FREE

This indicator solves the problem of chart scaling where the bar becomes too thin and it becomes difficult to determine the bar's open and close prices.
Thick Bar indicator - allows you to change the thickness of the lines and the color of the stroke, due to which you can get a thicker bar on the chart. The default indicator has a bar thickness of 2 and preset colors that can be changed in the settings
FREE

This indicator displays the wave structure of the market in the form several wave levels nested in each other. For each of these levels an automatic preliminary (draft) marking of waves in Elliott's style (123..., ABC... etc.) is created. This markup is completely automatic and absolutely univocal. The indicator is especially useful for beginner wave analysts, because among all the possible versions for wave marking, it allows you to immediately take the most adequate version as a ba
MetaTrader 市场 - 在您的交易程序端可以直接使用为交易者提供的自动交易和技术指标。
MQL5.community 支付系统 提供给MQL5.com 网站所有已注册用户用于MetaTrade服务方面的事务。您可以使用WebMoney,PayPal 或银行卡进行存取款。
您错过了交易机会:
- 免费交易应用程序
- 8,000+信号可供复制
- 探索金融市场的经济新闻
注册
登录