适用于MetaTrader 5的免费技术指标 - 5

Introduction This indicator detects volume spread patterns for buy and sell opportunity. The patterns include demand and supply patterns. You might use each pattern for trading. However, these patterns are best used to detect the demand zone (=accumulation area) and supply zone (=distribution area). Demand pattern indicates generally potential buying opportunity. Supply pattern indicates generally potential selling opportunity. These are the underlying patterns rather than direct price action. T
FREE
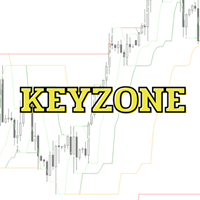
Keyzone 是一款专为 识别支撑和阻力水平 而设计的指标,共分为**四个关键级别:**3、8、21 和 89。这些级别是基于对 Smart Money Concept (SMC) 智慧资金概念 的高级优化,使其在保持简单性的同时,具备极高的交易效率。 凭借 简洁而强大的特性 ,Keyzone 可广泛适用于各种交易风格,包括:
剥头皮交易(Scalping) – 适合快节奏高频交易 波段交易(Swing Trading) – 捕捉中期价格波动 趋势跟随(Trend Following) – 把握长期市场趋势 仅需 四条关键线 ,交易者即可高效分析市场, 无需复杂的 SMC 概念 。即使是新手交易者,也能 快速掌握并灵活运用 Keyzone 进行交易!!!!!!!
如何使用 Keyzone 指标 震荡市场(区间交易) 在震荡市场中,Keyzone 水平充当 支撑和阻力区域 : 买入 :当价格在下方 Keyzone 反转时。 卖出 :当价格在上方 Keyzone 反转时。 这些水平提供了可靠的进场和出场点参考。 趋势市场 在趋势市场中,Keyzone 帮助交易者识别突破机会: 上升趋势
FREE

HiLo Activator is a technical analysis indicator developed by Robert Krausz, a renowned hungarian trader with a career in the USA.
It is a trend indicator that helps you to predict the cange of the current trend. In an uptrend it is displayed at the bottom of the candles; in a downtrend it is displayed at the top.
Its only setting is the calculation period.
It is possible to have alerts when a new trend begin. Enjoy! This is a free indicator, but it took hours to develop. If you want to pay me a
FREE

Donchian Channel is an indicator created by Richard Donchian. It is formed by taking the highest high and the lowest low of the last specified period in candles. The area between high and low is the channel for the chosen period.
Its configuration is simple. It is possible to have the average between the upper and lower lines, plus you have alerts when price hits one side. If you have any questions or find any bugs, please contact me. Enjoy!
FREE

欢迎使用 RSI Colored Candles,这是一个创新的指标,旨在通过将相对强弱指数(RSI)直接集成到您的价格图表中,来提升您的交易体验。与传统的 RSI 指标不同,RSI Colored Candles 使用四种颜色方案来表示 RSI 水平,直接显示在您的蜡烛图上,为您提供一目了然的有价值见解。 特点和优势: 节省空间设计: 告别杂乱的指标窗口!RSI Colored Candles 通过消除独立的 RSI 窗口的需求,节省宝贵的图表空间,为您提供更清晰和更简洁的交易体验。 超买和超卖区域的可视化表示: 在您的价格图表上轻松识别超买(由红色蜡烛表示)和超卖(由蓝色蜡烛表示)状态。这种视觉表示赋予您做出更好的交易决策并利用潜在的反转机会的能力。 增强的入场信号: 将颜色编码的蜡烛用作交易信号,蓝色蜡烛表示买入机会,红色蜡烛表示卖出机会。这种简单直接的方法简化了您的交易过程,并根据 RSI 条件提供清晰的入场点。 与供需区域的集成: 将 RSI Colored Candles 与供需分析相结合,进一步增强您的交易策略。通过在关键的供需区域识别 RSI 极端值,您可以最大程度地提
FREE

This is a simple Candle Stick Pattern Indicator, which shows in the current time period all standardisized Patterns in the chart. All Patterns will be calculatet automatically based on standard conditions. Following Candle Stick Patterns are included: Bullish Hammer | Bearish Hammer Bullish Inverted Hammer | Bearish Inverted Hammer Bullish Engulfing | Bearish Engulfing Piercing | Dark Cloud Cover Bullish 3 Inside | Bearish 3 Inside There are only a few settings at the begining to take. Every Pat
FREE

Cybertrade Keltner Channels - MT5 Created by Chester Keltner, this is a volatility indicator used by technical analysis. It is possible to follow the trend of financial asset prices and generate support and resistance patterns. In addition, envelopes are a way of tracking volatility in order to identify opportunities to buy and sell these assets.
It works on periods longer than the period visible on the chart. All values are available in the form of buffers to simplify possible automations.
FREE

Do you love VWAP? So you will love the VWAP Cloud . What is it? Is your very well known VWAP indicator plus 3-levels of Standard Deviation plotted on your chart and totally configurable by you. This way you can have real Price Support and Resistance levels. To read more about this just search the web for "VWAP Bands" "VWAP and Standard Deviation".
SETTINGS VWAP Timeframe: Hourly, Daily, Weekly or Monthly. VWAP calculation Type. The classical calculation is Typical: (H+L+C)/3 Averaging Period to
FREE

Using the Stochastic Oscillator with a Moving Average is a simple but very efficient strategy to predict a trend reversal or continuation.
The indicator automatically merges both indicators into one. It also gives you visual and sound alerts.
It is ready to be used with our programmable EA, Sandbox, which you can find below: Our programmable EA: https://www.mql5.com/en/market/product/76714 Enjoy the indicator!
This is a free indicator, but it took hours to develop. If you want to pay me a coff
FREE

Hi-Lo is an indicator whose purpose is to more precisely assist the trends of a given asset - thus indicating the possible best time to buy or sell.
What is Hi-lo?
Hi-Lo is a term derived from English, where Hi is linked to the word High and Lo to the word Low. It is a trend indicator used to assess asset trading in the financial market.
Therefore, its use is given to identify whether a particular asset is showing an upward or downward trend in value. In this way, Hi-Lo Activator can be tran
FREE

交易实用必备工具指标 波浪自动计算指标,通道趋势交易 完美的趋势-波浪自动计算通道计算 , MT4版本 完美的趋势-波浪自动计算通道计算 , MT5版本 本地跟单复制交易 Easy And Fast Copy , MT4版本 Easy And Fast Copy , MT5版本 本地跟单复制交易 模拟试用 Easy And Fast Copy , MT4 模拟账号运行 Easy And Fast Copy , MT5 模拟账号运行 高级布林带: 1.布林中轨会随着方向变色 " 2.布林外轨扩张和收缩都会在外轨进行变色标识" 3.布林中轨计算方式可以选择任意均线,例如EMA" 4.同样可以选择任意价格应用模式进行计算" 强烈推荐趋势指标 , 波浪的标准自动计算 和 波浪的标准自动计算MT5版本 "合作QQ:556024" "合作wechat:556024" "合作email:556024@qq.com"
布林线(Bollinger Band) 是根据统计学中的标准差原理设计出来的一种非常实用的技术指标。它由 三条 轨道线组成,其中上下两条线分别可以看成是
FREE

交易实用必备工具指标 波浪自动计算指标,通道趋势交易 完美的趋势-波浪自动计算通道计算 , MT4版本 完美的趋势-波浪自动计算通道计算 , MT5版本 本地跟单复制交易 Easy And Fast Copy , MT4版本 Easy And Fast Copy , MT5版本 本地跟单复制交易 模拟试用 Easy And Fast Copy , MT4 模拟账号运行 Easy And Fast Copy , MT5 模拟账号运行 MACD称为异同移动平均线,是从双指数移动平均线发展而来的 ,由快的指数移动平均线(EMA12)减去慢的指数移动平均线(EMA26)得到快线DIF,再用2×(快线DIF-DIF的9日加权移动均线DEA)得到MACD柱。MACD的意义和双移动平均线基本相同,即由快、慢均线的离散、聚合表征当前的多空状态和股价可能的发展变化趋势,但阅读起来更方便。MACD的变化代表着市场趋势的变化,不同K线级别的MACD代表当前级别周期中的 买卖趋势。
1.本指标增加MACD的双线显示, 2.并且对能量柱进行4色不同的渐变! 强烈推荐趋势指标, 波浪的标准自动计算 和
FREE

海肯阿什MT5指标 提升您的交易分析能力,使用海肯阿什MT5指标。 这款强大的工具将标准价格数据转化为更平滑、 趋势化的烛形图, 让您更轻松地识别市场趋势和潜在的逆转点。 主要特点: 清晰的趋势识别: 通过不同的烛身颜色, 直观区分上升和下降趋势。 降低噪音: 过滤价格波动, 更清晰地呈现市场主要走势。 提前发现趋势: 在标准图表上显示趋势变化之前, 提前预测潜在趋势变化。 多功能应用: 可独立使用或与其他技术指标结合进行综合分析。 自定义设置: 根据您的具体交易偏好和策略调整指标。 优势: 提高您识别趋势和潜在进出场点的能力。 减少市场噪音的影响, 专注于重要的价格变动。 基于对市场动态的更清晰理解, 做出更明智的交易决策。 利用经过验证的技术分析工具, 获得竞争优势。 适合人群: 希望提升技术分析能力的各级交易者。 偏好更平滑、 趋势导向的市场视图的交易者。 寻求工具来补充现有交易策略的交易者。 解锁海肯阿什MT5指标的潜力,将您的交易提升到新的水平! 注意: 为了更有效地推广产品, 建议添加有关可使用该指标的具体策略的信息, 并提供带有使用示例的图表截图。 您是否希望添加更多关
FREE

This is the Chandelier Exit trend indicator applied to heiken ashi candles based on "G TREND GUNBOT" by "LUIS_GANDATA_G_TREND" on tradingview. The screenshot shows similar results from tradingview and Metatrader when tested on ICMarkets on both platforms.(make sure to disable heiken ashi mode to get the same results as the screenshot.) Heiken ashi candles filter out many of the chops and therefore as an input to Chandelier Exit you achieve well filtered Buy and Sell signals. Also you can choose
FREE

Line Profit 存款货币的可视利润线指标。仅当市场上有安装指标的符号的未平仓头寸时才有效。您可以用鼠标移动线或启用自动跟踪买入价。 指标设置说明: colotLine - 线条颜色 WidthLine - 线宽 colotText - 文本颜色 FontSize - 文本的高度 Anchor - 文本的锚点方法 FollowBid - 跟随买入价 Line Profit 存款货币的可视利润线指标。仅当市场上有安装指标的符号的未平仓头寸时才有效。您可以用鼠标移动线或启用自动跟踪买入价。 指标设置说明: colotLine - 线条颜色 WidthLine - 线宽 colotText - 文本颜色 FontSize - 文本的高度 Anchor - 文本的锚点方法 FollowBid - 跟随买入价
FREE

This Engulfing Candle Indicator as the name implies can detect engulfing candlestick patterns on the chart. The indicator alerts the user of the presence of an engulfing candle (Bearish engulfing candle and Bullish engulfing candle) by using visual representation of arrows on the chart. - Blue arrow for Bullish engulfing - Red arrow for Bearish engulfing Extra modifications can be added based on request.
FREE

Flux Binary FX is a powerful trading tool designed specifically for binary options and forex trading. This innovative indicator utilizes a unique approach to identify significant market trends, providing traders with clear signals to enhance their trading strategies. Key Features: Flux Trend Detection: The indicator generates arrows on the chart that indicate the presence of a flux trend. This feature allows traders to quickly identify potential entry and exit points, making it easier to cap
FREE

This comprehensive technical indicator calculates and plots up to 3 moving averages with 3 different periods. By employing three moving averages of distinct lookback periods, the trader can confirm whether the market has indeed experienced a change in trend or whether it is merely pausing momentarily before resuming its prior state. SX Golden MA Pack for MT4 is available here . The shorter the moving average period, the more closely it tracks the price curve. When a security initiates an upt
FREE
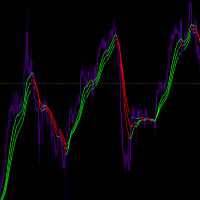
Input Parameters JawPeriod (default=9): Period for the blue line JawShift (default=0): Shift for the blue line TeethPeriod (default=7): Period for the red line TeethShift (default=0): Shift for the red line LipsPeriod (default=5): Period for the green line LipsShift (default=0): Shift for the green line Signals Bullish Conditions When price moves above all lines (all lines turn Lime) Potential buying opportunity Confirms upward momentum Bearish Conditions When price moves below all
FREE
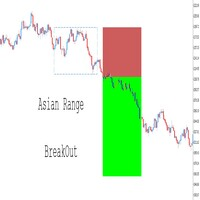
完全可定制 – 通过调整范围时间、颜色、线条样式和风险回报设置,使该指标适应您的个人交易风格。 交易水平可视化 – 根据突破条件自动绘制入场价格、止损 (SL) 和止盈 (TP) 水平。 与智能交易系统 (EAs) 无缝集成 – 通过添加额外的确认信号(如 RSI、均线、结构突破 (BOS) 等)来完全控制您的自动交易策略。您还可以 自定义缓冲区名称 ,以匹配您的 EA 需求,从而实现更大的策略灵活性。 多资产 & 多时间框架回测 – 在 外汇货币对、加密货币及其他交易工具 上测试不同配置,找到最适合您的交易策略的设置。 清晰简洁的界面 – 以非干扰性的显示方式关注价格走势,使交易信号更易于理解。 该指标为交易者提供了 突破策略的坚实基础 ,但其真正的优势在于灵活性。您可以 修改和增强 它,结合额外的指标或逻辑,以适应您的独特交易方法。 试用、回测,并优化它,以匹配您的个性化交易策略! 立即在 MQL5 上获取完整版,让您的交易更进一步!
FREE

For those who love to trade using the Heikin Ashi Candlesticks, here it is a powerful ally: Heikin Ashi Delta . This indicator was presented by Dan Valcu in his book about Heikin Ashi candlesticks called " Heikin Ashi - How To Trade Without Candlestick Patterns " - and by the way this is a very cool book, we totally recommend it. Even for those of you who don't trade using Heikin Ashi candlesticks could use this Leading Indicator anyway. It is more "nervous" than let's say a Stochastic, but coul
FREE

Sessions are very important in trading and often good area where to look for setup. In SMC, ICT we will look for Asian session to serve as liquidity
This indicator displays: High & Low of the Asia session Midnight New York time opening line
Congifuration Line Style, color Label position, size, color Start of the level (Start of the day, Start of the session, Highest or Lowest point in the session)
Any questions or comments, send me a direct message here https://www.mql5.com/en/users/mvonline
FREE

You get a moving average indicator with different methods (exponential, linear, smoothed and linear weighted) calculated on smooth Heikin Ashi candles included in 'Examples' folder of Meta Trader 5. This program is dedicated for everyone trader in the market who is collecting necessary indicators designed for work with reduced market noise to better identify trends and buy opportunity.
FREE

考拉价格行为扫描仪 - 发掘价格行为的力量 **介绍:**发现全新的考拉价格行为扫描仪 - 一款多功能、多货币、多时间框架的工具,旨在检测基本价格行为模式,并在直观的扫描表中呈现。 **摘要:**该指标超越寻常,为用户提供在多个货币和时间框架上识别关键价格行为模式的能力。 特点: 吞没模式(Engulf Pattern) 锤子模式(PinBar Pattern) 十字模式(Doji Pattern) 可定制设置: 吞没模式: 第2根蜡烛的最小实体大小:定义第2根已关闭蜡烛的最小实体大小(即第2根已关闭蜡烛)。 第1根蜡烛的最小实体大小:设定最近已关闭蜡烛的最小实体大小。 锤子模式: 最大实体百分比:通过此参数,您可以调整锤子实体的最大百分比,相对于影线的大小。 十字模式: 最大较小实体大小:用户可以通过此参数调整最大实体大小。在纯粹的十字模式中,实体大小必须为0,但用户可能想以最大10点的大小查看模式。 符号设置: 输入最多10个符号名称,符号名称必须与市场观察符号字符相匹配。用户可以使用“最大符号”参数控制这些符号中的出现数量。 时间框架设置: 切换M1至MN时间框架,启用或禁用每个
FREE

机构级别/银行级别...心理级别/季度理论。
该指标将自动在“000、200、500 和 800”级别绘制,即我所知道的“机构级别”,或者也可以在图表上绘制“000、250、500 和 750”级别。
根据您学习机构级别交易/季度理论的位置,您可能知道它们有不同的名称,本质上核心思想是这些级别在大多数外汇市场中充当强大的支撑和阻力点。
群聊: https://www.mql5.com/en/users/conorstephenson 如有任何问题或购买后需要设置/操作建议,请联系我,谢谢! 主要功能
在当前价格上方和下方的数字“000、200、500 和 800”或“000、250、500 和 750”处绘制支撑和阻力或线条。 警报功能。- 能够使用 MT4 移动应用程序在达到数字时通知。 可自定义的线条类型、颜色和大小。 节省在每个图表上绘制级别的时间! 在机构和四分之一点级别之间快速切换。 强大的视觉支撑和阻力线。 独特的功能,用于搜索和动态调整支撑和阻力点的大小。 最新版本现在包括 S&R 点内的建议交易水平。 建议
与可靠的趋势指标一起使用以确认方向。检查多个时间范围以进一
FREE
: 堅硬的]。
低負 25% 線寬 [默認為:4]。
當地市場開盤線顏色[默認為:DodgerBlue]。
本地市場開盤線樣式[默認為:虛線]。
本地市場開盤線寬度[默認為:1]。
當地市場中間線條顏色[默認為:DarkOrchid]。
本地市場中線樣式[默認為:虛線]。
本地市場中線寬度[默認為:1]。
本地市場收盤線顏色[默認值:紅色]。
當地市場收盤線風格[虛線]。
當地市場收盤線寬度[1]。
當地市場開盤價顏色[白色]。
當地市場開盤價樣式[雙點虛線]。
當地市場開盤價寬度[1]。
該指標的線條可以通過 MQL5 對象函數在 EA 交易中調用。 如果沒有即時市場數據,該指標將不會加載——市場必須開放。
法律免責聲明:本文中的任何內容均不得解釋為交易或投資建議。 上面提供的任何和所有示例僅說明此處發布的指標的技術特徵和假設用途
FREE

加入 考拉交易解决方案频道 在MQL5社群中,获取有关所有考拉产品的最新信号和新闻,加入链接如下: https://www.mql5.com/en/channels/koalatradingsolution 欢迎使用BTC级别指示器
考拉BTC液位指示器
这个指标适合那些喜欢购买BTC的人,正如您所知,BTC是过去几年以及现在的最佳投资项目之一,因此该指标仅向我们显示了比特币的购买水平。
考拉BTC等级指示器可以根据深度参数确定最低点,深度参数可以作为输入进行调整,然后从最低点扩展线到当前时间,并绘制箭头和价格水平,向我们展示您需要在哪里购买BTC。
这些支撑位是购买BIT COIN的最佳和最安全的水平,因此当比特币开始下跌时,请不要担心,只需在这些水平上进行购买即可。
考拉BTC级别输入参数:
BTC支持深度:通过此参数,您可以影响支撑的力量,更高的值向我们展示更多的力量全支撑水平。 (20对H1和H4有利)
最高历史记录:此参数询问历史记录中必须扫描多少支蜡烛才能计算支撑线。
我对谁爱考拉BTC指标的要求:
**尊敬的客户,请在Koala趋势线上
FREE

The indicator draws the daily open line. Parameters
GMT shift (minutes) The time zone could be shifted. The value is given in minutes. Draw closest regular bar's open price This parameter could fine-tune the open price line when using GMT shift. Yes - Draw the open line based on the current chart period's closest regular bar No - Draw the open line based on the M1 chart's closest bar. Let's assume that your shift is 10 minutes, and you are using H1 chart and the first candle in every day is 0
FREE
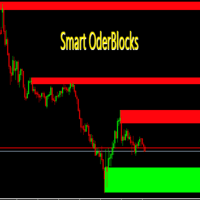
Smart OrderBlocks Indicator for MetaTrader 5 A Differentiated Vision and a Bit of Price Action! Smart OrderBlocks is an advanced indicator that reveals market structure from a unique perspective through intelligent supply and demand zone detection. Key Features OrderBlocks Detection Internal OrderBlocks : Capture micro-level market dynamics Swing OrderBlocks : Identify macro market momentum trends Advanced Volatility Intelligence Volatility detection using: Adaptive Average True Range (AT
FREE

This Mt5 Indicator Signals when there is two opposite direction bars engulfed by current bar. has a recent Exponential Moving Average Cross and past bar was oversold/bought Expert Advisor Available in Comments Free Version Here : https://www.mql5.com/en/market/product/110114?source=Site  ; Full Alerts for mt5 terminal , phone , email, print to file, print to journal Buy Signal ( blue line ) Past ema cross ( set at 30 bars back ) Past bar rsi is oversold ( level 40 ) Engulfing bar closes
FREE

如果你象这个项目一样,就有5个饥饿审查。 由于机构贸易量很大,因此它们不愿意努力设法争取。
在特定百分比上捍卫立场。 这些级别将成为你可以利用的自然支持和抵抗力。
进入贸易或了解对你立场的可能危险。 一个共同使用百分比的实例是欧盟可持续发展集团的0.25%和0.50%。
星期,你可以看到关于屏幕的这一例子。 有了这一指标,你将能够利用百分比的差异: 日。 周。 Month. 资格。 年。
FREE

This indicator uses the Zigzag indicator to identify swing highs and swing lows in the price chart. Once it has identified the swing highs and swing lows, it can use them to determine potential support and resistance levels. A support level is formed when the price drops and bounces back up from a swing low, indicating that there is buying pressure at that level. A resistance level is formed when the price rises and reverses downward from a swing high, suggesting selling pressure at that level.
FREE

Stochastic Alert Indicator for MetaTrader 5
The Stochastic Alert Indicator is a powerful and customizable tool designed for the MetaTrader 5 platform, perfect for traders who want to monitor overbought and oversold conditions while staying informed of potential buying and selling pressure. Key Features: Overbought/Oversold Detection: Automatically detects when the market reaches overbought (above 80) or oversold (below 20) levels, providing you with timely alerts for potential reversal points.
FREE
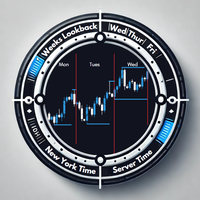
Overview The Daily Session Separator indicator is a powerful tool designed to enhance your trading experience by clearly marking daily trading sessions on your chart. It helps traders visualize daily boundaries, session highs and lows, and essential day-specific data to make informed decisions. With its seamless integration into any chart and dynamic adaptability, this indicator is a must-have for traders who rely on precision and clarity. Key Features Daily Session Separators Automatically adds
FREE

Developed by Chuck LeBeau, the Chandelier Exit indicator uses the highest high / lowest low -/+ a multiple of the ATR value to draw trailing stop lines (orange under buys, magenta over sells) that advance with the trend until the trend changes direction.The value of this trailing stop is that it rapidly moves upward in response to the market action. LeBeau chose the chandelier name because "just as a chandelier hangs down from the ceiling of a room, the chandelier exit hangs down from the high
FREE
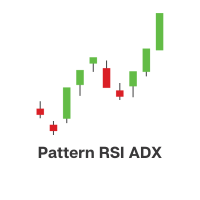
The Pattern ADX RSI indicator is a powerful trading tool designed to enhance decision-making by combining the strengths of three distinct components: price patterns , Relative Strength Index (RSI) , and Average Directional Index (ADX) . This indicator waits for specific pattern signals to emerge in the market and then applies filtering mechanisms based on RSI and ADX readings to confirm the quality of the signal before executing trades. Key Components Pattern Detection : The indicator
FREE

介绍强大的NRTR(Nick Rypock Trailing Reverse)指标 - 这是一个必备的技术工具,用于帮助交易员识别趋势反转并设置有效的跟踪止损水平。由Nick Rypock开发,该指标采用独特的算法,可以适应不断变化的市场条件,成为任何交易者工具箱中不可或缺的一部分。
以下是交易员使用该指标的两种常见方式:
1. 趋势反转:NRTR指标在趋势即将反转时生成清晰的信号。留意指标线穿过价格图表,这是潜在趋势方向转变的信号。
2. 跟踪止损:NRTR还可作为可靠的跟踪止损工具,可在趋势市场中保护利润。当价格朝着预期方向移动时,NRTR线会动态地跟随价格,提供灵活的止损水平。
可自定义参数:通过调整指标的参数,将NRTR指标调整为适合您的交易偏好和时间框架。尝试不同的设置,找到最适合您独特交易风格的配置。为了提升交易策略,考虑将NRTR指标与其他技术指标结合使用。使用多个指标可以验证信号,并提高整体交易准确性。
总之,NRTR指标对于希望识别趋势反转并实施有效的跟踪止损的交易员来说是一个宝贵的资产。其适应性和用户友好的设计使其成为交易者中受欢迎的选择,有助于提高交易
FREE
The TrendChannelTracker Indicator is an innovative Forex trading tool. This indicator, which is based on the standard Stochastic Oscillator, provides traders with a unique and simplified method for observing market trends. In contrast to the traditional Stochastic Oscillator, which is shown at the bottom of the chart, the TrendChannelTracker Indicator is built into the price action itself. This removes the need for traders to continually switch their attention between the oscillator and the pri
FREE

The Donchian Channel Channels are among the most popular tools of technical analysis, as they visually convey to the analyst the limits within which most price movement tends to occur. Channel users know that valuable information can be obtained at any time, whether prices are in the central region of a band or close to one of the border lines.
One of the best known techniques to explore these concepts is Bollinger Bands. However, John Bollinger was not the only one to research the application
FREE

Idea extracted from the books by Anna Coulling and Gavin Holmes using Volume and Spread Analysis (VSA) techniques coupled with Al Brooks' expertise with Price Action these candles are magical, identify the exact moment
of the performance of the big players are acting in the market represented by the colors:
1) Red Candles we have an Ultra High activity,
2) Candles Orange we have a Very High Activity
3) Candles Yellow we have one High Activity
4) White Candles represent normal activity in
FREE

The Volume Weighted Moving Average (VWMA) is calculated based on Prices and their related Volumes giving importance to those candles with more Volume. During periods of almost equal volume distributed along the observed period (commonly, in low volume periods) the VWMA will be graphically similar to a Simple Moving Average. Used along other moving averages a VWMA could be used as an alert, filter or whatever your imagination could think of...
HOW TO "READ" THIS INDICATOR As any Moving Average.
FREE

ChannelRSI5 具有超买和超卖区域动态水平的相对强弱指数 (RSI) 指标。
动态水平随指标和价格的当前变化而变化和调整,代表一种通道。
指标设置 period_RSI - 计算 RSI 指数的平均周期。 Applied_RSI - 应用价格。它可以是任何价格常数:PRICE_CLOSE - 收盘价,PRICE_OPEN - 开盘价,PRICE_HIGH - 期间的最高价,PRICE_LOW - 期间的最低价,PRICE_MEDIAN - 中间价(高 + 低) / 2, PRICE_TYPICAL - 典型价格(最高价 + 最低价 + 收盘价)/ 3, PRICE_WEIGHTED - 加权平均价,(最高价 + 最低价 + 收盘价 + 收盘价)/ 4。
period_channel - 超买超卖区域动态通道的计算周期。
FREE
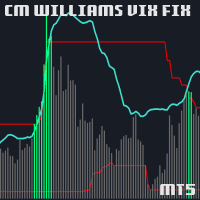
This is CM Williams VIX Fix Indicator by ChrisMoody adapted to MQL5 The CM Williams VIX Fix indicator, developed by Larry Williams, is a technical analysis tool designed to replicate the market sentiment insights provided by the CBOE's VIX, but applicable to a wide range of asset classes beyond stock indices.Unlike the actual VIX, which measures implied volatility in the S&P 500 options market, the VIX Fix utilizes historical price data to identify periods of significant market stress, often as
FREE
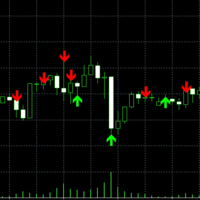
该指标能够标示出在整体趋势向上或向下的情况下,由于突然的压力导致单根K线趋势发生反转的关键点位,而指标中显示的箭头是基于对上一根K线的分析得出的,只有当上一根K线符合特定的条件时,才会触发趋势的变化信号。 在制定交易策略时,如果连续出现3到4个方向相同的箭头,这通常可以被解读为市场可能即将突破的信号。例如,当您观察到第4个箭头出现时,可以将其视为开仓的参考依据。通过这种方式,该指标为预测市场的重大波动以及优化交易决策提供了一个可靠且高效的工具,帮助您更好地把握交易机会。 . . . . . . . . . . . .. . . . . . .. . . . . . . .. . . . . . .. . . . . . .. . . . . . . .. . . . . .. . . . . . . .. . . . 简而言之,此指标基于蜡烛图形态生成信号:
蜡烛图为看跌,但其上影线超过了前一根蜡烛图。 蜡烛图为看涨,但其下影线低于前一根蜡烛图。 如果点赞数足够多,我将分享一个EA,它在所有货币对上都能产生与该指标生成的第二张图片中结果类似的效果。
FREE

The Hybrid Stochastic indicator is a Stochastic RSI described by the famous Tushar Chande and Stanley Kroll in their book called " The New Technical Trader" . The main goal of this indicator is to generate more Overbought and Oversold signals than the traditional Relative Strength indicator (RSI). Combining these 2 indicators expands the range of the overbought and oversold territory. The idea behind it is to use the Stochastic formula over RSI values. If you want to know more about its internal
FREE

BREAKOUT-SESSION-BOX LONDON EU US ASIA Open
watch the expectation of a volatile movement above or under the opening range We take the high of the range as Entry for a long trade and SL will be the low of the range and vice versa the low of the range as Entry for a short trade and the high for SL The size of the range is the distance to the TP (Take Profit) The range of the opening hours should not be larger than about 1/3 of the average daily range 4 breakout examples are already predefined: A
FREE

交易时段指标突出显示每个交易时段的开始和结束。 Trading_Sessions_Indicator_Pro产品的付费版本,可以自定义会话的开始/结束 >>>
[选项:] Timeshift - 如果会话存在时间偏移,则使用它
[设置参数:] Asian session Open=0; Asian session Close=9; Asian session OpenSummertime=1; Asian session CloseSummertime=10; European session Open=8; European session Close=17; European session Open=13; European session Close=22;
我在市场上的其他产品 https://www.mql5.com/en/users/sky-angel/seller
FREE

### 介绍 MetaTrader 5 的终极枢轴点水平指标
Ultimate_Pivot_Levels 是一种多功能工具,旨在通过准确绘制枢轴点水平来增强您的交易体验。它允许您手动输入所需的值或使用众所周知的枢轴点计算方法来创建枢轴点水平。它在背景中绘制这些水平,并允许您自定义水平、区域的大小和颜色,同时在每个新柱状图中保持您的调整。无论您是新手交易者还是经验丰富的专业人士,此指标都能为您提供灵活性和精确度,使您能够做出明智的交易决策。
### 主要特点
1. **多种枢轴点计算方法**:Ultimate_Pivot_Levels 指标支持多种枢轴点计算方法,允许您选择最适合您的交易策略的方法:
- **手动值**:输入您的自定义枢轴点水平,或从所需的频道或网站复制粘贴。
- **标准方法**:基于前一周期的高、低和收盘价格的经典枢轴点计算方法。
- **Camarilla 方法**:以其独特公式而闻名的流行方法。
- **Woodie 方法**:一种变体,更多地考虑了收盘价。
- **DeMark 方法**:由 Tom DeMark 开
FREE

A very simple indicator, but one that cannot be missed when carrying out your operations.
Fast and accurate Spreed information before entering a trade as well as the time to start another candlestick.
Spread refers to the difference between the buy (purchase) and sell (offer) price of a stock, bond or currency transaction.
Come and see our mql5 signals too. https://www.mql5.com/pt/signals/899841?source=Site +Signals+From+Author
FREE
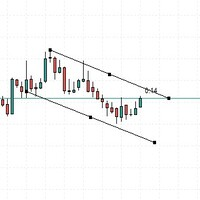
This indicator serves to give sound alerts when the price passes the manually placed line. A very useful tool, which allows you not to spend too much time sitting in front of the computer.
Note that the alert issued will always refer to the current candle, you can use multiple lines on the past chart to analyze.
This indicator will always receive better updates.
FREE

当趋势爆发时获得警报。 该指标在价格向主导趋势方向大幅移动时发出信号。 这些信号可以作为入口点,或添加到趋势中现有位置的点。
注意:趋势跟踪的赢率很低(低于50%),但平均赢的交易回报通常比平均输的交易大3到5倍。
简单的设置 拖放到任何图表,在任何时间框架. 启用警报(可选) 你就完了! 视觉和音频警报 警报直接发送到您的手机 弹出警报发送到您的终端 多用途 股票、外汇、期权、期货 灵活 适用于任何时间范围 注意:趋势跟踪的赢率很低(低于50%),但平均赢的交易回报通常比平均输的交易大3到5倍。 注意:趋势跟踪的赢率很低(低于50%),但平均赢的交易回报通常比平均输的交易大3到5倍。 注意:趋势跟踪的赢率很低(低于50%),但平均赢的交易回报通常比平均输的交易大3到5倍。
FREE

MT5 Candlestick Pattern Alert Indicator: Enhance Trading Precision and Speed Overview The MT5 Candlestick Pattern Alert Indicator stands as a robust solution tailored to empower traders by swiftly detecting candlestick patterns and delivering timely alerts through various channels. This advanced tool facilitates efficient analysis of patterns, enabling traders to seize potential profitable trades promptly. Significance of Candlestick Patterns Candlestick patterns play a pivotal role in technical
FREE

The Weis Wave first takes the market volume and then organizes it with the price into Wave charts. It is the only software that will present the true picture of the market before you. If anyone of you, has watched an intraday price movement then you must know that it unfolds in a series of selling as well as buying waves-a procedures tearing down and building up. Wave analysis is an integral part of the trading method. The indicator helps to deal with today’s volatile market. Moreover, it works
FREE

Aggression Volume Indicator is the kind of indicator that is rarely found in the MQL5 community because it is not based on the standard Volume data provided by the Metatrader 5 platform. It requires the scrutiny of all traffic Ticks requested on the platform... That said, Aggression Volume indicator requests all Tick Data from your Broker and processes it to build a very special version of a Volume Indicator, where Buyers and Sellers aggressions are plotted in a form of Histogram. Additionally,
FREE

This indicator forms a channel based on the readings of the ADX (Average Directional Movement Index) indicator, displays and informs the trader of a price reversal at the boundaries of this channel, and can also report when the price touches the channel boundaries. It also draws additional dotted lines, which depend on the readings of the + DI and -DI of the ADX indicator. It also has an option for filtering signals depending on the readings of the stochastic. The channel drawn by this indicato
FREE

Original supertrend indicator in Tradingview platform. Indicator type: Price Action indicator Introduction: The Supertrend Indicator - Enhancing Your Trend Analysis. If you haven't yet found a Supertrend indicator with good graphics on the MQL5 platform, this is the indicator for you. Overview: The Supertrend Indicator is a powerful tool designed to provide traders with valuable insights into the current and historical trends of financial markets. It serves as a valuable addition to any t
FREE

RSI on Moving Average Indicator for MT5 Introduction The RSI on MA Indicator integrates Moving Average Crossovers with the Relative Strength Index (RSI) to enhance trend detection and momentum analysis. By merging these technical elements, it improves precision in identifying market movements. The indicator displays two oscillating lines ranging from 0 to 100, making it easier to pinpoint buy and sell opportunities while clarifying trend directions.
RSI on Moving Average Indicator Specification
FREE

不同货币对的行为是相互关联的。 Visual Correlation 指标允许您在一张图表上显示不同的工具,同时保持比例。 您可以定义正相关、负相关或无相关。
有些仪器比其他仪器更早开始移动。 这样的时刻可以通过叠加图来确定。
要在图表上显示工具,请在 Symbol 字段中输入其名称。
亲爱的朋友! 我们提请您注意视觉相关性指标。 主要优点及其工作原理: 不同貨幣對的行為是相互關聯的。 Visual Correlation 指標允許您在一張圖表上顯示不同的工具,同時保持比例。 您可以定義正相關、負相關或無相關。
有些儀器比其他儀器更早開始移動。 這樣的時刻可以通過疊加圖來確定。
要在圖表上顯示工具,請在 Symbol 字段中輸入其名稱。 MT4版本 https://www.mql5.com/zh/market/product/33063
FREE

When working with several assets and having several open positions in different assets, it is a little complicated to visualize how much profit or loss is in each asset, so with this problem in mind I developed this indicator where it facilitates the visualization of open operations in each asset , where you will be able to open several different assets and you will be able to visualize the individual result of each asset and speed up your decision making in your trades.
FREE

Version 1.5: manual color change added
This indicator helps to trade price action and momentum strategies like Guerrilla Trading or similar strategies.
The indicator displays: most recent highs and lows number of consecutive breaks past breaks of most recent highs and lows retest lines flag formations manual color change User can change colors. Go to Indictor Properties/Input, set "Auto Color" to false and change the colors. Set "Auto color" back to true to go back to pre-set colors. Please wa
FREE

If you have the opportunity to read the book " Trend Trading - A Seven-Step Approach to success " by Daryl Guppy, you will have a great deal of information about how to "read" the market. In his book Daryl show, among other things, how can we use a visual tool to measure the volatility and trend between Long and Short-term periods: The GMMA - Guppy Multiple Moving Averages .
Instead of using his original idea of having 12 Exponential Moving Averages in your chart - which could be very CPU-deman
FREE

The Omega Trend Indicator is an advanced tool that has been specifically designed to detect market trends early, and follow them efficiently. The indicator draws two lines. The main (thicker) Trend Line represents the presumed lower or upper volatility limits of the current market trend. A break in the main Trend Line indicates a potential reversal or shift in the movement of the trend. The Trend Line also indicates the best point to place a stop loss order. In Omega Trend Indicator, the Trend L
FREE

A combined indicator of two famous indicators: RSI , Bollinger Bands Can be used in all currency pairs Can be used in all time frames with many signals Very simple and fast to use
Description:
This indicator is made from the combination of RSI and Bollinger Bands indicators
As you can see, it shows good signals and is worth using and testing
We hope you are satisfied with this indicator
Settings: show past show candle: Displays the number of candles that the indicator calculates.
For example
FREE

Pivot Classic, Woodie, Camarilla, Fibonacci and Demark Floor/Classic Pivot points, or simply pivots, are useful for identifying potential support/resistance levels, trading ranges, trend reversals, and market sentiment by examining an asset's high, low, and closing values. The Floor/Classic Pivot Points can be calculated as follows. Pivot Point (P) = (High + Low + Close)/3 S1 = P * 2 - High S2 = P - (High - Low) S3 = Low – 2*(High - P) R1 = P * 2 - Low R2 = P + (High - Low) R3 = High + 2*(P - Lo
FREE
The Trend ADX RSI Volumes is an advanced technical indicator that combines the Average Directional Index (ADX), the Relative Strength Index (RSI), and volume information to provide a comprehensive analysis of market trends. This indicator is designed to help traders identify not only the strength of a trend but also its direction and validity. Key Features of the Indicator Trend Strength Measurement : The ADX quantifies the strength of a trend on a scale from 0 to 100. Values above 25 ge
FREE

速度阻力线是确定趋势和阻力线的有力工具。 该指标使用图表极值和特殊的数学公式构建线条。 该指标可用于确定趋势方向和枢轴点。
<---------------------------->
指标参数:
"Depth of search" -搜索图表极值的深度(以条形为单位) "Back step of search" -极值之间的最小距离(以条为单位) "Deviation of price" -同一类型极端之间的允许价格差异 "Line color" -带有相应索引的线条颜色 "Line style" -带有相应索引的线条样式 "Line width" -具有相应索引的线宽 <---------------------------->
你可以在"艾德森*古尔德的稀有作品集"一书中找到更多信息,也可以在私人信息中与我联系。
<---------------------------->
提前感谢所有有兴趣的人,祝你好运征服市场!
FREE

JCAutoFibonacci 简繁自动绘制斐波那契 1.Zigzag3浪,大中小三浪分别代表市场潮流、趋势、涟漪,以不同参数实现。 使用自定义函数获取三浪高低点,以最近高低点作为绘制价格与时间。 2.Fibonacci,黄金分割线,水平线比例0、0.236、0.318、0.50、0.618、1.0、1.236、1.382、1.50、1.618、2.0等。 斐波那契返驰理论包括:反弹/回调现象、反转现象。合理绘制Fibonacci获取市场有效SR。分别绘制三浪。 3.自定义Fibo颜色,自定义水平线比例(0为不显示),自定义水平线颜色,自定义可选择,自定义右射。 备注:如遇使用问题,请联系邮箱:16692618587@163.com
FREE

Auto Fibo Expansion is an indicator that projects the Fibonacci expansion levels above and below the opening price of the day. It does the calculation based on the previous day and projects the levels on the current day. It is very efficient to find "psychological" zones of support and resistance. Its appearance is all configurable and you can set up to 30 different levels. Enjoy! This is a free indicator, but it took hours to develop. If you want to pay me a coffee, I appreciate a lot <3 PayP
FREE

If you heard about The Wyckoff Method, Volume Spread Analysis, etc... You are probably searching for the candlestick indicator that shows you the Volume spread all over the current bar, signaling every types of market status... You can control the several Market Levels with custom colors...
It is up to you to decide how to use it. Our job is provide you with the indicator...
If you like this indicator, all I am asking is a little Review (not a Comment, but a REVIEW! )... This will mean A LO
FREE

BEHOLD!!!
One of the best Breakout Indicator of all time is here. Multi Breakout Pattern looks at the preceding candles and timeframes to help you recognize the breakouts in real time.
The In-built function of supply and demand can help you evaluate your take profits and Stop losses
SEE THE SCREENSHOTS TO WITNESS SOME OF THE BEST BREAKOUTS
INPUTS
MaxBarsback: The max bars to look back
Slow length 1: Period lookback
Slow length 2: Period lookback
Slow length 3: Period lookback
Slow
FREE
MetaTrader市场提供了一个方便,安全的购买MetaTrader平台应用程序的场所。直接从您的程序端免费下载EA交易和指标的试用版在测试策略中进行测试。
在不同模式下测试应用程序来监视性能和为您想要使用MQL5.community支付系统的产品进行付款。
您错过了交易机会:
- 免费交易应用程序
- 8,000+信号可供复制
- 探索金融市场的经济新闻
注册
登录