适用于MetaTrader 4的EA交易和指标 - 25

This Dashboard is free to download but is dependent on you owning the Flag Trend Pro MT4 indicator. Down load the indicator: Flag Trend Pro
The Dashboard will show you on a single chart all the timeframes (M1 to Monthly) with their own status for the indicator: Gold Pro MT4
all time frame and all symbol: smart algorithm detects the trend, filters out market noise and gives entry signals!!!
How to understand the status: symbol - Fill All the Pair what you want. M1, M5, M1
FREE
This indicator is an oscillator built on the principle of the classic Momentum. The indicator is part of a series of indicators - T3 Line AM, T3 Momentum AM, T3 Candles AM, T3 Signal AM .
The indicator represents the difference between the current price and the price some number of periods ago. The difference from the classic indicator Momentum is the preliminary smoothing of prices according to the method T3.
Using the indicator: It should be taken into account that the values of the ind
FREE

Trend easy простой трендовый индикатор в виде гистограмы. окно индикатора разделено на две части верхняя гистограма движение в бай, нижняя гистограма движениие в сел. Кроме гистограмы, сигнал индикатора дублируется на графике стрелками. В меню индикатора имеется количество баров в истории индикатора
значения периода для определения тренда разрешение рисования стрелок на графике код и цвета стрелок алерты и отступ стрелок
FREE

Action Scanner is a market scanner. It’s yet another product in my "Can’t trade with out it" series. Do you want to know what is moving right now? Action Scanner scans your watchlist and opens the 10 currently most moving charts. You can chose between, most moving in points, most moving in your account currency(if you were to trade it with a standard lot size 1.00) and most moving in percentage. The standard version is a complete tool with no limitations. However the pro version has additiona
FREE
Technical analysis indicator described in the article by Vladimir Kravchuk: " Digital indicators in the technical analysis of financial markets ".
In the proposed version, the indicator provides two types of signals: 1. Zero crossing; 2. Change of direction. To use it effectively, it is necessary to take into account the long-term trend and open a position only in its direction. It is recommended to use signal confirmation. A signal is considered confirmed if the current price has overcome the
FREE
This indicator is a moving average built using the classic Stochastic oscillator and ATR. The change in the direction of the moving average depends on the Stochastic oscillator overcoming its average value and leaving the price beyond the range determined using the ATR. The indicator is not redrawn on fully formed bars. The indicator values on a bar that has not completed its formation may change.
The application of the indicator is identical to the application of the standard moving average
FREE

Free version of https://www.mql5.com/en/market/product/44606 Simple indicator to calculate profit on fibonacci retracement levels with fixed lot size, or calculate lot size on fibonacci levels with fixed profit. Add to chart and move trend line to set the fibonacci retracement levels. Works similar as default fibonacci retracement line study in Metatrader. Inputs Fixed - select what value will be fix, lot or profit (available in full version, lot is set on free version) Fixed value - value t
FREE

Trend Rising 是自定義 MT4 (Metatrader 4) 指標,最適合剝頭皮 TF M30 及以下,使用基於多個時間框架的 Bill William 指標分析趨勢和動量模式。結果,它確定了適用於大多數貨幣對的趨勢的開始和結束。 Trend Rising 指標是基於 Accelerator Oscillator 和 Awesome Indicator 開發的。
主要特徵 用顏色顯示趨勢的開始和結束。 使用 base-TF H1 輕鬆識別趨勢強度(強牛市和熊市)。 識別市場調整。 (當前圖表的弱勢和可能的逆轉) 當建議的條目發佈時,在圖表上繪製 SL 級別。 獲取圖表中發生的每一次趨勢變化的警報。
趨勢上升的優勢 使用所有貨幣對(外匯、加密貨幣、指數和商品) 使用所有時間範圍。 (推薦時段:M30及以下TF) 警報生成器。 (彈出警報、推送通知警報等) 未重新粉刷 100% 免費指標
接觸 如果您有任何疑問或需要幫助,請通過私信與我聯繫。
作者 Safwan Daud,馬來西亞貿易分析師。青年商品交易員(YCT)
FREE
Trend Note Indicator Suitable for multi time frame market direction prediction. Blue and red color indicate the buy and sell call respectively. Blue indicator is denote buy call and Red indicator denote the sell call. Happy trade!! this indicator is suitable for all time frame, but our recommended time frame to use 1hour and 4 hours, suitable for any chart.
FREE

PLEASE HELP REVIEW/ SUPPORT/ SHARE THIS OTHER INDICATOR HERE https://www.mql5.com/en/market/product/51637 AS YOU DOWNLOAD THIS ONE FOR FREE. THANKS.
The indicator was created to make trading very easy to understand. It is based on five moving average crosses and pivot points. Download the "EASY TREND" on my Product list for a more advanced and profiting trades. You can trade with this indicator alone and get the maximum out of the market. If you are a new trader, just open your chart windo
FREE

This indicator uses Moving Average to detect markets trend. It's a very useful tool for manual trading. If line is Midnight Blue, indicator detect up trend. If line is Dark Violet, indicator detect down trend. The readings are very simple to use and understand. Indicator works best on H1 timeframe. You can use this indicator with FollowLine to have more accurate signals.
You can to get source code from here .
Parameters BarsCount —How many bars used to show the line. MAperiods —Period of Mov
FREE

S imple arrow with alert on chart. This is NOT an entry indicator but a direction indicator. It uses MACD signal line to show you possible future direction of a trend. Please use it with other filters or confirmations to trade properly. Recommended for scalping and short term trades. Made for EURUSD M5 but it should work on every major pair on M5 timeframe. For MT5 version please go here! *If you need a fully automated trading system. Please check this EA here! FEATURES: Very simple directional
FREE

A classic indicator with advanced features for more accurate display of the market situation. All settings of all moving averages are available, such as the moving average type and the priced used in its calculation. It is also possible to change the appearance of the indicator - line or histogram. Additional parameters provide the ability of fine tuning.
Distinctive features Does not redraw. Additional parameters for fine tuning. Displayed as a line or as a histogram. Works on all timeframes
FREE

The MACD (Moving Average Convergence Divergence) indicator is one of the most widely used technical analysis tools by traders worldwide. Created by Gerald Appel in the 1970s, the MACD is an indicator that helps investors identify the trend direction, trend strength, and possible trend reversal points. The MACD indicator is composed of a histogram that shows the difference between the 12-period exponential moving average and the 26-period exponential moving average. The top part of the histogram
FREE
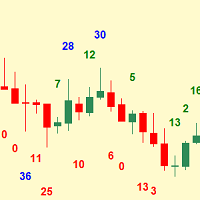
Simplest indicator for bar shadows. Very useful for Kangaroo Tail strategy.
"Shadows" - this is the distance from high and close of the bull bar and low and close of the bear bar. The purpose of the shadow is to show you if the bar is strong or not. Whether it is internal to the trend or is external. It even helps determine if a trend is starting. Input arguments: How many prevoius bars to calculate Value that should be passed to trigger the alarm How many times to repeat the alarm (Put 0 if y
FREE

This is a trend following indicator that identifies optimal entry points in the direction of a trend with an objective stop loss to manage the trade. The indicator allows you to catch trend early and ride it. The Indicator draws resistance line as it detects an Uptrend and draws support line when it detects a Downtrend on the chart. When those levels are broken, that allows you to identify the Trend Direction and Momentum in the direction of prevailing trend which offers optimal entry points in
FREE

Dieser Expert Advisor ist ein Trendfolge Roboter. Der Expert Advisor hat sehr viele Einstellungen und sollte im H1 EURUSD eingesetzt werden.
Es ist auch möglich diesen Roboter GBP zu verwenden, auch sind andere Timeframes möglich.
Nachdem sehr viele Einstellungen möglich sind, kann sehr viel getestet werden.
Ziehl ist es mit diesem Roboter langfristig erfolgreich zu sein.
FREE
This is a free plug-in for Control-adora Expert adviser. It's main function is to create a Buy Stop arrow on the chart or a Sell Stop arrow when the price crosses above or below a trend line, which will allow Control-adora expert open a new trade when the desired lines will be crossed by the price.
Settings Prefix: Write here the prefix used to identify which trend lines are subject to be watched, value "Trendline" is set by default. Always use On Close Only: When set to true (by default) the
FREE

TPP : Turning Point Pattern The indicator shows the market Turning Point Pattern as arrows. The reversal signals are based on observation of price action and market behavior. It is based on the principles of searching for extremums, volatility, and candlestick pattern. The indicator provides signals on the following principles: Search for the end of the ascending/descending trend Search for the reversal pattern based on candlestick pattern Confirmation of the reversal by the volatility. The in
FREE

The indicator helps to identify possible rollbacks and reversals. Shows the direction of the price movement and is painted in the appropriate color. Allows you to conduct trend and counter trend trading It works on all timeframes, on any currency pairs, metals and cryptocurrency Can be used when working with binary options Distinctive features Does not redraw; Simple and clear settings; It works on all timeframes and on all symbols; Suitable for trading currencies, metals, options and cryptocurr
FREE
The RSI S-RoC indicator differs from the standard RSI in that it takes into account the price rate of change when calculating values. When the price moves in a trend, the indicator produces good entry signals oncethe price touches its levels. The level values can be configured in the indicator settings. They can also be modified and adjusted directly in the indicator window. You can also set on a chart signal lines. Once they are crossed, the indicator will produce a sound alert or play a user
FREE
This indicator is a combination of classic trend indicator and signals of the slow digital filter. The indicator has no configurable parameters. The signals are displayed on completed bars and are not redrawn. It shows high efficiency on periods less than 1 hour. The usage principle is intuitive - trade in the direction shown by the fan of moving averages. Enter once the price exceeds the High/Low of the bar where the signal was formed. Exit on the opposite conditions.
FREE

Introductory Pricing for one month
Brute force trader is specially designed to find the best entry point and exit point with the regular tested and proven indicators. The EA will automatically analyse the market and will follow trends with the right entry exit points. Since the timeframe it is using is 30 minutes, the chances that you are stuck into a long trade is very low. Thought it does not use stoploss but it has t
FREE

Abiroid Multi Slope indicator allows you to calculate a Slope Histogram for any line of any indicator . Histogram is for 1 slope line only, but slope values can be calculated for 3 lines total. To have multiple histograms, add as many Slope indicators for custom indicators as you like on chart. You just need to provide the Indicator name, buffer value, slope's period and max number of bars back. By default it has slope calculation for TDI_v4.ex4 indicator. There is no way to specify parameters f
FREE
One of the standard ways to determine the direction of price movement at a particular moment is to calculate a linear regression for the values of such a price over a certain period of time. This indicator displays a line on the price chart based on the values of the linear regression of the selected price for the selected period of time. The indicator is as simple as possible and can be used within any trading strategy. The indicator is not redrawn on fully formed bars. Settings: Ind_Period - T
FREE

The EA in the form of histogram displays up and down trends. This tool is recommended to be used as a filter. Its readings will help to detect beginning, end, and continuation of a trend. This additional tool will suit any trading system. Parameters Period — indicator period; Bars — number of bars on the history.
FREE

Traditional Moving Average (SMA, EMA, SMMA, LWMA...) is very useful for identifying trends, but what will you do when you want to trade on lower timeframe, and you need to identify the bigger trend by a higher timeframe; Of course, you can make it by dividing your chart in separated windows, but your analytics will not be clear and intuitive ... That's why we build the Multi Timeframe Moving Average indicator.
With Multi Timeframe Moving Average ( MTF_Moving Average ), you can determine the M
FREE

Trend indicator Trend Esay MTF is an indicator that draws arrows directly on the price chart. Like every trend indicator, it works well with good price movement and worse in a flat. A feature of this indicator is the ability to send alerts both in the terminal and on a smartphone. The indicator menu contains the number of bars in the history of the indicator and period value for determining the trend. The "trend" function has been added to the indicator menu, which filters the indicator signals
FREE

Introduction This Indicator Is Based On Average Price/Maximum Price Moves, And Using Moving Bollinger Bands And Moving Averages.
The Advantage Of Using It With YOUR own Analysis Will Confirm Potential Supports And Resistances While it Compliments With Your Analysis
The Indicator Is Non-Repainting
AND Along With Our Special Trend METRE that Changes With The Conditions OF A Bullish Or Bearish Trend....
Recommend Time-Frames: H1 H4 M15
Usage: The Indicator Is Very Profitable I
FREE

The FxSProWPR oscillator generates signals for trend confirmation, which can also nbe used to confirm the emergence of new trends.
Indicator Parameters NumberBars - the number of bars to display the indicator. Too many bars may significantly slow down the operation of the trading terminal. SignalAlert - an Alert notifying of a trend. SignalSound - sound alert to notify of a trend. The sound will be played once the histogram exceeds the level of 15.
Rules to confirm position entry Green histo
FREE

變化率
根據公式, ROC = (Close[n] - Close[n-lookback]) / Close[n-lookback] * 100 繪製一個貨幣對價格行為在回顧期內的變化率,並提供兩個全局變量,SYMBOL_ROC 和 SYMBOL_ROC_LOOKBACK,分別代表最新的變化率值和上一個回顧期的變化率。 使用 iCustom 函數調用指標, iCustom ( "Market/RedeeCash_Rate_of_Change.ex4" , Symbol (), 5 , 0 , 0 ); 然後檢索全局變量, double roc = GlobalVariableGet ( StringConcatenate ( Symbol (), "_ROC" )); double roc_lookback = GlobalVariableGet ( StringConcatenate (Synbol(), "_ROC_LOOKBACK" )); 並執行測試以驗證趨勢, if (roc > roc_lookback && roc > 0 ) trend= "UP" ; if (r
FREE

The parabolic stop and reverse (PSAR) indicator was developed by J. Welles Wilder, Jr. as a tool to find price reversals which can be utilized as stop-loss levels as well as trade triggers. The notable difference about the PSAR indicator is the utilization of time decay. The PSAR indicator forms a parabola composed of small dots that are either above or below the trading price. When the parabola is below the stock price, it acts as a support and trail-stop area, while indicating bullish up t
FREE

"Trend Guide" is an indicator showing the trend direction based on a fast and slow moving average. Everything is simple and most importantly convenient.
Indicator Parameters :
"_fast_moving_average_period" - The period of the fast moving average;
"_ Slow_Moving_Average_Period" - The period of the slow moving average; ;
"_MA_SHIFT " - Moving average shift;
"_MA_METHOD " - Averaging method;
"_APPLIED_PRICE " - Type of price calculation;
"_line_wi
FREE
Mastery CDS is a trend indicator based on the BB Mastery Technical Analysis. This Mastery CDS indicator is specially designed for the practitioner of BB Mastery Technical Analysis. This indicator helps you to setup BB Mastery Indicators and label all the CDS signals. The CDS signals including TRZ, CT, and CC. What is so special with this indicator? This indicator able to label TRZ, CT and CC signal all all time frames. You can one glance all the signals without spending time to identify each of
FREE
Daily Average Retracement Dashboard is an indicator that allows you to monitor multiple currency pairs at one time. This indicator is mainly for strategies that trade price retracement based on Resistance 3/4 or Support 3/4. After applying this indicator to the chart window, it will hide the chart and display the currency pairs in a table form. There are several data shown on the table that will help trader know when to analyze the currency and do trade using retracement. The indicator will only
FREE
This utility automatically draws the trend channel on the price chart. For the time interval from the specified date to the current bar, the drawn channel is almost optimal. Placing the beginning of the channel at a more distant historical price extremum, you get a visualization of a longer-term trend. Channel slope is not a continuous value, but takes one of discrete values (in AxB format, where A is the number of price points (points), and B is the number of timeframes). This program works
FREE

TradingPanel X EA is a simple trading panel with some nice addons: Integrated News Feature Dynamic Take Profit Multiple Trade handling The EA has integrated dynamic Take Profit, this means, if you reach your defined TP it gives you the chance to follow on the Trend by dynamic TP & SL and extend your profits. Also a News Filter function is integrated. The EA working with real TP & SL not virtual.
Important:
Get informed about new Products, join our MQL Channel: https://www.mql5.com/en/chan
FREE

The Scaled Awesome Oscillator (SAO) represents a refined adaptation of the Awesome Oscillator, aimed at establishing consistent benchmarks for identifying market edges. Unlike the standard Awesome Oscillator, which records the variation in pips across different commodities, the only unchanging reference point is the zero line. This limitation hampers investors and traders from pinpointing specific levels for trend reversals or continuations using the traditional Awesome Indicator, a creation of
FREE

This indicator displays the moment when the DeMarker oscillator crosses its smoothed value. If the DeMarker oscillator crosses its smoothed value, it is a signal of a trend change. The signal is given after the end of the formation of the candle. The signal is confirmed when the price crosses the high/low of the bar on which the signal was given. The indicator does not redraw.
Custom Parameters: DeM_Period (>1) - DeMarker indicator period; MA_Period - period for smoothing DeMarker indicator va
FREE

The product combines the best features of the standard CCI oscillator with the adaptive digital filter. The indicator allows entering and exiting the market at the very beginning and end of a trend. The indicator generates high-probability signals while retaining high sensitivity. The indicator does not repaint on fully formed bars. Options: Ind_Price - price used for the indicator calculation; Ind_Period - indicator period. Application rules: A big red dot - a strong bearish trend, if the price
FREE
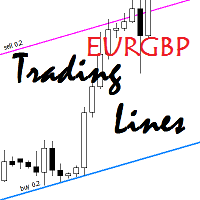
This utility is an Expert Advisor for semi-automatic trading within a price channel. It enters the market when the price crosses the channel boundary. Trend lines with a special type of description should mark the boundaries of the price channel. Trader is responsible for creating and aligning such trade lines on the required chart. The lines should be placed according to the same rules the "buy limit" and "sell limit" pending orders are placed. A trend line with a description of type "buy x" (w
FREE
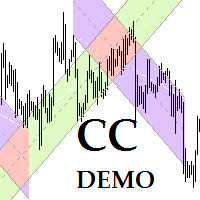
This program is for traders who plot price channels on charts. You just need to specify the width of the channel in the description of the trend line. Enter the "Description" field in the trend line properties and type canal: xxxxx without a space, where xxxxx is the width of the channel in pips. Channel color is set automatically depending on the channel width. The middle line of the channel is also automatically drawn. If the channel width is set to a positive number, the channel is drawn ab
FREE
The product combines the best features of the standard RSI oscillator with the adaptive digital filter. The indicator allows entering and exiting the market at the very beginning and end of a trend. The indicator generates high-probability signals while retaining high sensitivity. The indicator does not repaint on fully formed bars. Options: Ind_Price - price used for the indicator calculation; Ind_Period - indicator period. Application rules: A big red dot - a strong bearish trend, if the price
FREE
This indicator allows you to identify a long-term trend and shorter-term price fluctuations. Indicator signals are given only after the full formation of the bar. The indicator can be used to trade any market. The indicator showed the most interesting results on major currency pairs for time periods of one hour or more. Its basic parameters perform well in most situations. At the same time, before starting trading, you should choose the most effective indicator settings for the user's trading st
FREE

The Adaptive Moving Average (AMA), created by Perry Kaufman, is a moving average variation designed to have low sensitivity to market noise and volatility combined with minimal lag for trend detection. These characteristics make it ideal for identifying the overall market trend, time turning points and filtering price movements. A detailed analysis of the calculations to determine the AMA can be found in MetaTrader 5 Help ( https://www.metatrader5.com/en/terminal/help/indicators/trend_indicators
FREE

Based on a combination of indicators, PS Acid Fulx is an excellent indicator for knowing when to buy or sell on any asset and temporaryity. The indicator myself I have used it as a tool for my analysis when trading Forex. It is a useful and easy-to-understand trend indicator. If you combine it with your own analyses you will surely get a good result in your operation.
FREE

A ratio between 0 and 1 with the higher values representing a more efficient or trending market, It is used in the calculation of Perry J. Kaufman Adaptive Moving Average (KAMA), dividing the price change over a period by the absolute sum of the price movements that occurred to achieve that change. The Fractal Efficiency or also known as Efficiency Ratio was first published by Perry J. Kaufman in his book ‘Smarter Trading‘. This is mostly considered a filter for volatile markets none the less
FREE
Индикатор Trender определяет смену тренда. Для того чтобы её не пропустить, настройте его на отправку уведомлений в ваш мобильный терминал (Push), или в виде алерта ( Alert ), или по Email. Также индикатор предоставляет потенциальные точки входа и расчитывает и отображает уровни стоплосс и тейкпрофит.
Преимущества: - Не перерисовывается - Может помочь в фильтрации сигналов в вашей стратегии - Работает на всех парах и таймфреймах - Прост в настройке - Даёт уже готовые сигналы для открытия поз
FREE

Follow the trail of the comet to know the development of the trend. This indicator helps you to determine the evolution of the price depending on how these astronomical objects are shown in the chart. When the comet seems to stop, it opens its tails considerably and warns us of a possible change in trend. On the contrary, when it seems to get speed (looks thin because lines of tail are grouped) demonstrates safety and continuity in trend. The head or comet nucleus will show red or green accordin
FREE

Introducing Demarker Jurik—an innovative indicator poised to revolutionize your forex trading strategy. This indicator combines the precision of custom moving averages based on the Demarker indicator with the MetaTrader 4 indicator, Demarker.
Jurik moving averages are renowned for their accuracy and reliability in analyzing price movements in the forex market. They offer traders smoother representations of price action, filtering out noise and providing clearer signals for identifying trends
FREE

The VMA is an exponential moving average that adjusts its smoothing constant on the basis of market volatility. Its sensitivity grows as long as the volatility of the data increases. Based on the Chande's Momentum Oscillator, the VMA can automatically adjust its smoothing period as market conditions change, helping you to detect trend reversals and retracements much quicker and more reliable when compared to traditional moving averages.
FREE
The indicator allows you to simplify the interpretation of signals produced by the classical ADX indicator. The position of the thick bars of the histogram relative to zero and the histogram coloring indicate the direction of price movement determined by the intersection of DI+ / DI-. The position of the thin bars of the histogram relative to zero and the color indicate the strength of the price movement. A buy signal is generated when the price moves above the high of the last fully formed bar
FREE

The indicator sends a Screenshot of the chart to mail when a signal is received. It could be send from anyone timeframe and currency where installed the indicator. The indicator allows you to send messages to a mobile terminal and to mail. To send screenshots to the mail, you need the screensender.exe mail program. To create a signal, the following are used: horizontal lines / vertical lines / trend lines / Moving average.
The terminal does not allow sending screenshots to mail. Therefore, th
FREE

Fast T3 MA Trend indicator derived from T3 moving averages. This indicator is part of the T3 Cloud MA indicator and is posted here on its own. Buying/Selling opportunities above/below line. The MA line can also be used as dynamic support/resistance for more aggressive entries. Use default values for best settings. The number of look back bars is user defined. This indicator can be used in combination with other strategies such as price action. Suitable for all time frames.
FREE
"The trend is your friend, until the end when it bends". The "Hexa MA" custom indicator is a trend following indicator. It uses 6 Moving Averages to spot the trend and follow, and also to filter the bad signals for the fast Moving Averages. The basic is simple, yet the strategy is powerful.
Recommended settings for the indicator : - Moving Average periods : SMA 5, SMA 10, SMA 20, SMA 50, SMA 100, SMA 200. - Timeframe : M15 is the default. But any timeframe can be used. - Currency pair : Since
FREE

Это бесплатная версия советника, в ней отсутствуют параметры, кроме MagicNumber и советник торгует минимальным риском 1% Купить полную версию советника https://www.mql5.com/ru/market/product/32669
Trend rollback ea FREE - уникальный, полностью автоматический эксперт, для валютной пары GBPUSD Тайм фрейм M15 . Советник использует два авторских индикатора, 1 индикатор определяет направления тренда, 2 рисует канал. Советник открывает сделки, когда цена выходит за уровни канала (торговля по тре
FREE

Trend Panel Limited is an indicator that allows you to know the trend of a pair in a given timeframe using 2 moving averages. You can modify the period of the moving averages. Allows you to select which pairs you want to monitor in the input parameters. You also decide in what time period you want to follow up. In short, TrendPanel gives you the possibility of knowing the trend of a pair in a certain period of time without having to change the chart. Version limitations: You can only select 2 pa
FREE

This indicator displays the signals based on the values of the classic WPR indicator. The WPR indicator can be used for determining the overbought or oversold areas on the chart. Reaching these levels means that the market can soon turn around, but it does not give signal, as in a strong trend the market can stay in the overbought or oversold state for quite a long time. As with most oscillators, the signals are generated when leaving these areas. This indicator allows to display three types of
FREE

Introducing Austin Bands—an innovative indicator designed to enhance your forex trading strategy by applying moving averages to the MetaTrader 4 indicator, Bollinger Bands.
Bollinger Bands are a popular technical analysis tool that consists of a middle band (usually a simple moving average), an upper band (calculated by adding a specified number of standard deviations to the middle band), and a lower band (calculated by subtracting a specified number of standard deviations from the middle ban
FREE
This indicator identifies the current trend, thus allowing the trader to capture a maximum of strong price movements with pending order. The indicator settings are very simple and its application is intuitive. The line serves as a strong support/resistance level depending on its location relative to the price. Individual dots of the indicator mark short-term resistance/support levels. Place pending orders to enter the market above or below (taking the spread into account) those values. The indi
FREE

Hello everyone, this is another utility that I wrote specifically for users using my profile with a large number of experts and sets ( https://www.mql5.com/en/blogs/post/750723 ) . This utility is useful for working with a profile using grid strategies (averaging and martingale). As we know, such strategies periodically fall into a large drawdown and you need to be careful when opening averaging positions (do not open too many). In my profile, I use a limit of 3 positions for each EA, if this w
FREE

The indicator automatically calculates the balanced price value. It shows in which direction and by how much the balanced price value is currently shifted. Works on all timeframes, on any currency pairs, metals and cryptocurrencies. Can be used when working with binary options. Distinctive features Not redrawn; Simple and fast setup; Clear interpretation of readings; Works on all timeframes and on all symbols; Suitable for trading currencies, metals, options and cryptocurrencies (Bitcoin, Liteco
FREE

Using hotkeys, you can create graphic objects of different drawing styles and different colors on the active chart. You can change the formatting styles for graphics. You can choose default drawing styles, or set them in the advisor properties selection window. Going to the graph, when creating graphic objects, the color, line type and line thickness are selected automatically. Drawing styles for graphical objects will depend on the current timeframe where drawing will be performed. Please watch
FREE

Currency Strength Matrix (CSM) is an indicator that will show you the current strength of the major currencies in several timeframes allowing you to sort the currencies for strength and spot possible trading setups. This indicator is ideal for scalping and in all those events of sudden big moves. This DEMO only shows 4 currencies and 4 timeframes, for the full version please check https://www.mql5.com/en/market/product/24252
How does it work? The CSM compares the value of the current moving av
FREE

This is the author's trading system.
Designed for intraday trading. Signals are not rewritten. Suitable for any instrument and timeframe. You can enable alerts. Easy to use. See screenshots. Simple settings! Everything has already been done for you! The basis is the analysis of the current trend. The indicator is looking for a way out of accumulation. If you have been looking for a good trading system for a long time, then it is in front of you! Subscribe to my telegram channel, where we discu
FREE
RTL Map (Reference Trend Line Map) - the indicator is based on a complex of digital technical indicators described in the article by Vladimir Kravchuk: " Digital indicators in the technical analysis of financial markets ". The indicator displays buy/sell signals on the price chart for such digital indicators of technical analysis as FTLM and STLM, as well as directly the lines of digital filters RSTL, SATL, RFTL, FATL. Signals are displayed on fully formed bars and are not redrawn. It is recomme
FREE
It is the simplest indicator in existence. It has only one function: report the seconds elapsed since the last minute end in a very convenient way, with a label that can be moved in the chart, so that the trader does not have to take his eye off the forming candle. It is used on M1, but also on larger intervals, for those interested in opening/closing positions at the best time. Sometimes an intense movement in the last 10" of the minute gives indications of future trend, and can be used for sc
FREE
This indicator displays the signals based on the values of the classic DeMarker indicator on the price chart. The DeMarker indicator can be used for determining the overbought or oversold areas on the chart. Reaching these levels means that the market can soon turn around, but it does not give signal, as in a strong trend the market can stay in the overbought or oversold state for quite a long time. As with most oscillators, the signals are generated when leaving these areas. This indicator all
FREE
The indicator identifies the strength of the trend based on the points where the RSI indicator exceeds the overbought and oversold levels. The indicator does not redraw. This indicator:
Suitable for all markets; Not redrawn; Intuitive and simple; It can be useful for both beginners and experienced traders; Allows you to identify market entry points where there is a high probability of a significant price movement sufficient for a successful transaction; Settings: Ind_Period (>1) - period of
FREE

Trend directional oscillator with additional flat filtering It helps to quickly navigate when changing the direction of price movement and is painted in the appropriate color You can conduct trend and counter trend trade It works on all timeframes, on any currency pairs, metals and cryptocurrency Can be used when working with binary options Distinctive features Not redrawn; Flat filtering - when the histogram is in the yellow zone; Simple and clear settings; It works on all timeframes and on all
FREE
MetaTrader市场是您可以下载免费模拟自动交易,用历史数据进行测试和优化的唯一商店。
阅读应用程序的概述和其他客户的评论,直接下载程序到您的程序端并且在购买之前测试一个自动交易。只有在MetaTrader市场可以完全免费测试应用程序。
您错过了交易机会:
- 免费交易应用程序
- 8,000+信号可供复制
- 探索金融市场的经济新闻
注册
登录