适用于MetaTrader 4的免费EA交易和指标 - 3

Trend Lines Cross This indicator will alert you on any cross of a Trendline. You can draw up to two trend lines and form a channel, a pennant , a triangle or a simple trend and when the price crosses either trend line the indicator will provide you with alerts that you define plus an up or down arrow when the cross happened. How to: Draw the 1st trendline and name it tl1. Draw the 2nd trendline and name it tl2. Select which type of alerts you would like in the indicator properties and you a
FREE
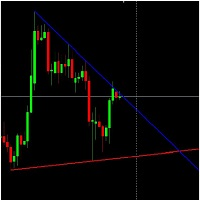
Standard Trend Lines (Automatic).
This indicator draws highly accurate trend lines.
It draws Trend Lines automatically.
This Trend Lines indicator was made by observing lot of discussions made about Trend Lines in forum.
The Trend Lines can also be used to create Expert Advisor.
Latest valid Trend Lines are drawn on Chart.
Trend Lines Work on basis of OHLC price data.
FREE

Gold TL MTF - this is a fine stock technical indicator. The indicator algorithm analyzes the movement of the asset price and reflects trend lines along the fractals of a specific timeframe (TF).
Benefits of the indicator: The indicator produces signals with high accuracy. The confirmed signal of the indicator does not disappear and is not redrawn. You can trade on the MetaTrader 4 trading platform of any broker. You can trade any assets (currencies, metals, cryptocurrencies, stocks, indices
FREE
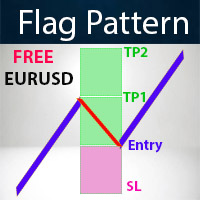
It is FREE on EURUSD chart.
All Symbols version! Contact me for any questions introduction A flag can be used as an entry pattern for the continuation of an established trend. The formation usually occurs after a strong trending move. The pattern usually forms at the midpoint of a full swing and shows the start of moving. Bullish flags can form after an uptrend, bearish flags can form after a downtrend. Flag Pattern Scanner Indicator It is usually difficult for a trader to recognize classic p
FREE

"Five Minute Drives" indicator that is designed to be used in the 5 minute timeframe. One of its most important advantages is that it shows the general trend in the upper time frames when looking at the 5-minute timeframe. Therefore, when opening positions in the 5 minute timeframe, when it is in line with the trends in the upper timeframes, you are less likely to be upside down. If you can evaluate breakout/breakdown opportunities between the curves on the graphic screen with your geometric per
FREE
This expert advisor trades using the Bollinger Trend Indicator, and implements many other useful features for the exigent trader, like customizable trading sessions and days, several trading behaviors and a martingale mode. [ Installation Guide | Update Guide | Troubleshooting | FAQ | All Products ] Easy to use and supervise Customizable trading direction Customizable indicator settings Customizable break-even, SL, TP and trailing-stop Built-in money management Works for ECN/Non-ECN brokers Work
FREE

This indicator calculates buy and sell signals by using MACD indicator on two timeframes. MACD is a trend-following showing the relationship between two moving averages of the closing price. The MACD is calculated by subtracting the 26-period Exponential Moving Average (EMA) from the 12-period EMA.The result of that calculation is the MACD line. A nine-day EMA of the MACD called the "signal line".
This indicator has 2 modes to calculate the buy/sell signals: - MACD crosses 0 line - MACD cro
FREE

"Quantum Casper" - Your Ultimate Scalping Trading Companion!
Since its inception in 2024, "Quantum Casper" has skyrocketed to fame, garnering over 20.000 downloads worldwide. Join the ranks of satisfied traders and experience the difference for yourself. Download "Quantum Casper" now and elevate your trading to new heights! Seeking an advanced EA that consistently delivers outstanding results? Your search ends here! Gain access to "Quantum Casper" now on the market for FREE worldwide: [ http
FREE

See RSI values turned into colored candles
This indicator provides both colored candles and a colored moving average. 6 drawaing styles are provided to allow customization of the color coding.
Applying coding to the chart may help in conceptualizing price trend and impulse movements defined through RSI values.
Features - optional colored candles - optional colored ma - 6 draw styles; RSI slope RSI above/below overbought/oversold levels RSI above/below level 50 RSI above/below it's moving aver
FREE
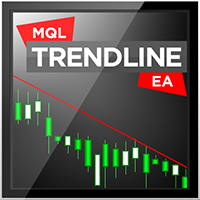
Summary This EA will trade semi-automatically based on trend lines or horizontal lines that are manually plotted on the chart by the user. It can handle any number of lines per chart and each line can have its own adjustable settings. This EA manages every line separately based on specific user 'keywords' set for each line. Since each line has it's own independent settings, this is why there are very few shared inputs in this EA. Doing it this way allows for a single EA to manage many lines and
FREE
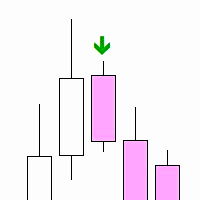
"Inside Bar PA" is a technical indicator designed to determine the inner bars on the chart. An internal bar is a bar or candle, the maximum and minimum of which are completely contained in the previous bar. This may signal a potential reversal or continuation of the trend, depending on the context.
Features: Automatic detection of internal bars. Visual marking of internal bars with arrows on the chart. The ability to adjust the distance of the mark from the bar. How to use: Attach the indicat
FREE

The Trade by levels indicator is designed to automatically determine the formation of a model for entering the market on the chart of the selected instrument.
Definitions: ⦁ BFl is the bar that formed the level. ⦁ BCL1 and BCL2 bars, confirming the level.
The graphical model: ⦁ levels high\low the bars BFL and BCL1 must match the accuracy to the point ⦁ there can be any number of bars between BFL and BCL1. ⦁ between BCL1 and BCL2 intermediate ba
FREE

*This is TradingView indicator converted to mql4*
The SuperTrend V indicator is a popular technical analysis tool used to identify trends and potential trend reversals in financial markets. It is based on the concept of the SuperTrend indicator but incorporates additional features and variations. The SuperTrend V indicator uses a combination of price action and volatility to determine the trend direction and generate trading signals. Here are the key components and features of the indicator:
FREE

This is the free version of the Supply&Demand + Trendline + Trend tool. This version works only with EURCHF! You find the full version here: https://www.mql5.com/en/market/product/67274
PAAIOS stands for Price Action All In One Solution. And that is the purpose of the Indicator. It should give you a tool to improve your trading decisively because you get the crucial information at a glance. The indicator simplifies the search for strong signals. It shows trend lines, demand and s
FREE
Этот индикатор является уникальным в своём роде, больше всего подходит для скальпинга на XAUUSD а также для торговли на более старших таймфреймах!
Уведомление сообщит самые важные точки входа, поэтому следует торговать по тренду. Идеален для скальпинга! The Best Trend Signals - трендовый мультивалютный индикатор, может использоваться на любых финансовых инструментах валюта, криптовалюта, металлы, акции, индексы. Рекомендуемый тайм-фрейм M15, M30, H1, H4, D1.
Как торговать с помощью индикат
FREE

Tipu Trend is a non-lag, non-repaint, smart indicator, that shows the trend of selected time frames.
Features Customizable Buy/Sell alerts, push alerts, email alerts, or visual on-screen alerts. As easy to trade indicator that smooths the noise in the price action. Highlights ranging markets. Add Tipu Panel (found here ) and unlock the following additional features. An easy to use Panel that shows the trend + signal of the selected time frames. Customizable Panel. The panel can be moved to any
FREE

Update: For those who want to manually backtest this indicator, check this tool https://www.mql5.com/en/market/product/59248
The indicator will help make your calculation of stop loss easier as it will be visually aiding you in choosing where to put your stoploss level on the chart by calculating the current value of ATR indicator. For those who are unfamiliar with ATR, it is a useful indicator to calculate stoploss for trend following strategy. If volatility is high, ATR stoploss level will b
FREE

This indicator is a simple trend line indicator.
The upper trend line is the highest price of 60 past candlesticks, the highest price of 30 past candlesticks,
The bottom line is the trend line that connects the lowest price of 60 past candlesticks and the lowest price of 30 past candlesticks.
*The color of the trend line is white.
Notes
This indicator is created with the above configuration, so if the highest and lowest prices of the past 60 candlesticks and 30 candlesticks are the s
FREE
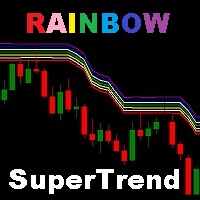
Super Trend is one of the most popular custom indicators that it doesn't provided in metatrader 4 (MT4) platform. Rainbow SuperTrend has some advantages, there are can display the trend direction and stop loss line based on Average True Range (ATR). This indicator is good to used for trailing stop trading style, because when the price direction is trending the stop loss point can adjust based on supertrend line. It is the high recommended to using this indicator combined with oscillator indicat
FREE

This indicator is based on Guppy's GMMA Strategy. And shows arrows when GMMA lines cross up or down. To have this indicator and get alerts for Multiple Timeframes and multiple Pairs you can check out the demo of this GMMA Trend Scanner indicator: https://www.mql5.com/en/market/product/38747
About GMMA In Brief:
GMMA attempts to identify trends by combining two groups of moving averages with differing time periods: The long-term EMAs (30, 35, 40, 45, 50, and 60) the behaviors of investors that
FREE

Head and Shoulders Pattern Indicator - Your Key to Recognizing Trend Reversals Unlock the power of pattern recognition with the "Head and Shoulders Pattern Indicator." This cutting-edge tool, designed for MetaTrader, is your trusted ally in identifying one of the most powerful chart patterns in technical analysis. Whether you're a novice or an experienced trader, this indicator simplifies the process of spotting the Head and Shoulders pattern, allowing you to make informed trading decisions. Key
FREE

The Supreme HmaSignal indicator is an indicator for trend trading , its main character is the hull moving average colored line , and secondary is buy and sell arrows , arrows are fair but the main focus is on the colored hma , this indicator does not repaint or back paint or delay its signals. if you like this indicator please check my Supreme Trendhisto: here , and my Supreme Diamond indicator : here
Parameters: HMA Period HMA Smoothing HMA Price (close/open) Signal Period (Arrows)
FREE
MACD Trend EA is based on the popular forex indicator MACD (Moving Average Convergence Divergence). It is fully automated trading expert advisor and completely FREE! As the name suggests, this expert advisor uses a trend-following strategy and uses the MACD indicator to detect the beginning of uptrends and downtrends.
MACD Trend EA Top Features - Trend Following Strategy - Money Management - Advanced Exit System + TP and SL - Trailing Stop System - Broker protection System - Custom Magic
FREE

What is Ikoku Kairi Band?
It is an oscillator indicator that combines Kairi Relative Index with Bollinger Band and displays signals with possible position entry points. It is meant to be used to trade against the trend, so it is perfect for scalping in a range market. It shouldn’t be used in a trend market. It will display arrow signals at possible entry points for buy and sell position. You can be notified when they appear with, push, alert or email notifications. You can customise the indica
FREE

实施一种稳健的策略通常被证明是一项具有挑战性的任务。我们理解您的时间宝贵,这就是为什么我们推出“ Diamond Hedge Pro ”的原因。这一革命性的解决方案提供了一种成功的策略,让您在享受成功的同时,无需花费数小时监控图表的负担。
重要!购买后请立即与我联系,我将为您提供我使用的参数!
它是如何工作的? 设置您的交易通道并选择所需的倍增器。当市场达到通道限制时,EA开始运行。无论运动方向如何,都会以预定义的止盈和止损水平开启交易。在市场保持在设定的通道内时,“ Diamond Hedge ”通过低买、高卖和累积利润运作。当市场趋势并离开通道时,EA会节制自己,在稳定恢复时重新开始操作,采用对冲机制以保持交易为正。 通过战略性过滤器优化性能 为了进一步提高EA的性能,我们已经加入了关键的战略过滤器。时间过滤器将EA的活动限制在一天中的特定时间,增加了利润潜力。这些过滤器共同精炼“ Diamond Hedge ”策略,确保它调整得以在市场中最大程度地把握机会。
为什么应该购买这个EA? 验证过的策略:该EA融合了一种经过开发和测试以利用市场波动的成功策略。在各种条件下获
FREE

The indicator builds a Renko chart in the sub window for the current symbol. The bars are formed from live data and the desired bar size can be set in the inputs tab. Most importantly, because the Renko chart only uses price to construct bars and ignores time, the indicator can be applied to any time frame and same results can be achieved. Recommended usage
As Renko charts are famous for eliminating noise so traders can use this tool to see clear picture of the trend to help their analysis, ent
FREE

The indicator looks for consolidation (flat) in the market at a certain time, builds a box-channel and marks levels indented from it for a breakdawn. After crossing one of the levels, the indicator marks the zone for take profit and calculates the corresponding profit or loss in the direction of this entry on the panel. Thus, the indicator, adjusting to the market, finds a flat area of the market, with the beginning of a trend movement to enter it. Version for MT5: https://www.mql5.com/en/market
FREE

This comprehensive technical indicator calculates and plots up to 3 moving averages with 3 different periods. By employing three moving averages of distinct lookback periods, the trader can confirm whether the market has indeed experienced a change in trend or whether it is merely pausing momentarily before resuming its prior state. SX Golden MA Pack for MT5 is available here . The shorter the moving average period, the more closely it tracks the price curve. When a security initiates an upt
FREE

智能趋势过滤工具适用于MetaTrader 4 (MT4)
该工具旨在确保在MetaTrader 4 (MT4)中运行的任何专家顾问(EA)仅开设与当前市场趋势一致的头寸。它通过分析一个或多个图表的趋势,将趋势信息写入文件,并应用特定模板(上升趋势使用SMARTLONG.tpl,下降趋势使用SMARTSHORT.tpl)来工作。该工具在后台持续循环运行,每次趋势变化时都会调整模板。
功能
多图表趋势分析: 该工具可以同时分析一个或多个图表的趋势,提供市场的全面概览。
趋势确定: 趋势是根据两条移动平均线(MA)的交叉来确定的。用于确定趋势的具体移动平均线可以在设置中配置。
模板切换: 根据确定的趋势,该工具在两个预定义模板之间切换: SMARTLONG.tpl: 当趋势上升时应用。 SMARTSHORT.tpl: 当趋势下降时应用。 这确保了EA只会开设符合当前市场趋势的头寸。
可配置参数: 时间框架: 用户可以选择工具用于趋势分析的时间框架(例如,M1,M5,M15,H1)。 移动平均线: 用户可以指定用于确定趋势的移动平均线。 循环间隔: 用户可以设置工具
FREE
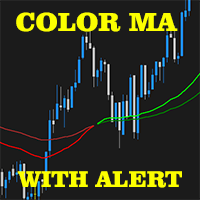
2 EMA Color Alerts Indicator is a powerful tool for any trader looking to stay on top of market movements. By using exponential moving averages (EMAs), this indicator can provide early warning signals for potential market reversals and trend changes. One of the key features of the 2 EMA Color Alerts Indicator is its customizable alerts. With this feature, traders can set their own parameters for receiving alerts, such as the EMA periods and the type of alert (e.g. sound, pop-up, email). This al
FREE

This is an implementation of the well known SuperTrend Indicator. With this indicator you can see exactly the same values which will be alerted by the following SuperTrend Scanners:
SuperTrend Scanner SuperTrend Scanner FREE
Parameters SuperTrendATRPeriod: the period setting for the calculation of the SuperTrend SuperTrendMultiplier: the multiplier setting for the calculation of the SuperTrend
FREE

COLORED TREND MA / MACD CANDLES draw MA Candles above/below Moving Average in a single color draw MA as a leading Line like a Supertrend draw MA as a Channel => MA High and Low draw MACD Candles above and below 0 and Signal-Line
Your Advantage: a simple view of the trend direction a simple view over the higher trend direction a calmer chart for the eye clear rules can be defined Settings: Bars to process : 6000 is my default, this value is up to you Value Quick-Set : pre-Settings MACD 12 / 26
FREE

Introducing the TrendSurfer Collection: Ride the Waves of Forex Success
Are you tired of navigating the unpredictable waters of the forex market alone? Do you wish there was a way to surf the waves of currency trading with confidence and ease? Look no further than the TrendSurfer Collection—a revolutionary automated trading system designed to turn the tide in your favor.
TrendSurfer Collection gives you free access to one of the many profitable Expert Advisors from my TrendSurfer series.
FREE
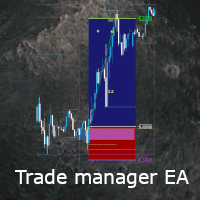
This EA is a free part of Flexible Trade Manager Indicator - Buy it here (It will not work without it) Flexible trade manager is a simple and effective trading tool for setting new order by pressing B as Buy or S as Sell on keyboard. All with ability to see additional characteristics before opening with predefined risk and observation of the risk and potential profit. Set and manipulate order levels straight from the charts or or place them right as pending orders.
Additional buttons hel
FREE

This Dashboard is free to download but is dependent on you owning the Gold Pro MT4 indicator. Get the indicator here: https://www.mql5.com/en/market/product/60430
The Dashboard will show you on a single chart all the timeframes (M1 to Monthly) with their own status for the indicator: Gold Pro MT4
all time frame and all symbol: smart algorithm detects the trend, filters out market noise and gives entry signals!!!
How to understand the status: Dashboard Show "Buy" - Buy Signa
FREE

CyberZingFx Trend Reversal Indicator - your go-to solution for accurate and reliable trend reversal signals. With its unique trading strategy, the indicator offers you Buy and Sell Arrow signals that do not repaint, making it a reliable tool for catching Swing Highs and Swing Lows.
SCROLL DOWN TO VIEW SCREENSHOTS AND WATCH VIDEO ________________________________________________________________ Trading using CyberZingFx Trend Reversal is Simple Using the CyberZingFx Trend Reversal Indicator is e
FREE

DONCHIAN CHANNEL DC It is a trend indicator developed by “Richard Donchian”, consisting of 3 layers, the upper channel, the lower channel and the middle channel. It is created on the Donchian Channel by plotting the highest and lowest prices reached in the past period on the price chart. It is also used to measure the volatility of the market, as it is an expanding/contracting channel according to the increase/decrease of price volatility. Method 0; Donchian channel indicator drawing. BUY/SELL S
FREE

Tired of plotting trendlines? The PZ TrendLines indicator applies a mechanical approach to the construction of trend lines for you! [ Installation Guide | Update Guide | Troubleshooting | FAQ | All Products ] It can draw up to 18 trendlines Trendlines can be optionally based on fractals Each line represents a breakout level Each trendline can be broken or rejected Configurable amount of lines Configurable colors
Support I am happy to provide free products but given my limited time, they come
FREE

该指标分析分形的价格结构并确定市场动态的可能反转点。与其他类型的指标结合使用时非常完美。
好处:
适用于所有仪器和时间序列, 不重绘结果, 指示器元素的可定制颜色, 适用于任何趋势策略, 调整分形的强度。
MT5 version -> HERE / Our news -> HERE
Strategy:
AW Flexible Fractals is an indicator that indicates signals not instantly, but with a delay, due to the structure of the fractal.
To detect a signal in the " Number of candles on each side of the fractal " variable, you can adjust the number of bars on each side from the central point of the fractal. In the default settin
FREE
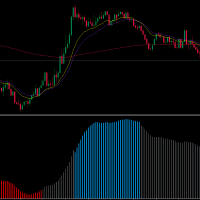
Welcome traders, MA SLOPE SCALPER is a really powerfoul tool to boost up your scalping! Have you been struggling with your scalping Strategies? Have you tried price action? Well, it does not work. Have you tried Rsi - Reversal Strategies? Well it'is not a clever idea. MA SLPOPE SCALPER IS A TREND FOLLOWER SYSTEM MA SLOPE SCALPER is based upon 3 different Exponential Moving averages that have bees studied and selected in order to maximize the precision of the signals! Ma SLOPE SCALPER has an
FREE

This Indicator was used on EA Advanced Fibo levels . Indicator is designed to trade for most popular Fibonacci strategy that's completely automated. It automatically identifies and show Entry levels included Support/ Resistance Zones , according to the time zone candle by Fibonacci levels. As well as the traditional Fibonacci tool also included. However, it is very user friendly rather than default available one. On the other hand one more tool included. It automatically identifies real Suppo
FREE

M1Arrows is a MT4 trend arrows Indicator
* Smart Scalper Setup (M1) :: Signal 5 Main 20 + Signal 20 Main 80 + Fibonacci ZigArcs 20
(Screenshot1) Add the indicator with first setting,
then add it again to the same graph with other settings.
You can add as many as you want, but 2 M1Arrows in just one graph is enought
Never open orders againt the slow setting trend
Do not open more than 3 orders per slow setting trend
It will work better in Europe/USA markets, * M15 Day Trade Setup: Sig
FREE
Algorithm EA,or double hedge EA is your tool by using a double hedging mechanism. The EA open a trade in a trending market - no matter which direction.You can set also Tp and SL, but it is not needed,because of basket profit and amounth of opened position,which you can preselect and fit to your deposit.Min deposit is about 1000 $,0.01 Lot recomended.
This EA uses a hedging technology In case the market moves in the unfavorable direction, the EA starts hedging your trade by placing an opposite
FREE

Pivot Classic, Woodie, Camarilla, Fibonacci and Demark
Floor/Classic Pivot points, or simply pivots, are useful for identifying potential support/resistance levels, trading ranges, trend reversals, and market sentiment by examining an asset's high, low, and closing values. The Floor/Classic Pivot Points can be calculated as follows. Pivot Point (P) = (High + Low + Close)/3 S1 = P * 2 - High S2 = P - (High - Low) S3 = Low – 2*(High - P) R1 = P * 2 - Low R2 = P + (High - Low) R3 = High + 2*(P -
FREE
This indicator is a classic indicator of technical analysis - MACD. Unlike the classic MACD indicator, the presented indicator is calculated as follows: - the first smoothing signal is one of the standard methods used to create moving averages. - secondary smoothing method used in MAMA/FAMA indicators. - calculation of the difference between MAMA/FAMA values.
The indicator gives signals about a change in trend direction, as well as signals about weakening or strengthening of the trend. The ind
FREE
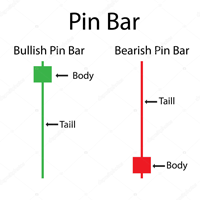
Pin bar pattern is characterized by a long upper or lower wick with a small body relative to the size of the wick with little to no lower or upper shadows. Pin bars are not to be traded in isolation , but need to be considered within the larger context of the chart analysis. A pin bar entry signal, in a trending market, can offer a very high-probability entry and a good risk to reward scenario.
Inputs MinimumTailPips- Minimum size of Tail in pips; TailBodyCandle- means how many times Tail gre
FREE

Welcome to the Forex Gold Angel EA , which is a highly stable profit-generating EA. It comes highly recommended. The logic behind the EA is simple. It uses the BAND indicator, which triggers a flag when the price deviates from the band. However, it does not enter a trade at this point. Instead, it carefully monitors the price movement. When the price returns to the band and touches the center line, it enters a trade in the direction of the trend. This strategy is simple, but it yields significan
FREE

A trend indicator showing the strength of bulls and bears in a trading range.
Consists of two lines:
The green line is a balanced overbought/oversold condition. The red line is the direction of trading activity. Does not redraw calculations.
Can be used on all Symbols/Instruments/Time Frames.
Easy to use and set up.
How to use the indicator and what it determines.
The basic rule is to follow the direction of the red line:
if it crosses the green line from the bottom up, the market i
FREE

Price Channels are also known as Donchian Channels being named after Richard Donchian. They use the highest and lowest price of a set number of periods to create an upper and lower channel or envelope around the price. The upper channel shows the high of the number of periods chosen. The lower channel shows the low of the number of periods chosen. For example, the screenshot shows the Price Channels using 320 periods. The upper channel in the screenshot shows the highest high of the previous 3
FREE

AdvaneZigZag Indicator
Are you tired of the limitations of the traditional ZigZag indicator? Meet AdvaneZigZag, the ultimate tool to simplify your market structure analysis and enhance your trading strategies. Designed with flexibility and precision in mind, AdvaneZigZag brings you advanced features to navigate the market with confidence.
Key Features:
1. Enhanced Flexibility:
- While maintaining the familiar simplicity of the conventional ZigZag indicator, AdvaneZigZag offers superi
FREE

Just another plain Super Trend indicator.
On this one i have added another buffer (on index 2) which can be used on EA; the values is -1 to identify a bearish trend while for bullish trend the value is 1.
Here a code snippet:
int trend = ( int ) iCustom ( NULL , Timeframe, "SuperTrend" , Period , Multiplier, 2 , 1 ); It work on every timeframe.
If you need help to integrate it on your EA, don't hesitate to contact me.
FREE

The indicator synchronizes eight types of markings on several charts of one trading instrument.
This indicator is convenient to use in conjunction with "Multichart Dashboard" or other similar assistant that allows you to work with several charts at the same time.
"Multichart Dashboard" can be found under the link on my youtube channel.
Settings:
enable vertical line synchronization
enable horizontal line synchronization
enable Trend Line synchronization
enabling Fibonacci Retracement
FREE

This indicator lets you easily mark the daily open levels on a chart with several possibilities of customization. For many trading strategies, the daily open level is an important level to base trading decisions on. That is why I chose to create this indicator that is designed to assist you with trading these strategies, as well as further optimizing them and getting a general understanding of the markets movements. With this tools help, you can easily take a look at the previous price action ar
FREE

Expert description
Algorithm optimized for Nasdaq trading The Expert Advisor is based on the constant maintenance of long positions with daily profit taking, if there is any, and temporary interruption of work during the implementation of prolonged corrections The Expert Advisor's trading principle is based on the historical volatility of the traded asset. The values of the Correction Size (InpMaxMinusForMarginCallShort) and Maximum Fall (InpMaxMinusForMarginCallLong) are set manually.
Recom
FREE

This indicator identifies swing highs and swing lows in the price chart by comparing the Highs and lows of each candle to a specified number of candle before and after it. Once it has identified the swing highs and swing lows, it can use them to determine potential support and resistance levels. A support level is formed when the price drops and bounces back up from a swing low, indicating that there is buying pressure at that level. A resistance level is formed when the price rises and reve
FREE

This indicator is the converted Metatrader 4 version of the TradingView indicator "ATR Based Trendlines - JD" by Duyck. This indicator works by automatically and continuously drawing trendlines not based exclusively on price, but also based on the volatility perceived by the ATR. So, the angle of the trendlines is determined by (a percentage of) the ATR. The angle of the trendlines follows the change in price, dictated by the ATR at the moment where the pivot point is detected. The ATR percentag
FREE
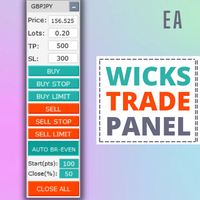
Wicks Trade Panel It's a Trade Panel include Order Management & Risk Management for serious trader. Especially for those traders who pay attention to important events like the CPI, NFP, and ADP. A one-of-a-kind faster technique to fix the Entry Price by simply pointing the mouse pointer at it. This is what I enjoy about it. Automatically closing 50% order size lots when setting TRUE on Breakeven Status. It's especially useful when trading on significant economic events like the CPI, NFP, and A
FREE

Download the free USDJPY version here.
MACD Indicator The Moving Average Convergence and Divergence (MACD) is a trend following momentum indicator which shows the relationship between two moving averages that we chose and configure them on the indicator. The MACD is calculated by subtracting the 26-period exponential moving average and the 12 period D.A.M. These are the default parameters when you put the MACD indicator on the charts, and the period is usually 9 which means the last 9 candle
FREE
HMA Grid EA is a grid system which analyzes trend based on the Hull Moving Average (HMA) indicator. Unlike the Simple Moving Average (SMA) the curve of HMA attempts to give an accurate signal by minimizing lags and improving the smoothness. This EA proposes two trading strategies which combine a slow period HMA to identify the main trend and a short period HMA to identify short trend reversal movement. This combination make usually sell and buy signals accurate and in case if the trend reverse w
FREE

Advanced trend is a most powerful indicator which provides signal based on trend moving. There is a 2 Signal mode. One Provide Early Signal and Another Provide Permanent. You guys use default settings without any changes.
There is a option called candle shift. And default setting is 1 which provides early signal and might be repaint but if you change the value and use 2 then it will gives you permanent. You guys go play around with this. Except that there is nothing you guys worry about.
On
FREE

The indicator displays overbought and oversold levels, calculating them using the Fibonacci golden ratio formula.
It enables both trend-following and counter-trend trading, accommodating breakouts and rebounds from these levels.
It operates on all timeframes, across various currency pairs, metals, and cryptocurrencies.
Suitable for binary options trading.
Key Features: Based on the Fibonacci golden ratio Shows overbought and oversold levels Suitable for market and pending orders Sim
FREE

The arrows of the indicator used on the chart indicate trading signals in trend following. You can find the indicator in the comments. My trading signal is generated when the indicated arrow direction changes. A trade is then kept open until the arrow direction changes again. If the arrow then changes in the opposite direction, the previous position must be closed and a new one opened in the current arrow direction. I have also added a SL/TP, a trailing stop and a time filter. I recommend using
FREE

TwoMA Crosses indicator displays arrows based on whether the short term moving average crosses above or below the long term moving average. A moving average doesn't predict price direction. Instead, it defines the current direction. Despite this, investors use moving averages to filter out the noise. Traders and investors tend to use the EMA indicator, especially in a highly volatile market because it’s more sensitive to price changes than the SMA.
Download for FREE TwoMA Crosses EA from th
FREE

EA PROMO EXPIRED 2022.12.12 (12 December 2022)......!!!!
.... NEW VERSION WITH 6 INDICATORS SETTING ON OR OFF (MA,RSI,CCI,MACD,STOCHASTIC,PARABOLIC SAR).... Automatic EA (With 6 indicator setting TRUE or FALSE) Manual trade (Buy,Sell,Trailing stop,Close buy,Close sell,Close profit,Close all) Local copy trading Full Panel indicators (SnR,Fibonacci,Currency strength,trade panel) Push notification,email,STP ALLINONE EA (All strategy in one EA) Hedging (on/off),martingale (on/off),anti martingal
FREE

Display rectangles and trendlines list from Trading box Technical analysis tool. Objects are ordered in the list by pip distance that is difference between object price and Bid price. With this tool you will know which chart to look for next trading opportunity. No more switching between charts and searching for trades where price is close to rectangle zone or trendline support resistance level. Sorted Rectangles and Trendlines by pip distance - If you are trading on multiple charts, then th
FREE

This MT4 EA is designed to trade based on market trends, candlestick patterns, and Bollinger Bands (BB), incorporating stop-loss (SL) and take-profit (TP) for each position and a mechanism to open trades in the opposite direction when trends reverse.
It uses indicators like Moving Averages (MAs) to identify market trends.
It identifies specific candlestick patterns that indicate potential trade entries.
It uses Bollinger Bands to determine overbought or oversold conditions, enhancing entr
FREE

A forex pivot point strategy could very well be a trader’s best friend as far as identifying levels to develop a bias, place stops and identify potential profit targets for a trade. Pivot points have been a go-to for traders for decades. The basis of pivot points is such that price will often move relative to a previous limit, and unless an outside force causes the price to do so, price should stop near a prior extreme. Pivot point trading strategies vary which makes it a versatile tool for
FREE

The MACD Signal Candle indicator changes color according to the MACD trends. Colored Candles, based on MACD.
HOW IT WORKS
For a Buy: -If the indicator is above zero, the market is bullish. -If the market is bullish, you can take a stand with green candle signals. For a Sell: -If the indicator is below zero, the market is bearish. -If the market is bearish, you can take a stand with the red candles.
FREE

The Smile Clone EA combines trend following and grid trading strategies to maximize profitability and manage risk. It involves the following key steps:
Trend Detection: Utilize technical indicators such as Moving Averages (MAs) to determine the market trend. An uptrend is identified when the current price is above the MA, and a downtrend is identified when the current price is below the MA.
Grid Setup: Based on the detected trend, set up grid levels at fixed price intervals (e.g., every 1
FREE

Whether trading stocks, futures, options, or FX, traders confront the single most important question: to trade trend or range? This tool helps you identify ranges to either trade within, or, wait for breakouts signaling trend onset.
Free download for a limited time! We hope you enjoy, with our very best wishes during this pandemic!
The issue with identifying ranges is some ranges and patterns are easy to miss, and subject to human error when calculated on the fly. The Automatic Range Identi
FREE
MetaTrader市场是您可以下载免费模拟自动交易,用历史数据进行测试和优化的唯一商店。
阅读应用程序的概述和其他客户的评论,直接下载程序到您的程序端并且在购买之前测试一个自动交易。只有在MetaTrader市场可以完全免费测试应用程序。
您错过了交易机会:
- 免费交易应用程序
- 8,000+信号可供复制
- 探索金融市场的经济新闻
注册
登录