指定
Hi, I am having a trading strategy in which I believe or at least hope someone could help me build a robot. The strategy is very simple, but it is very time consuming, because I need to babysit every investment, which I do not have time to do as I am not a professional full time trader.
So in the following I will outline my strategy and hopefully this will be information which you can use to see if this is possible or at least interesting.
Strategy:
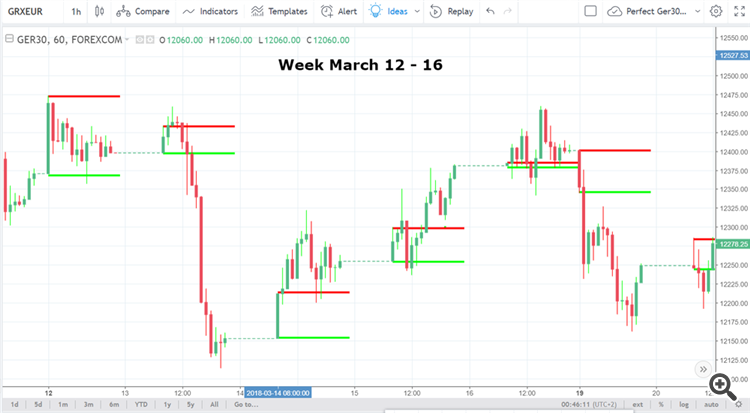
Ger30 1h candle chart
The first thing I always do is to draw the daily support and resistance level for myself. These levels are based on the first trading hour. After the 8am candle close i gonna draw the support level (green) and the resistance level (red). This is my basic which I need to have to get my entry and exit points.
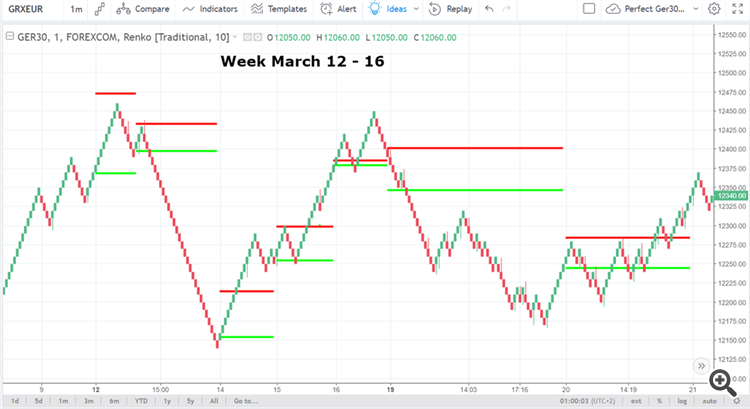
The next chart i am looking at is the renko chart
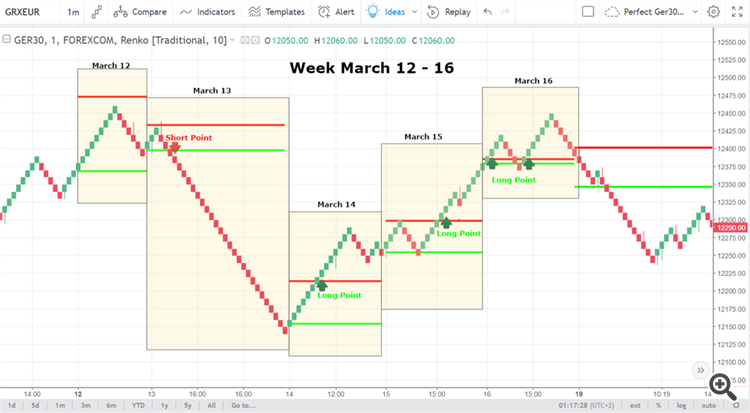
Entry Point
So how and when do we enter the trade. As you can see i have pointed the entry`s. We are always going to enter the position if we have crossed our daily support (green) and resistance (red). But carefully a cross dosent mean we gonna entry instantly !! We are waiting for a confirmation. Our confirmation is a brick wich is fully closed outside the level. Fully closed means the whole brick is outside and dosent cross or touch the level. If this is the case we gonna enter our trade. If we are crossing the support (green) and have a confirmation brick we go for a short (sell) position and if we cross the resistance (red) we go long (buy).
There might be days without a trading signal like in this example on march 12. If this is the case we stay away for this day.
Exit Point
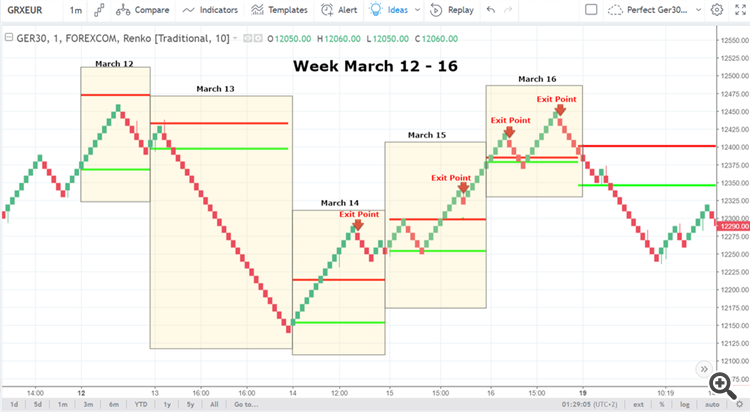
Here on the chart above you can see our exit points. As you can see we are always going to close a trade if we have a negative brick. Wich means if we are in a long (buy) trade and we have the first red brick closed we gonna close the trade and take the profit. Sometimes we are grinding the whole day on our trade like it was on match 13. If this is the case we always gonna close the trade at the end off the trading day wich is 21:45 (22:00 closing time). There might be some cases where we have just one red brick and then we continue going up like on march 15. But in this case we have some reEntry points which I gonna explain just in the next chart.
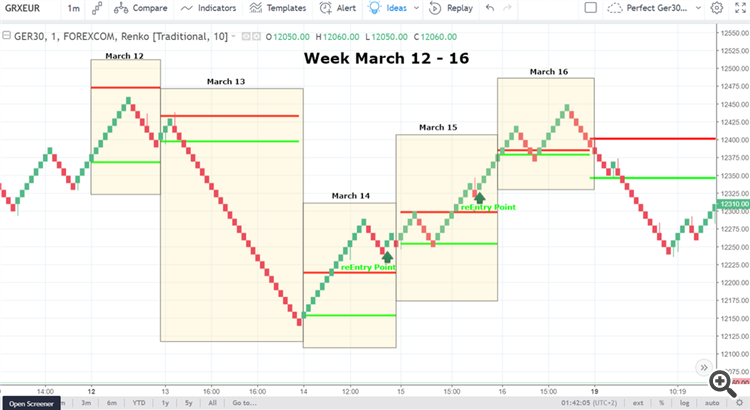
reEntry Points
As I already told on the "exit point" chart there are some reEntry points. On the chart above you can see these points. We gonna reEnter a trade always if we have a green brick closed after we had a "exit point" and we are still above our resistance (red) level or below our support (green) level. If we are still above or below these levels it dosent matter if we have only one "exit point" or a "exit point" followed by some more bricks. So as you can see in the example above we had one reEntry on march 14. and one on march 15.
I am using Tradingview to provide me with charts. My current broker is Etoro. How to connect the robot with charts and broker I need help from you to suggest. It is also important that the robot gives the possibility to invest with leverage like 10,25,50 and 100. Probably the broker chosen will be the guidance of this. Further the amount invested must also be possible to choose.
When looking at the charts with RENKO it must be at 3 minutes chart, and the "box size" shall be 10 and the "box size assignment method" shall be "Traditional", not ATR.
Hopefully this is enough to get started. I will set the fix price to 30 USD but this is obviously something we need to discuss. THe robot also needs to pass through some sort of a test period to see that it works OK.
Best regards Erik
