指定
Hello,
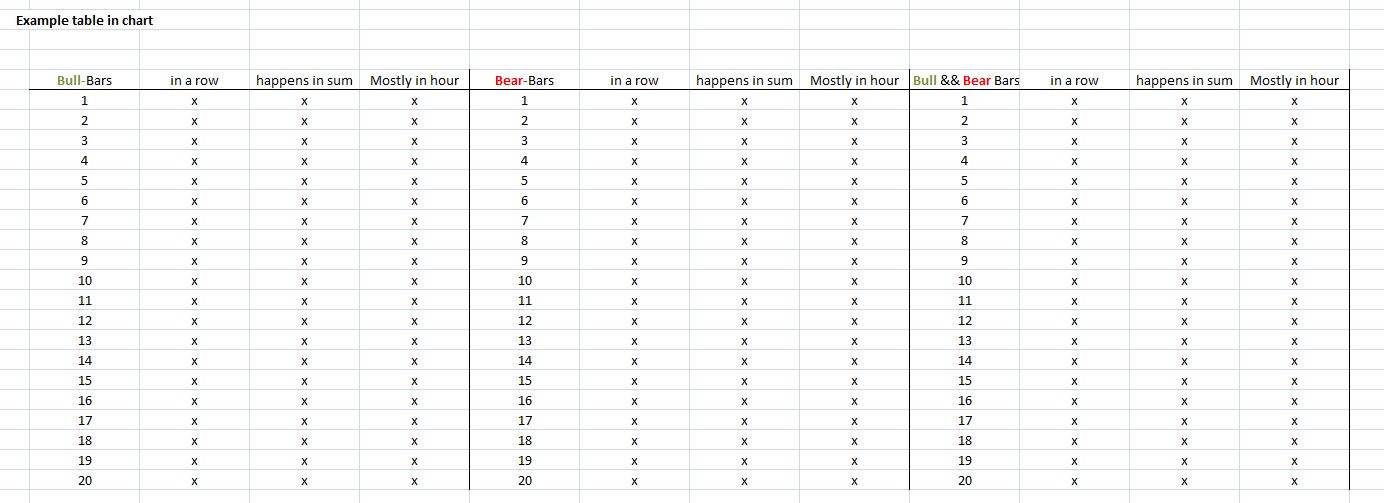
I have an indicator that shows the bull bars and the bear bars

Now I need some information's about the bars
Point 1: count the bars in a row
For example
1 BullBar in row: (for example) 15
2 BullBars in row: (for example) 12
3 BullBars in row: (for example) 11
And so on
1 BearBar in row: (for example) 14
2 BearBars in row: (for example) 11
3 BearBars in row: (for example) 9
And so on
And
1 Bull and BearBar in a row: (for example) 16
2 Bull and BearBars in a row: (for example) 14
3 Bull and BearBasr in a row: (for example) 13
Point 2: TimeFilter
Please include a time filter so should be from 6 hour to 19 hour
Point 3: time of movements
Is it possible to check the time of movements?
maybe you can save the time when we have more bars in row, and then compare if there is a time when it happens often.
and also with less bars.
Point 4: table
Please write the analysed results on the chartwindow in a table
make me an offer about this work.