类别中的新订单:
30 - 35 USD
30+ USD
40+ USD
50 - 100 USD
100+ USD
40 - 60 USD
指定
The tool should be able to take a CSV file with specific format as input and needs to do the following.
The CSV file has list of orders with
1.name of the Currency pair or metal
2.Volume
3.ordertype (only two types of order - BUYSTOP or SELLSTOP)
4.Entry, Stop-loss, Take profit
5.Loop-times
6.Terminate value
The tool must read the CSV file and place 1st order in the list with SL and take profit updated.
If the take profit of the order is completed directly, the CSV file should stop. No further actions needed. I will remove the EA from chart.
If stop loss is achieved, i want the tool to place the same order again at the instant when stop loss is achieved. I want the tool to place the same order each time when stop loss is achieved for the mentioned number of times in Loop column in CSV file or until the price equals or higher than terminate value ( price equals or lesser than terminate value for CSV file with buy stop orders)
Example:
Let us consider the below as first two orders in the csv file.
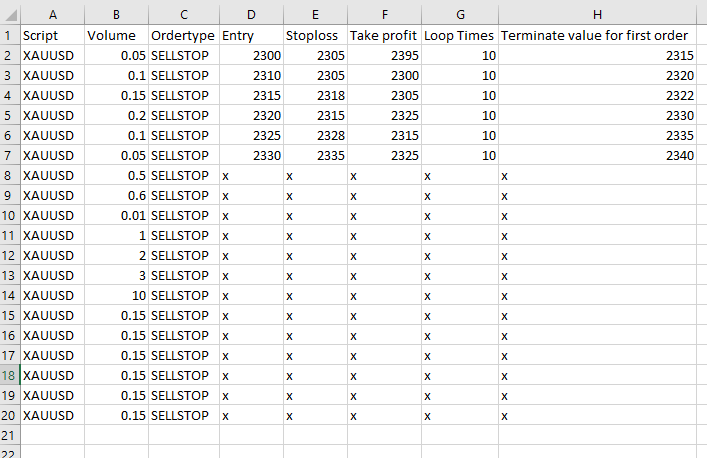
Script Volume Order type Entry Stoploss Take profit Loop Times Terminate value for first order
XAUUSD 0.05 SELLSTOP 2300 2305 2395 10 2315
XAUUSD 0.1 SELLSTOP 2310 2305 2300 10 2320
XAUUSD 0.15 SELLSTOP 2315 2318 2305 10 2322
1.The EA after getting the csv file as input, should place the sell stop order at 2300 for 0.05 lots with SL and TP updated.
If it directly reaches the TP of 2395, the EA should stop working.
2.If it reaches the SL of 2305, i want the EA to place the same order again at 2300. If the order executes and reaches TP now, the EA should stop working. (so at any case when tp gets hit, the particular EA should stop working)
3.If it reaches stoploss, the EA is placing the same trade again and If the price equals or if the price is higher than terminate value 2315,the first order should be deleted and second order should be placed.
4.now if second order gets executed at 2310 and if its TP is achieved, EA should stop. IF SL is achieved order should be placed again. If terminate value of 2320 is achieved, the second order should be deleted and third order should be placed at 2315.
5. This has to go through the same for all the list of orders in CSV file. I'm limiting the maximum list of order's as 25 in the CSV.
So Take profit, end the EA. SL place the order again, Terminate value place the next order. Two different EA for buystop and sellstop to avoid confusion.
反馈
1
等级
项目
162
22%
仲裁
7
29%
/
43%
逾期
4
2%
繁忙
2
等级
项目
13
0%
仲裁
0
逾期
1
8%
已载入
3
等级
项目
2
0%
仲裁
0
逾期
0
工作中
4
等级
项目
93
37%
仲裁
11
27%
/
45%
逾期
14
15%
工作中
5
等级
项目
17
65%
仲裁
3
0%
/
100%
逾期
1
6%
工作中
6
等级
项目
42
29%
仲裁
4
25%
/
25%
逾期
0
工作中
相似订单
I have a hedging strategy idea I would like coded but it is complicated and advanced, I have two EAs I would like the idea coded to. I would like the coder to be professional and fast. The hedging strategy consists of opening multiple orders mixed of buys & sells. Please be experienced and don't waste my time or yours
I am looking for an experienced Forex trading expert to help me configure, set up, and run a fully automated trading account. I am new to Forex trading and am eager to learn, so I am seeking someone who can not only set up the account but also provide guidance and education throughout the process
This Indicator is for the 15minutes timeframe but it should be able to work on higher timeframes and with any currency pairs. I want an indicator that draws two horizontal lines - One from the Highest High, the other from the Lowest Low. The lines start from the start of a new Trading day and ends at 04:00 am. So the indicator draws the line from the highest high between time 0 and 4am AND the line from the lowest
Add simple function to expert and check coding
40 - 60 USD
I have an EA that works with GRID, very simple strategy. THE JOB - This current EA is not closing both sides when TP is reached so would like to make this function work. The strategy : The Expert will start and generate a position of buy\sell at the same time when added to chart. The frist and last positions are considered scalping positions with a smaller TP just for the purpose of generating IB comisisons. After
I would need a robot that will automatically enter buy and sell positions based on the renko chart. The trend is to be determined on the basis of Elliot Waves. Individual peaks and troughs are determined by the TMA centerband Indicator. The buy position is entered when a higher low appears via the buy signal of the TMA indicator A sell position is entered when a lower high appears via the sell signal of the TMA
Converting TradingView Strategy into MQL5 EA
40 - 60 USD
hi. I hv a strategy on tradingview need to convert to MT4/MT5 expert advisor for algo trading. would like to add some tradingview strategy setting to the EA(not included in my tradingview code): recalculate after order is filled, order size: xx% of equity
Ninjatrader modification
30+ USD
Hello great developer i need a great developer that can help me to do the modification on Ninjatrader https://forum.ninjatrader.com/forum/ninjatrader-7/general-development/44785-real-time-data-feed-from-excel-sheet Need a simple tool to connect rt data from excel to Ninjatrader- Already a free tool available which extracts data from trading software called- Nest Trader - to Ninjatrader- Its possible to modify it to
Hello I would like to replicate ThinkTrader desktop version indicators to be used in MT4 . The indicators are 1) Trendrisk Trend and 2) Supertrend. These indicators will paint the candlestick of the chart. thanks
I nees an expert advisor
100+ USD
The idea of the trading system is as follows : market entries are performed when MACD's main and signal lines intersect in the current trend direction . 2. Trend is determined based on the Exponential Moving Average with the specified period (InpMATrendPeriod). If the current EMA value is greater than the previous one, the trend is seen as growing (ema_current > ema_previous). Alternatively, if current EMA is
SIERRA CHART - AI Program Needed
150+ USD
1. Combination of Market Profiles on daily basis a) this should be combined if the bell curve is similar to the previous day. Rotational day (volume - standard deviation). b) If breakout, new range should be drawn Conclusion: Market profile should be combined on daily after the market is closed 2. Use Vwap indicator, with 0.5 - slow trend, 1.0 - normal trend, 1.5 fast trend. The stop loss should be under the trend
项目信息
预算
100 - 200 USD
开发人员
90
- 180
USD