工作已完成
指定
Hi Developers,
I want a dashboard to show 3 indicators and current number of open buy/sell trades or each pair.
Column 1,2,3:
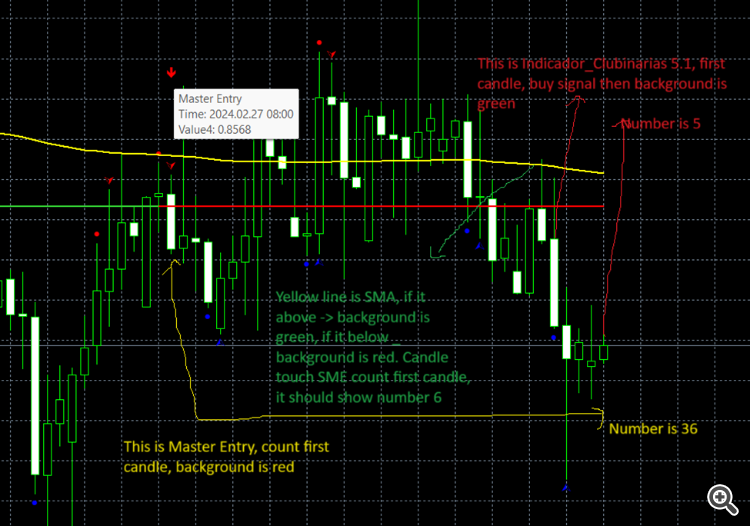
- Master Entry: if red line appear -> background is red, if green line appear -> background is green; count 1 at the first change candle and show the numerical order at the moment.
- Indicador_Clubinarias 5.1: If blue dot appear -> background is green, if red dot appear -> background is red; count 1 at the first dot candle and show the numerical order at the moment on dashboard.
- Exponential moving average (default is 200 – can change this number on input setting): if candle is below the EMA line -> background is red, if candle is above the EMA line -> background is green. Count 1 at the fist candle touch EMA line, and show the numerical order at the moment
ð Alert if Indicator_Clubianiras 5.1 have number 1 with all master Entry, Indicator Clubinarias and EMA have same background color. Be noted that these 3 indicator is repainted during candle moving, alert only at close candle; Once it is closed candle, indicators are not repainted.
Data of these 3 indicator can be show depend on current timeframe to open or can be adjusted on input setting.
Column 5,6:
Dashboard show current opening trades buy/ sell and number of it. Example, If pair is opening 3 buy order -> show number 3 with green text. If pair is opening 1 sell order -> show number 1 with red text. If no order buy/ sell -> white/ gray color background, no number
Column 7,8:
Current profit/ loss: give current profit/ loss status in $.
Monitor: if have both buy sell number on column 5,6 => tick X. If master entry background is green, have buy order only => tick V, same as master entry background is red, have sell order only => tick V
Below is example EURGBP pair with picture

