工作已完成
指定
Indicator creates a chart and changes the color of candles
The way indicator works
1. The length of a candle, let’s call it a signal candle, is X% more than length of the largest of X previous candles (number of previous candles is an input parameter). Indicator changes the color of this signal candle and creates a tick on the chart.
2. The length of the signal candle is X% more than the average length of X previous candles (number of previous candles is an input parameter). Indicator changes the color of this signal candle and creates a tick on the chart.
Once signal candle has been formed the indicator changes its color as well as color of previous candles that have been analyzed.
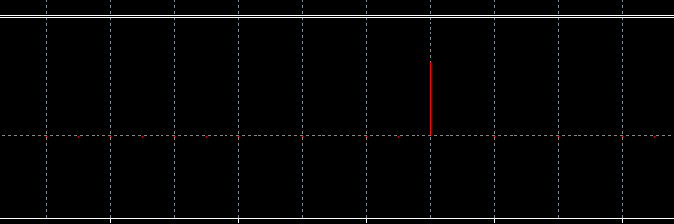
Indicator’s chart has levels 1, 0 and -1.
If the signal candle is bullish than indicator’s chart takes the value of 1
If the signal candle is bearish than indicator’s chart takes the value of -1
Indicator’s chart takes the value of 0 with other candles that are not signal.
Indicator’s chart should look like the one on the following picture. Thin vertical lines. The indicator will only have 3 values: 1, 0, -1.
Input indicator’s parameters
There are two tabs.
General
1. Mode - bodies/shades.
· Indicator takes into account open and close prices if mode is bodies.
· Indicator takes into account high and low prices if mode is shades.
2. Number of candles – number of previous candles that indicator analyzes.
3. Average % - shows by how many percent the signal candle length should be larger than the average length of the previous candles.
4. Max % - shows by how many percent the signal candle length should be larger than the length of the largest of previous candles.
Color
1. Signal candle color - The color is the same both for bearish and bullish candles.
2. Previous candles color
3. Chart color
Example
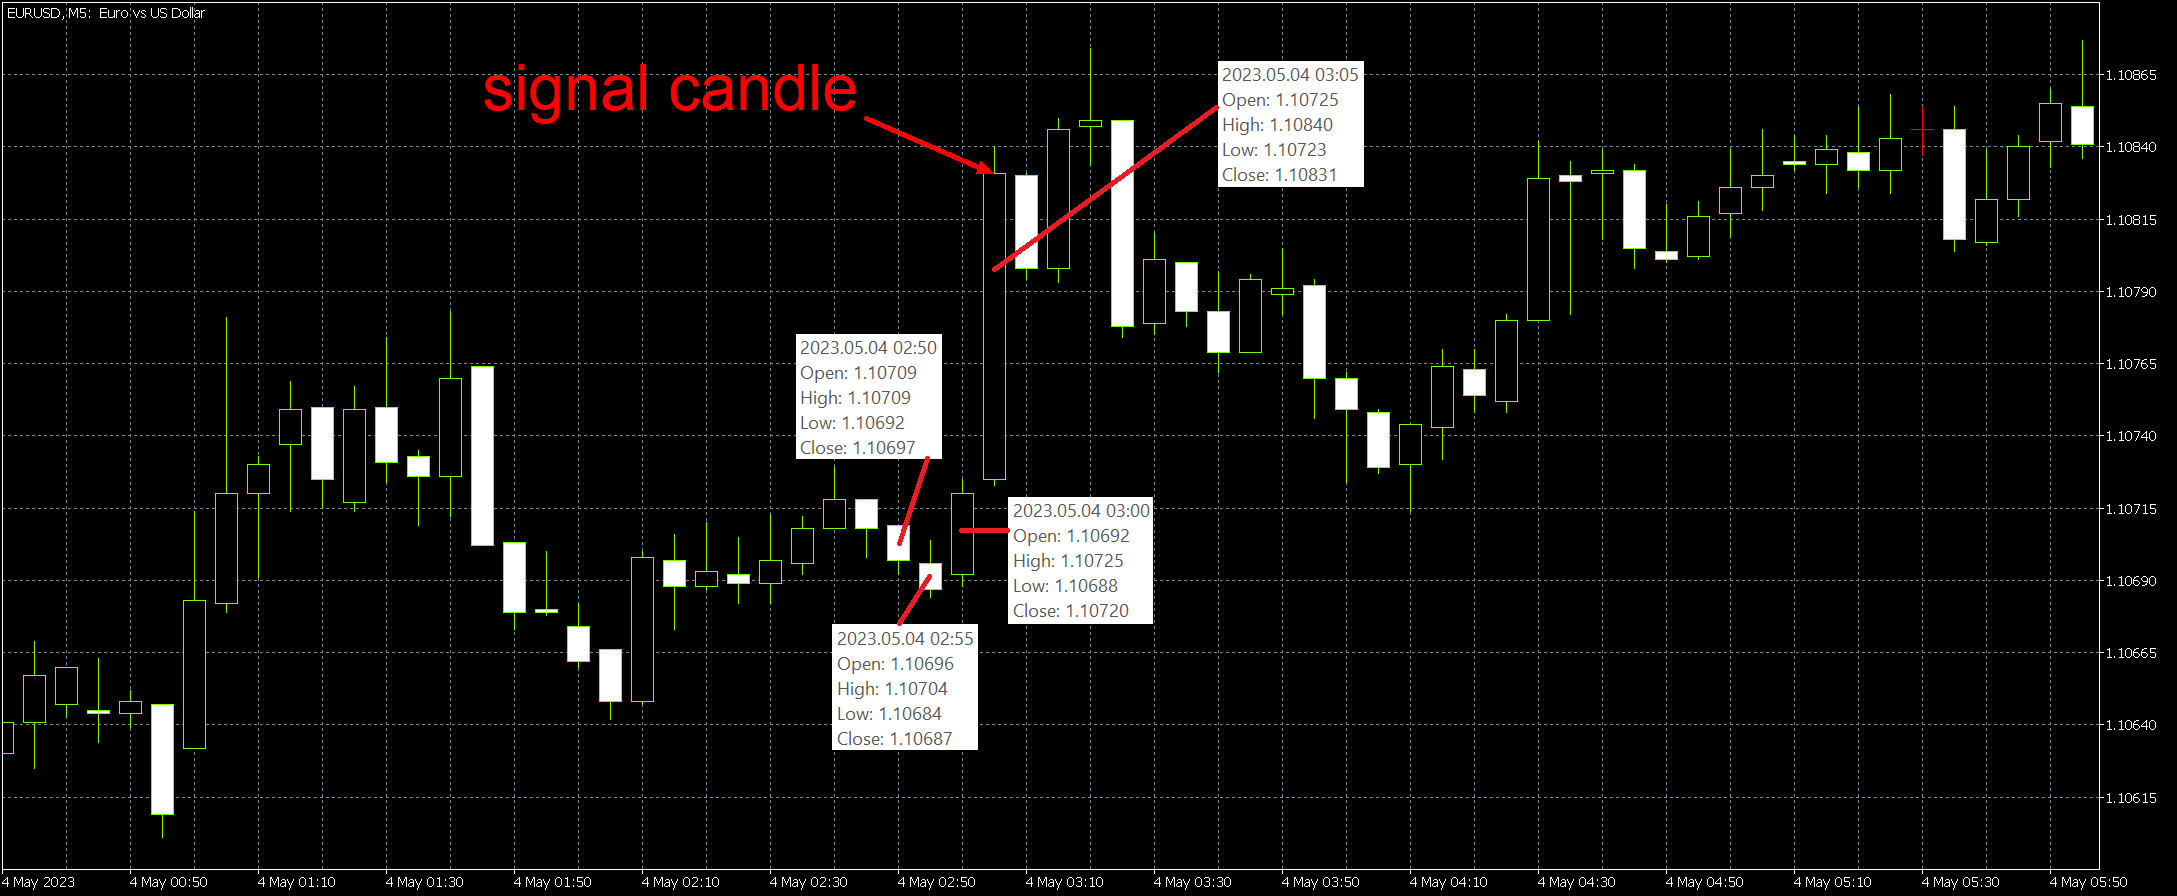
General
1. Mode = bodies
2. Number of candles = 3
3. Average % = 50
4. Max % = 50
Color
1. Signal candle color = Orange
2. Previous candles color = Blue
3. Chart color = Red
Mode = bodies. So we take into account open and close prices.
Let’s calculate the average length of 3 previous candles.
Candle 1. 1.10709 - 1.10697 = 0.00012
Candle 2. 1.10696 - 1.10687 = 0.00009
Candle 3. 1.10720 - 1.10692 = 0.00028
If candle is bullish than its length = close price – open price
If candle is bearish than its length = open price - close price
Now the signal candle 1.10831 – 1.10725 = 0.00106
Average = 50%. So the signal candle should be larger at least by 50% than the average length of the previous candles.
(12+9+28)/3 = 16.3. If 16.3 points = 100% than 106 points = 650.3 %
The requirements are met. The signal candle is much larger than average length of previous candles.
Max = 50%. So the signal candle should be larger at least by 50% than the largest of the previous candles.
If 28 points = 100% than 106 points = 387.6 %
The requirements are met. The signal candle is much larger than max length of previous candles.
Once signal candle has been formed the indicator changes its color as well as color of previous candles that have been analyzed (3 previous candles in this case) and creates a tick on the chart. 3 candles that were analyzed and all other candles that are not signal candles are reflected on the chart as 0.