类别中的新订单:
100 - 250 USD
100 - 400 USD
100 - 1000 USD
30 - 100 USD
指定
Hi
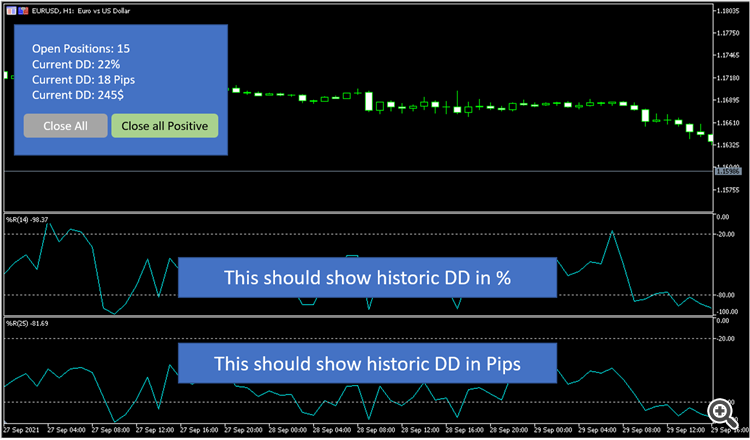
I'd like to have an indicaor (or EA or whatever is necessary) which shows me the the current DD in %, Pips and $ on the left side of a chart plus 3 lines showing the same data based on history (depending on the selected timeframe). Also I'd like to have 2 buttons planed on the chart
1st button: close all open trades
2nd button: close all open trades in the positive (whereas the commission and swap have to be considered)
Thanks
Daniel
反馈
1
等级
项目
1451
45%
仲裁
49
73%
/
12%
逾期
36
2%
空闲
2
等级
项目
509
47%
仲裁
29
10%
/
45%
逾期
138
27%
空闲
3
等级
项目
508
53%
仲裁
10
60%
/
20%
逾期
3
1%
工作中
4
等级
项目
1778
61%
仲裁
14
64%
/
7%
逾期
84
5%
空闲
5
等级
项目
1046
39%
仲裁
47
49%
/
23%
逾期
84
8%
空闲
6
等级
项目
558
33%
仲裁
24
67%
/
8%
逾期
16
3%
空闲
7
等级
项目
88
14%
仲裁
30
30%
/
57%
逾期
36
41%
工作中
项目信息
预算
30 - 100 USD
开发人员
27
- 90
USD