A Support and resistance Indicator with RSI and Stochastic show Arrow

MQL4 指标 专家 外汇 股票 期权

工作已完成

执行时间18 天

指定

 Hi Developers,

   Please help to code below parameters needed  Support and Resistance Indicator. Do let me know is this not clear or needed further explanation. 


Support and Resistance Indicator


Rules: 

1. Indicator will identify and  show and draw zone lines on resistance from previous peak resistance from data dashboard window of 1H, 4H, 1D, 1Week and monthly.
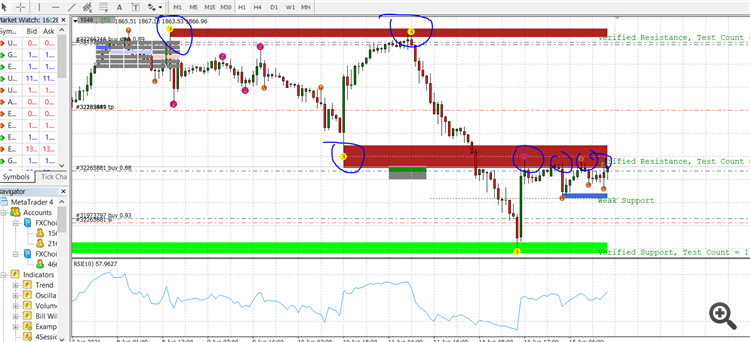
resistance sample

2. Indicator will identify and  show and draw zone lines on Support from previous lower support from data dashboard window of 1H, 4H, 1D, 1Week and monthly.
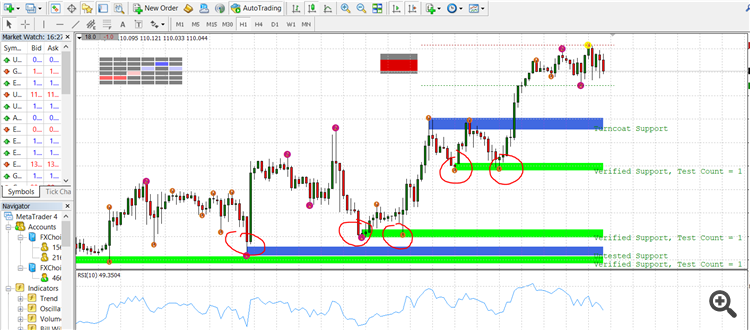
support sample


3. The draw line on support and resistance must be bold (like the sample indicator). 
4. if the data show's peak resistance but no other resistance peak, it will show weak resistance. (put selection color). and True or false enable selection.
5. if the data show's lower support but no other support low level, it will show weak support. (put selection color). and True or false enable selection.
6. if the data show's few times touching on the resistance it will show verified resistance with total count times indicator (like in sample EA). (put selection color). and True or false enable selection.
7. if the data show's few times touching on the support it will show verified support with total count times indicator (like in sample EA). (put selection color). and True or false enable selection.
8. If the identified support and resistance zone that is not reach yet, it will show untested support.
9. If the identified support and resistance zone that is not reach yet, it will show untested resistance.

10. Indicator must provide window alerts on each time support or resistance reach. (put selection enable True or false).
11. If the support or resistance was already reach but the market keep continue and surpass to continue up or keep down and break the support or resistance, Indicator will indicate (support overturn or resistance overturn) whenever which potion it was overturn.. 
12. Each time reach (verified support/resistance with total count times indicator) at rules number number 6 and 7, must have a function on mobile notification option with enable selection  (true or false).
13. Each time reach (verified support/resistance with total count times indicator) at rules number number 6 and 7, must have a function on email notification option with enable selection  (true or false).
14. Show window information summary that indicates which time frame has already reach support and resistance. 
    (like 1H= reach support or resistance (either),  4H= not reach yet support or resistance (either), D1= not reach yet support or resistance (either))

  or(like 1H= reach support or resistance (either),  4H= reach support or resistance (either), D1= not reach yet support or resistance (either)) 

15. The indicator will also show ARROW UP, if the support was reach and RSI = 30, and Stochastic oscillator =30 settings  will reach down oversold and start to surpass up the over-sold settings, RSI = 30,  Stochastic oscillator =30. If the 3 criteria happen, the indicator will show ARROW UP. see below photo.
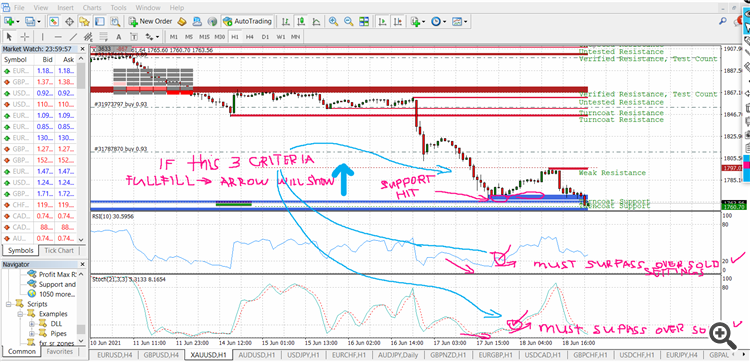

arrow up


16. The indicator will also show ARROW DOWN , if the resistance was reach and RSI = 70, and Stochastic oscillator =70 settings  will reach up over bought settings and start to surpass down the over-bought settings, RSI = 70,  Stochastic oscillator =70. If the 3 criteria happen, the indicator will show ARROW DOWN. see below photo.
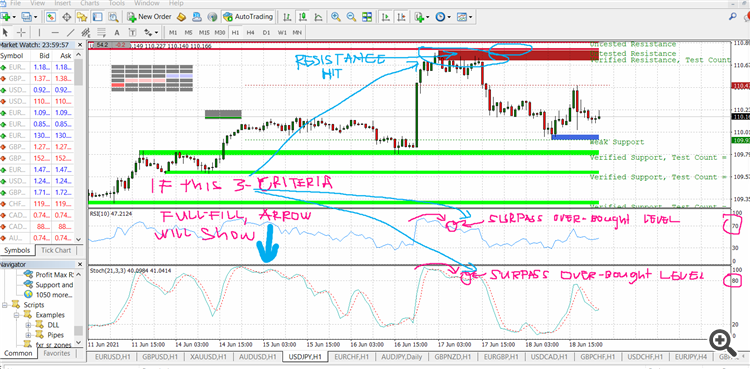

arrow down


17. The Indicator must be non-repainting indicator.


反馈

1
开发者 1
等级
(356)
项目
632
26%
仲裁
89
73% / 13%
逾期
12
2%
空闲
2
开发者 2
等级
(22)
项目
30
20%
仲裁
8
63% / 13%
逾期
9
30%
空闲
3
开发者 3
等级
(237)
项目
419
34%
仲裁
53
36% / 40%
逾期
154
37%
繁忙
相似订单
1. Combination of Market Profiles on daily basis a) this should be combined if the bell curve is similar to the previous day. Rotational day (volume - standard deviation). b) If breakout, new range should be drawn Conclusion: Market profile should be combined on daily after the market is closed 2. Use Vwap indicator, with 0.5 - slow trend, 1.0 - normal trend, 1.5 fast trend. The stop loss should be under the trend
Make a 10000 plus script trading Expert advisor with detail and make it flawless with no errors no tiny mistakes and make it in mql 5 language. Make it adjustable for it to be able to trade on its own and not be disturbed and make it study the chart and be able to trade any currency pair. I have zero experience and I would just like to copy and paste the code in MetaTrader. Can you make it be compatible with both
Need ea according to stochastic divergence (both hidden and regular) plus candlestick flip .. need for experinced developers to complete my order with 99percent accuracy. So bet for it the budged is fixed and other plugins will be added in the v2
looking for help to get my ibkr automated, i have strategies already built in composer and have JSON for them, i really just need to he setup and explanation on how to maintain it and add new strategies
// Define the properties input int ShortPeriod = 12; input int LongPeriod = 26; input double LotSize = 0.1; // OnTick function is called every time there is a price update void OnTick() { double shortMA = iMA(NULL, 0, ShortPeriod, 0, MODE_SMA, PRICE_CLOSE, 0); double longMA = iMA(NULL, 0, LongPeriod, 0, MODE_SMA, PRICE_CLOSE, 0); double prevShortMA = iMA(NULL, 0, ShortPeriod, 0, MODE_SMA, PRICE_CLOSE, 1);
Hello Greetings. I have a custom tradingview strategy I would like to convert to Metatrader 5 ( mt5 ) . I have the source code a and with me. Kindly bid if it is what you can do for me and let discuss about the project. Thanks
I need a AI signal generating bot for forex trading. The bot should operate such that when i put it in a chart it will analyse the market, after several minutes it will display whether the trade is buying or selling. It should display the one minute, five minute,15minute, 30 minute, one hour, 4 hours and daily time frame whether they are buying or selling. If it is buying the arrow should be green and if it is
Using Bollinger Band only. When price closes above upper BB, open Buy. If the length of the candle body that closed above the upper BB is more than Y pips, then do not Buy and remove the EA. Otherwise, continue to open Buy if crosses and close above upper BB and the number of positions is not more than Max No of Positions. The user will choose either Buy or Sell only. When price closes below the lower BB, close all
Hello freelancers here, I need an expert to help me with coding my script which is already working in pinescript, Moreover, i want a system whereby i can sell my trading bot and can give access with a license, I need an expert that can help me with this
hello great developer Can you make a high/low ticker tape on a table for 100 stock symbols? As a symbol makes a high or low throughout the day, it will appear on the table. i will be expecting great developer to bid for this project

项目信息

预算
30+ USD
开发人员
27 USD