MQL5的股权振荡器意味着
大家好!
我为在所附图表下建立股票震荡器的问题纠结了一天(因为测试器中的图表缺乏主要内容,即便于与市场变化进行比较,顺便说一下,其他人已经写了)。
据我所知,这个问题是两方面的。
一方面,在震荡器的OnCalculate方法中,确定每个条形的Equity AccountInfoDouble(ACCOUNT_EQUITY)的方法拒绝工作。
另一方面,很难看到是否可以从专家顾问的OnTick代码中改变震荡器图表(或者说是其数据缓冲区),其中AccountInfoDouble(ACCOUNT_EQUITY)方法发挥作用。
下面是震荡器的代码,尽管它很简单,但却无法产生结果。
直觉上,我明白这个问题必须以简单的方式解决,但我想不出来如何解决。
也许有人对这个问题有一些想法?
AccountInfoDouble(ACCOUNT_EQUITY); 返回股本的当前状态,没有历史记录。在你的例子中,指标缓冲区的所有单元格都被写入相同的值。下面是一个股票指标的例子,但它只在图表上启动的那一刻起发挥作用
//+------------------------------------------------------------------+
//|                                                       Equity.mq5 |
//|                                                    Сергей Грицай |
//|                                               sergey1294@list.ru |
//+------------------------------------------------------------------+
#property copyright "Сергей Грицай"
#property link      "sergey1294@list.ru"
#property version   "1.00"
#property indicator_separate_window
#property indicator_buffers 4
#property indicator_plots   1
//--- plot Label1
#property indicator_label1  "Label1"
#property indicator_type1   DRAW_CANDLES
#property indicator_color1  MediumAquamarine
#property indicator_style1  STYLE_SOLID
#property indicator_width1  1

double         Label1Buffer1[];
double         Label1Buffer2[];
double         Label1Buffer3[];
double         Label1Buffer4[];

//+------------------------------------------------------------------+
//| Custom indicator initialization function                         |
//+------------------------------------------------------------------+
int OnInit()
  {
//--- indicator buffers mapping
   SetIndexBuffer(0,Label1Buffer1,INDICATOR_DATA);
   SetIndexBuffer(1,Label1Buffer2,INDICATOR_DATA);
   SetIndexBuffer(2,Label1Buffer3,INDICATOR_DATA);
   SetIndexBuffer(3,Label1Buffer4,INDICATOR_DATA);

   ArraySetAsSeries(Label1Buffer1,true);
   ArraySetAsSeries(Label1Buffer2,true);
   ArraySetAsSeries(Label1Buffer3,true);
   ArraySetAsSeries(Label1Buffer4,true);

   ArrayInitialize(Label1Buffer1,0.0);
   ArrayInitialize(Label1Buffer2,0.0);
   ArrayInitialize(Label1Buffer3,0.0);
   ArrayInitialize(Label1Buffer4,0.0);
//---
   return(0);
  }
//+------------------------------------------------------------------+
//| Custom indicator iteration function                              |
//+------------------------------------------------------------------+
int OnCalculate(const int rates_total,
                const int prev_calculated,
                const datetime &time[],
                const double &open[],
                const double &high[],
                const double &low[],
                const double &close[],
                const long &tick_volume[],
                const long &volume[],
                const int &spread[])
  {
//---
   Label1Buffer1[0]= AccountInfoDouble(ACCOUNT_EQUITY);
   Label1Buffer2[0]= AccountInfoDouble(ACCOUNT_EQUITY);
   Label1Buffer3[0]= AccountInfoDouble(ACCOUNT_EQUITY);
   Label1Buffer4[0]= AccountInfoDouble(ACCOUNT_EQUITY);
//--- return value of prev_calculated for next call
   return(rates_total);
  }
//+------------------------------------------------------------------+
修正了指标,使之更好一些
#property indicator_separate_window
#property indicator_buffers 4
#property indicator_plots   1
//--- plot Label1
#property indicator_label1  "Label1"
#property indicator_type1   DRAW_CANDLES
#property indicator_color1  MediumAquamarine
#property indicator_style1  STYLE_SOLID
#property indicator_width1  1

double         Label1Buffer1[];
double         Label1Buffer2[];
double         Label1Buffer3[];
double         Label1Buffer4[];

datetime Time[1];
datetime curbar[1];
datetime lastbar[1];
//+------------------------------------------------------------------+
//| Custom indicator initialization function                         |
//+------------------------------------------------------------------+
int OnInit()
  {
//--- indicator buffers mapping
   SetIndexBuffer(0,Label1Buffer1,INDICATOR_DATA);
   SetIndexBuffer(1,Label1Buffer2,INDICATOR_DATA);
   SetIndexBuffer(2,Label1Buffer3,INDICATOR_DATA);
   SetIndexBuffer(3,Label1Buffer4,INDICATOR_DATA);

   ArraySetAsSeries(Label1Buffer1,true);
   ArraySetAsSeries(Label1Buffer2,true);
   ArraySetAsSeries(Label1Buffer3,true);
   ArraySetAsSeries(Label1Buffer4,true);

   ArrayInitialize(Label1Buffer1,0.0);
   ArrayInitialize(Label1Buffer2,0.0);
   ArrayInitialize(Label1Buffer3,0.0);
   ArrayInitialize(Label1Buffer4,0.0);

//---
   return(0);
  }
//+------------------------------------------------------------------+
//| Custom indicator iteration function                              |
//+------------------------------------------------------------------+
int OnCalculate(const int rates_total,
                const int prev_calculated,
                const datetime &time[],
                const double &open[],
                const double &high[],
                const double &low[],
                const double &close[],
                const long &tick_volume[],
                const long &volume[],
                const int &spread[])
  {
//---
   if(NewBar())
     {
      Label1Buffer1[0]= AccountInfoDouble(ACCOUNT_EQUITY);
      Label1Buffer2[0]= AccountInfoDouble(ACCOUNT_EQUITY);
      Label1Buffer3[0]= AccountInfoDouble(ACCOUNT_EQUITY);
      Label1Buffer4[0]= AccountInfoDouble(ACCOUNT_EQUITY);
     }
   if(AccountInfoDouble(ACCOUNT_EQUITY)>Label1Buffer2[0])Label1Buffer2[0]= AccountInfoDouble(ACCOUNT_EQUITY);
   if(AccountInfoDouble(ACCOUNT_EQUITY)<Label1Buffer3[0])Label1Buffer3[0]= AccountInfoDouble(ACCOUNT_EQUITY);
   Label1Buffer4[0]=AccountInfoDouble(ACCOUNT_EQUITY);
//--- return value of prev_calculated for next call
   return(rates_total);
  }
//+------------------------------------------------------------------+
bool NewBar()
  {
   if(CopyTime(_Symbol,0,0,1,Time)<1)return(false);

   curbar[0]=Time[0];
   if(lastbar[0]!=curbar[0])
     {
      lastbar[0]=curbar[0];
      return(true);
     }
   else
     {
      return(false);
     }
  }
//+------------------------------------------------------------------+
出现的情况大致是这样的
т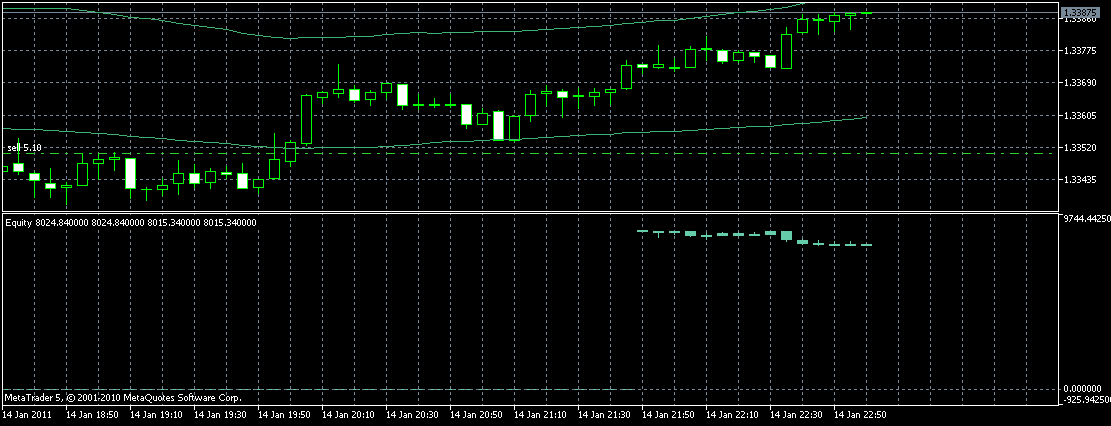
谢尔盖,谢谢你!
但是,真的有可能创建一个考虑到历史因素的稳健的股票震荡器吗?
专家顾问以最简单的方式显示在测试器中选择的时期的所有股票价值
打印(AccountInfoDouble(ACCOUNT_EQUITY))...
从Print(AccountInfoDouble(ACCOUNT_EQUITY))中 的变化值来看,股权有变化,因为历史上股权的当前状态在指标的OnCalculatde(...)方法中被模拟,这与EA的OnTick方法中的处理同步发生。
那么问题出在哪里呢?为什么输出的利润会变化,而在指标中保持不变(在我的例子中是10000)?
这段代码很简单(我重写了一下)。
//+------------------------------------------------------------------+
//|                                                       Equity.mq5 |
//|                        Copyright 2010, MetaQuotes Software Corp. |
//|                                              http://www.mql5.com |
//+------------------------------------------------------------------+
#property copyright "Copyright 2010, MetaQuotes Software Corp."
#property link      "http://www.mql5.com"
#property version   "1.00"
#property indicator_separate_window
#property indicator_buffers 1
#property indicator_plots   1
//--- plot Label1
#property indicator_label1  "Label1"
#property indicator_type1   DRAW_LINE
#property indicator_color1  Red
#property indicator_style1  STYLE_SOLID
#property indicator_width1  1
//--- indicator buffers
double Values[];


//+------------------------------------------------------------------+
//| Custom indicator initialization function                         |
//+------------------------------------------------------------------+
int OnInit(){
   //--- indicator buffers mapping
   SetIndexBuffer(0,Values,INDICATOR_DATA);
   PlotIndexSetInteger(0, PLOT_DRAW_BEGIN, 100);
   PlotIndexSetDouble(0, PLOT_EMPTY_VALUE, EMPTY_VALUE);
   ArraySetAsSeries(Values, false);
   return(0);
  }


//+------------------------------------------------------------------+
//| Custom indicator iteration function                              |
//+------------------------------------------------------------------+
int OnCalculate(const int rates_total,
                const int prev_calculated,
                const datetime& time[],
                const double& open[],
                const double& high[],
                const double& low[],
                const double& close[],
                const long& tick_volume[],
                const long& volume[],
                const int& spread[]){


   //---Блок контрольных показателей
   HistorySelect(0,TimeCurrent());
   Print("Equity - OnCalculate: HistoryDealsTotal()=", HistoryDealsTotal());
   Print("Equity - OnCalculate: AccountInfoDouble(ACCOUNT_EQUITY)=", AccountInfoDouble(ACCOUNT_EQUITY));
   Print("Equity - OnCalculate: rates_total=", rates_total);
   Print("Equity - OnCalculate: prev_calculated=", prev_calculated);
   Print("Equity - OnCalculate: ArraySize(open)= ", ArraySize(open));
   Print("Equity - OnCalculate: ArraySize(Values)= ", ArraySize(Values));
   Print("Equity - OnCalculate: datetime(time[",ArraySize(time)-1,"])= ", datetime(time[ArraySize(time)-1]));


   //---Блок заполнения Индикатора и журнала сообщений значениями
   for (int i = prev_calculated; i <= rates_total-1; ++i){
      //Путем сопоставления с выводом значений в Print() исследуются 2 варианта:
      // - Первый вариант - индикатор показывает динамику цен - правильно
      //Values[i] = open[i]; //То есть в соответствии с выводом в Print(...)
      // - Второй вариант - индикатор показывает динамику Equity - неправильно, так как объем остается постоянным
      Values[i] = AccountInfoDouble(ACCOUNT_EQUITY); //Хотя в выводе Print(...) он меняется
      //---Блок проверки даты и показателей цены открытия и Equity в цикле заполнения в рамках диапазона тестирования:
      if(prev_calculated > 0){
         Print("Equity - OnCalculate - Cycle: datetime([",i,"])= ", datetime(time[i]));
         Print("Equity - OnCalculate - Cycle: ArraySize([",i,"])= ", open[i]);
         Print("Equity - OnCalculate - Cycle: AccountInfoDouble(ACCOUNT_EQUITY) = ", AccountInfoDouble(ACCOUNT_EQUITY));
      }
   }
   return rates_total;
}
因此,指标中的平衡值是恒定的,=10000,而在输出中打印会发生变化,在不是平衡而是价格的动态情况下,会正确显示。
例如,对于测试期的最后一个条形图,其参数如下
2011.01.19 19:27:27 核心 1 2011.01.14 22:00:00 股票 - OnCalculate - 循环:AccountInfoDouble(ACCOUNT_EQUITY) = 9949.2999999999
2011.01.19 19:27:27 Core 1 2011.01.14 22:00:00 Equity - OnCalculate - Cycle: ArraySize([6418])=1.33724
2011.01.19 19:27:27:27 Core 1 2011.01.14 22:00:00 Equity - OnCalculate - Cycle: datetime([6418]) = 2011.01.14 22:00:00
2011.01.19 19:27:27 Core 1 2011.01.14 22:00:00 Equity - OnCalculate: datetime(time[6418])= 2011.01.14 22:00:00
2011.01.19 19:27:27:27 Core 1 2011.01.14 22:00:00 Equity - OnCalculate: ArraySize(Values)=6419
2011.01.19 19:27:27 Core 1 2011.01.14 22:00:00 Equity - OnCalculate: ArraySize(open)=6419
2011.01.19 19:27:27 Core 1 2011.01.14 22:00:00 Equity - OnCalculate: prev_calculated=6418
2011.01.19 19:27:27:27 Core 1 2011.01.14 22:00:00 Equity - OnCalculate: rates_total=6419
2011.01.19 19:27:27:27 核心 1 2011.01.14 22:00:00 股票 - OnCalculate: AccountInfoDouble(ACCOUNT_EQUITY)=9949.2999999999
2011.01.19 19:27:27 Core 1 2011.01.14 22:00:00 Equity - OnCalculate: HistoryDealsTotal()=12
- www.mql5.com
这样就更漂亮了。
下面是振荡器的代码,尽管它很简单,但并没有产生结果。

- 2010.02.23
- MetaQuotes Software Corp.
- www.mql5.com
从Print(AccountInfoDouble(ACCOUNT_EQUITY))中 的变化值来看,股权有变化,因为历史上股权的当前状态在指标的OnCalculatde(...)方法中被模拟,这与EA的OnTick方法中的处理同步发生。
那么问题出在哪里呢?为什么在输出中的利润会变化,而在指标中却保持不变(在我的例子中是10000)?
只需注释掉所有不必要的输出并开始输出prev_calculated的值,就可以理解该指标只在第一次计算,而在接下来的点上循环不工作。
   //---Блок контрольных показателей
   //HistorySelect(0,TimeCurrent());
   //Print("Equity - OnCalculate: HistoryDealsTotal()=", HistoryDealsTotal());
   //Print("Equity - OnCalculate: AccountInfoDouble(ACCOUNT_EQUITY)=", AccountInfoDouble(ACCOUNT_EQUITY));
   //Print("Equity - OnCalculate: rates_total=", rates_total);
   //Print("Equity - OnCalculate: prev_calculated=", prev_calculated);
   //Print("Equity - OnCalculate: ArraySize(open)= ", ArraySize(open));
   //Print("Equity - OnCalculate: ArraySize(Values)= ", ArraySize(Values));
   //Print("Equity - OnCalculate: datetime(time[",ArraySize(time)-1,"])= ", datetime(time[ArraySize(time)-1]));
   Print("prev_calculated=",prev_calculated,"   rates_total=",rates_total);
Rosh,说实话,我不太理解你 。只需要输出,以确保 测试范围内的股权
,确实发生了变化。事实上,在测试范围开始之前
,OnCalculated 的循环就已经开始工作了,然后在测试范围内,OnCalculated的每一次调用只包含一个tick和一个pass--这很清楚,但是为什么 股权
的变化值 没有显示在指标上,尽管变化值被写入指标数组?
这里是OnCalculated的简略版本的代码:
int OnCalculate(const int rates_total,
                const int prev_calculated,
                const datetime& time[],
                const double& open[],
                const double& high[],
                const double& low[],
                const double& close[],
                const long& tick_volume[],
                const long& volume[],
                const int& spread[]){
   Print("prev_calculated=",prev_calculated,"   rates_total=",rates_total);
   Print("Equity - OnCalculate: AccountInfoDouble(ACCOUNT_EQUITY)=", AccountInfoDouble(ACCOUNT_EQUITY));
   for (int i = prev_calculated; i <= rates_total-1; ++i){
      Values[i] = AccountInfoDouble(ACCOUNT_EQUITY);
   }
   return rates_total;
}
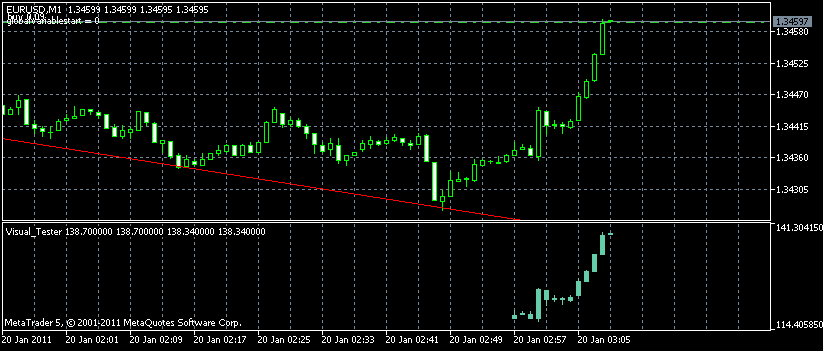
这里是测试期结束时的结果,我们可以看到我们写到指标值数组中的Equity发生了变化,与最初的平衡等于10000不同:
2011.01.20 13:32:07 Core 1 OnTester result 0这里是测试期分配值 的平衡图
2011.01.20 13:32:07 Core 1 2011.01.14 23:59:59 order performed sell 0.15 at 1.33829 [#13 sell 0.15 EURUSD at 1.33829]
2011.01.20 13:32:07 Core 1 2011.01.14 23:59:59 deal performed [#13 sell 0.15 EURUSD at 1.33829]
2011.01.20 13:32:07 Core 1 2011.01.14 23:59:59 deal #13 sell 0.15 EURUSD at 1.33829 done (based on order #13)
2011.01.20 13:32:07 Core 1 2011.01.14 23:59:59 position closed due end of test at 1.33829 [buy 0.15 EURUSD 1.33593]
2011.01.20 13:32:07 Core 1 2011.01.14 22:00:00 Equity - OnCalculate: AccountInfoDouble(ACCOUNT_EQUITY)=9949.299999999999
2011.01.20 13:32:07 Core 1 2011.01.14 22:00:00 prev_calculated=6418 rates_total=6419
2011.01.20 13:32:07 Core 1 2011.01.14 21:00:00 CTrade::PositionOpen: instant buy 0.15 EURUSD at 1.33593 [done at 0.00000]
2011.01.20 13:32:07 Core 1 2011.01.14 21:00:00 order performed buy 0.15 at 1.33593 [#12 buy 0.15 EURUSD at 1.33593]
2011.01.20 13:32:07 Core 1 2011.01.14 21:00:00 deal performed [#12 buy 0.15 EURUSD at 1.33593]
2011.01.20 13:32:07 Core 1 2011.01.14 21:00:00 deal #12 buy 0.15 EURUSD at 1.33593 done (based on order #12)
2011.01.20 13:32:07 Core 1 2011.01.14 21:00:00 instant buy 0.15 EURUSD at 1.33593 (1.33577 / 1.33593 / 1.33577)
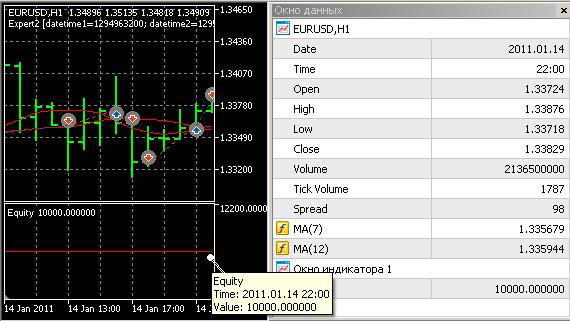
我们在指标图上检查2011.01.14 22:00的Equity值
根据
2011.01.14
22
:00:00
的日志,它应该等于9949:... 2011.01.14 22:00:00 Equity - OnCalculate: AccountInfoDouble(ACCOUNT_EQUITY)=9949.299999999999
而我们在指标图上看到的是什么
?
大家好!
我为在所附图表下建立股票震荡器的问题纠结了一天(因为测试器中的图表缺乏主要内容,即便于与市场变化进行比较,顺便说一下,其他人已经写了)。
据我所知,这个问题是两方面的。
一方面,在震荡器的OnCalculate方法中,确定每个条形的Equity AccountInfoDouble(ACCOUNT_EQUITY)的方法拒绝工作。
另一方面,很难看到是否可以从专家顾问的OnTick代码中改变震荡器图表(或者说是其数据缓冲区),其中AccountInfoDouble(ACCOUNT_EQUITY)方法发挥作用。
下面是震荡器的代码,尽管它很简单,但却无法产生结果。
//+------------------------------------------------------------------+
//| Equity.mq5 |
//| Copyright 2010, MetaQuotes Software Corp. |
//| http://www.mql5.com |
//+------------------------------------------------------------------+
#property copyright "Copyright 2010, MetaQuotes Software Corp."
#property link "http://www.mql5.com"
#property version "1.00"
#property indicator_separate_window
#property indicator_buffers 1
#property indicator_plots 1
//--- plot Label1
#property indicator_label1 "Label1"
#property indicator_type1 DRAW_LINE
#property indicator_color1 Red
#property indicator_style1 STYLE_SOLID
#property indicator_width1 1
//--- indicator buffers
double Values[];
//+------------------------------------------------------------------+
//| Custom indicator initialization function |
//+------------------------------------------------------------------+
int OnInit(){
//--- indicator buffers mapping
SetIndexBuffer(0,Values,INDICATOR_DATA);
PlotIndexSetInteger(0, PLOT_DRAW_BEGIN, 100);
PlotIndexSetDouble(0, PLOT_EMPTY_VALUE, EMPTY_VALUE);
ArraySetAsSeries(Values, false);
return(0);
}
//+------------------------------------------------------------------+
//| Custom indicator iteration function |
//+------------------------------------------------------------------+
int OnCalculate(const int rates_total,
const int prev_calculated,
const datetime& time[],
const double& open[],
const double& high[],
const double& low[],
const double& close[],
const long& tick_volume[],
const long& volume[],
const int& spread[]){
int toCount = (int)MathMin(rates_total, rates_total - prev_calculated + 1);
for (int i = toCount - 2; i >= 0; --i){
Values[i] = AccountInfoDouble(ACCOUNT_EQUITY);
}
return rates_total;
}
直觉上,我明白这个问题必须以简单的方式解决,但我想不出来如何解决。
也许有人在这方面有一些想法?