KG Support & Resistance indicator - update help

.. and if no one helps on this thread so you can go to the Freelance service for example - https://www.mql5.com/zh/job

Sergey Golubev:
Sergey Golubev:
Thank you for reminding me, I know.
I have been trying to get this indicator working with no luck. It attaches to the chart and only adds little red dots the all the candles. I want to know how to display the label [M15 Resistence] [M15 Support]\ [H1Resistence] [H1 Support]\ [H4 Resistence] [H4Support]\[D1 Resistence] [D1Support] on my chart as the pic showed?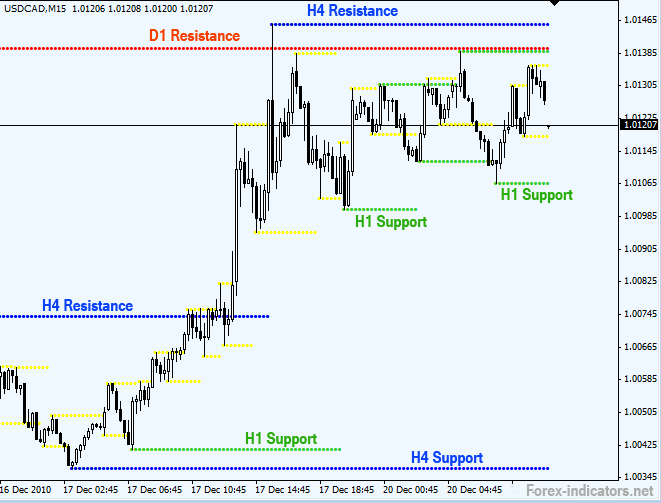
How to change the line's defalt width?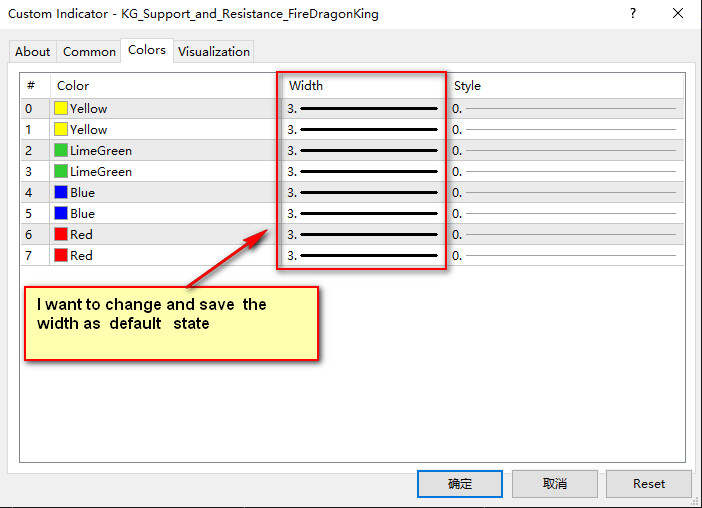
I would like to try it out on my personal trading system I have been developing. I know nothing about code. I am pretty much looking at a foreign language. If anyone out there would be willing to take a look and possibly update the code for me , that would be great. Please let me know. Thanks .