- 显示:
- 8348
- 等级:
- 已发布:
- 2005.11.29 11:54
- 已更新:
- 2015.08.13 16:14
-
需要基于此代码的EA交易或指标吗?请在自由职业者服务中订购 进入自由职业者服务
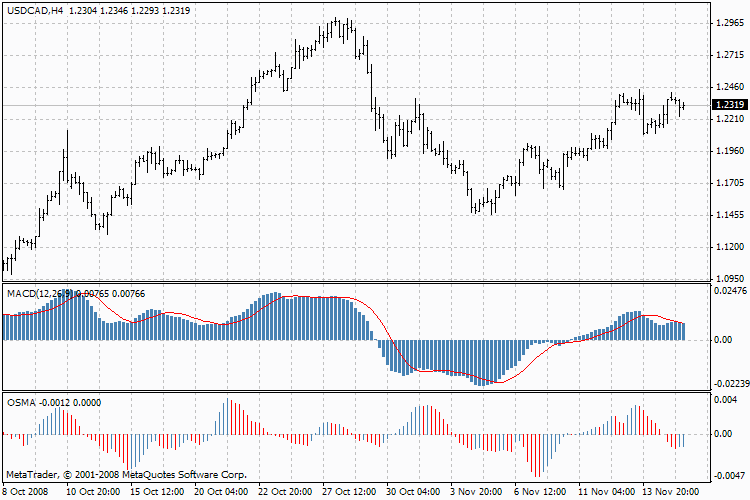
Moving Average Convergence/Divergence is the next trend-following dynamic indicator. It indicates the correlation between two price moving averages.

Moving Average Convergence/Divergence, MACD
The Moving Average Convergence/Divergence Technical Indicator is the difference between a 26-period and 12-period Exponential Moving Average (EMA). In order to clearly show buy/sell opportunities, a so-called signal line (9-period indicators` moving average) is plotted on the MACD chart.
The MACD proves most effective in wide-swinging trading markets. There are three popular ways to use the Moving Average Convergence/Divergence: crossovers, overbought/oversold conditions, and divergences.
The basic MACD trading rule is to sell when the MACD falls below its signal line. Similarly, a buy signal occurs when the Moving Average Convergence/Divergence rises above its signal line. It is also popular to buy/sell when the MACD goes above/below zero.
The MACD is also useful as an overbought/oversold indicator. When the shorter moving average pulls away dramatically from the longer moving average (i.e., the MACD rises), it is likely that the security price is overextending and will soon return to more realistic levels.
An indication that an end to the current trend may be near occurs when the MACD diverges from the security. A bullish divergence occurs when the Moving Average Convergence/Divergence indicator is making new highs while prices fail to reach new highs. A bearish divergence occurs when the MACD is making new lows while prices fail to reach new lows. Both of these divergences are most significantwhen they occur at relatively overbought/oversold levels.
The MACD is calculated by subtracting the value of a 26-period exponential moving average from a 12-period exponential moving average. A 9-period dotted simple moving average of the MACD (the signal line) is then plotted on top of the MACD.
MACD = EMA(CLOSE, 12)-EMA(CLOSE, 26)
SIGNAL = SMA(MACD, 9)
Where:
EMA — the Exponential Moving Average;
SMA — the Simple Moving Average;
SIGNAL — the signal line of the indicator.
Technical Indicator Description
Full description of MACD is available in the Technical analysis: Moving Average Convergence/Divergence
由MetaQuotes Ltd译自俄语
原代码: https://www.mql5.com/ru/code/7774
 Ichimoku Kinko Hyo, Ishimoku
Ichimoku Kinko Hyo indicator is predefined to characterize the market trend, Support and Resistance Levels, and to generate signals of buying and selling.
 Heiken Ashi
Heiken Ashi - Custom Indicator as Candlesticks Example.
 Momentum
The Momentum Indicator (Momentum) measures the amount that a security’s price has changed over a giv
 Moving Averages, MA
The Moving Average Indicator shows the mean instrument price value for a certain period of time.