水平刻度(按时间)
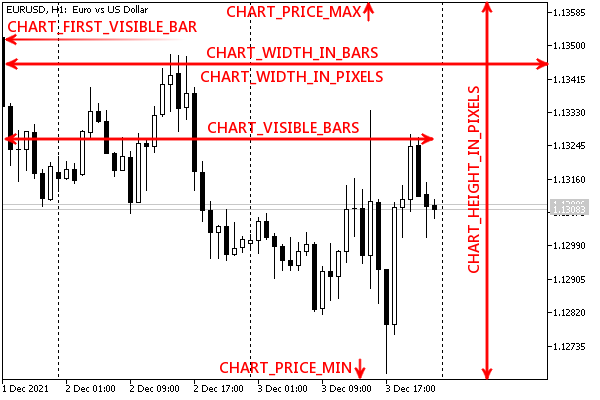
要确定水平轴上的缩放比例和柱线数量,可使用 ENUM_CHART_PROPERTY_INTEGER 枚举中的整数特性组。在这些特性中,只有 CHART_SCALE 可编辑。
标识符
|
说明
|
CHART_SCALE
|
缩放比例(0 到 5)
|
CHART_VISIBLE_BARS
|
图表上当前可见的柱线数量(由于 CHART_SHIFT_SIZE 缩进,可能小于 CHART_WIDTH_IN_BARS)(只读)
|
CHART_FIRST_VISIBLE_BAR
|
图表上第一个可见柱线的编号编号方式与时间序列一致,从右向左递增(只读)
|
CHART_WIDTH_IN_BARS
|
图表宽度,用柱线数量表示(潜在容量,左右两端的柱线可能仅部分可见)(只读)
|
CHART_WIDTH_IN_PIXELS
|
图表宽度,用像素表示(只读)
|

图表上的 ENUM_CHART_PROPERTY_INTEGER 特性
我们已准备好实现下一个测试脚本 ChartScaleTime.mq5,该脚本可用于分析这些特性的变化。
void OnStart()
{
int flags[] =
{
CHART_SCALE,
CHART_VISIBLE_BARS,
CHART_FIRST_VISIBLE_BAR,
CHART_WIDTH_IN_BARS,
CHART_WIDTH_IN_PIXELS
};
ChartModeMonitor m(flags);
...
}
|
以下是部分日志内容,包含了关于所采取操作的注释。
Initial state:
[key] [value]
[0] 5 4
[1] 100 35
[2] 104 34
[3] 105 45
[4] 106 715
// 1) changed the scale to a smaller one:
CHART_SCALE 4 -> 3 // - the value of the "scale" property has changed
CHART_VISIBLE_BARS 35 -> 69 // - increased the number of visible bars
CHART_FIRST_VISIBLE_BAR 34 -> 68 // - the number of the first visible bar has increased
CHART_WIDTH_IN_BARS 45 -> 90 // - increased the potential number of bars
// 2) disabled padding at the right edge
CHART_VISIBLE_BARS 69 -> 89 // - the number of visible bars has increased
CHART_FIRST_VISIBLE_BAR 68 -> 88 // - the number of the first visible bar has increased
// 3) reduced the window size
CHART_VISIBLE_BARS 89 -> 86 // - number of visible bars decreased
CHART_WIDTH_IN_BARS 90 -> 86 // - the potential number of bars has decreased
CHART_WIDTH_IN_PIXELS 715 -> 680 // - decreased width in pixels
// 4) clicked the "End" button to move to the current time
CHART_VISIBLE_BARS 86 -> 85 // - number of visible bars decreased
CHART_FIRST_VISIBLE_BAR 88 -> 84 // - the number of the first visible bar has decreased
|
