Watch the Market tutorial videos on YouTube
How to buy а trading robot or an indicator
Run your EA on
virtual hosting
virtual hosting
Test аn indicator/trading robot before buying
Want to earn in the Market?
How to present a product for a sell-through
Expert Advisors and Indicators for MetaTrader 5 - 45

Monster Harmonics Indicator is a harmonic pattern indicator. It recognizes Gartley, Bat, Crab, Butterfly, Cypher, White Swan, Black Swan, Shark and AB=CD patterns. Projected patterns that are not yet completed are recognized, too. Monster even shows the PRZ (Potential Reversal Zone). Users can add their own user defined patterns to Monster. Besides the current pattern, Monster also shows all patterns in the symbols history. Monster will provide alerts for developing patterns. Introduced by H.M.
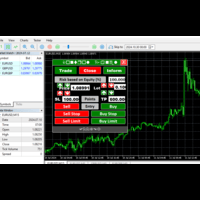
Quick and Easy to use Manual Trader and Risk Management Assistant Gives you a trading environment where you can do forward Testing both on Active Account and Strategy Tester. Suited for Live Trading, Risk Management and also gives you the same Market Capabilities on Strategy tester Provides you with easy editing capabilities and exit strategies that you can Test. ON PROMOTION
FREE

The Price Action Finder indicator is an indicator of entry points, which is designed to search and display patterns of the Price Action system on a price chart. The indicator is equipped with a system of trend filters, as well as a system of alerts and push notifications. Manual (Be sure to read before purchasing) | Version for MT4 Advantages
1. Patterns: Pin bar, Outside bar, Inside bar, PPR, Power bar, Hanging man, Inverted hammer 2. Pattern filtering system. Removes countertrend patterns from

Introduction Harmonic Patterns are best used to predict potential turning point. Traditionally, Harmonic Pattern was identified manually connecting peaks and troughs points in the chart. Manual harmonic pattern detection is painfully tedious and not suitable for everyone. You are often exposed under subjective pattern identification with manual pattern detection. To avoid these limitations, Harmonic Pattern Plus was designed to automate your harmonic pattern detection process. The functionality

The VIX Index, or CBOE Volatility Index, is an indicator designed for MetaTrader 5 that transforms historical volatility into an easy-to-interpret oscillator, placing the volatility range between 0 (minimum) and 100 (maximum) based on a configurable normalization period.
Unlike a simple ATR, this oscillator shows you on the chart when volatility is abnormally low or high compared to its recent behavior. Additionally, the indicator provides context and information about the famous VIX Volatility
FREE

Hello this is MT5 version of my first EA Project - MA CROSS Simple MA Cross Fast and Slow with additional High Time Frame Filter. You can set manually to get optimum Result. It's suit for swing Trader that Trade on High Time Frame. ex. H1 / H4 with D1 Filter. Or you can modify It that follow your strategy.
Give me good feedback to improve for better version. Cheers!!
Hurry up FREE download for Limited Time!!
Please test It on Demo account or strategy tester before applied on Live Account
FREE

This all-in-one indicator displays real-time market structure (internal & swing BOS / CHoCH), order blocks, premium & discount zones, equal highs & lows, and much more...allowing traders to automatically mark up their charts with widely used price action methodologies. Following the release of our Fair Value Gap script, we received numerous requests from our community to release more features in the same category. "Smart Money Concepts" (SMC) is a fairly new yet widely used term amongst price a

Aurea Stella EA – Illuminate Your Trading Path Like the guiding stars that lead sailors through uncharted waters, Aurea Stella EA empowers you to navigate the unpredictable seas of the financial markets. Craft Your Own Constellation of Strategies: Endless Combinations – Weave together Bollinger Bands, Stochastic, RSI, MACD, Envelopes, and Donchian Channels to create your unique trading patterns.
Precision Control – Adjust stop loss, take profit, trailing stops, and choose whether to reverse
FREE

The Candle High Low Exit indicator uses the highest high and the lowest low of a range to draw trailing stop lines (orange under buys, magenta over sells) that advance with the trend until the trend changes direction. Moreover, the trailing stop lines are generated to support the order’s trend direction (long or short): In an upward trend, the long trailing stop line (orange line under buy) appears and advances upward until the close crosses under the line.
In a downward trend, the short trai
FREE

Key Takeaways This timer does not lag like other timer indicators Show the time end of candlesticks and spread Hide or Show Spread depending on user needs Works on all timeframes Adjust Text Size Adjust Text Color Adjust Text Font
If you love this indicator, please leave a positive rating and comment, it will be a source of motivation to help me create more products <3
FREE

This indicator is based on the Moving Average indicator. It helps the user identifying whether to buy or sell. It comes with an alert that will sound whenever a new signal appears. It also features an email facility. Your email address and SMTP Server settings should be specified in the settings window of the "Mailbox" tab in your MetaTrader 5. Blue arrow up = Buy. Red arrow down = Sell. Line = Trailing Stop. You can use one of my Trailing Stop products that automatically move the Stop Loss and
FREE

The seven currencies mentioned are: GBP (British Pound): This is the currency of the United Kingdom. AUD (Australian Dollar): This is the currency of Australia. NZD (New Zealand Dollar): This is the currency of New Zealand. USD (United States Dollar): This is the currency of the United States. CAD (Canadian Dollar): This is the currency of Canada. CHF (Swiss Franc): This is the currency of Switzerland. JPY (Japanese Yen): This is the currency of Japan. Currency strength indexes provide a way to
FREE

Only First 10 Copies are 30$ then Price will be 100$
AUDCAD 200$ to 2000$ - Screenshots + Set File Important: Download the Demo EA and backtest it thoroughly before purchasing.
Important: Message me after Purchase to invite you to private discord for set files/strategies and support.
Example Set File for us100Cash in the Images 4h Timeframe From 5000 USD to 20,318$ in 4 Years While the EA can be used in a simple set-and-run mode, you'll get much better results if you understand what you're do
The uniqueness of this expert is that he uses one common set. for most Expert Advisors, this is not applicable and will not work because most Expert Advisors have either sets that you can download yourself or embedded in the code for each currency pair. This Expert Advisor uses only 1 set for all 20 currency pairs.
I differ from many developers in that I continue. improve your products. The main goal is to make such products that users will be satisfied with. You can always write to me and

If there is only one MT5 indicator you ever buy for trading forex – this has to be it.
Your success as a forex trader depends on being able to identify when a currency or currency pair is oversold or overbought. If it is strong or weak. It is this concept which lies at the heart of forex trading. Without the Quantum Currency Strength indicator, it is almost impossible. There are simply too many currencies and too many pairs to do this quickly and easily yourself. You need help!
The Quantum Cur

If you love this indicator, please leave a positive rating and comment, it will be a source of motivation to help me create more products <3 How to use Slope Direction Line Uptrend: When the SDL line slopes up and turns from red to green, it shows that the price is trending up. This is also considered a buy signal. Downtrend: When the SDL line slopes down and turns from green to red, it shows that the price is trending down. This is also considered a sell signal. Sideways: When the SDL line mo
FREE

Of all the four principle capital markets, the world of foreign exchange trading is the most complex and most difficult to master, unless of course you have the right tools! The reason for this complexity is not hard to understand. First currencies are traded in pairs. Each position is a judgment of the forces driving two independent markets. If the GBP/USD for example is bullish, is this being driven by strength in the pound, or weakness in the US dollar. Imagine if we had to do the same thing

Jackson Support and Resistance it a powerful advance support and resistance indicator which provide signal base on price action, it Design to make things easy for everyone to draw support and resistance. we believe most strategies are built with support and resistance as a foundation .Having support and resistance perfect can be a game change to you way of trading. It flexible to all instrument .don't forget to watch our video on how to us this indicator prefect and progressive.
FREE

Ever wanted to use MACD like you see in TradingView??? Now you can use this indicator to use same MACD in your MetaTrader5 and enjoy more time in Trading.. You can change MACD settings if you want to change and it will be ready to use for you... Now you will not spend time in TradingView to use only indicator there... Open charts , load Indicator and you are ready to do analysis in MetaTrader5 and Put Trades when you feel okay with your analysis.
FREE

An EA created to overclock a deposit within the short period of time. The EA uses accurate signals towards the trend to be able to enter the market. Together with the author’s optimization criterion, the EA allows you to choose appropriate settings to overclock your deposit. The EA works on 4 timeframes, which increases the accuracy of signals. Sometimes it can involve 3 timeframes. Attention! As you know, a trader's deposit is exposed to a risk in the Forex market. Especially, this should be ta
https://youtu.be/KHhg88fXWTk?si=ZoVtpc-wpfTVImSL
5-Minute Trading Strategy | Quick & Effective for Beginners Welcome to our trading channel- the deepak trading In this video, we'll be exploring a simple 5-minute trading strategy that can help you capture quick market movements and make profitable trades. Whether you're a beginner or an experienced trader, this strategy is designed to give you clear entry and exit points using technical indicators like EMA, RSI, and Stochastic Oscillator.
FREE

Real Quants Forex Volatility Catcher for MT5 Introduction Real Quants Forex Volatility Catcher is a cutting-edge automated trading system designed specifically for MetaTrader 5. Developed through advanced machine learning and exhaustive data mining techniques, this system offers traders a robust strategy for navigating the complex terrains of the forex markets. With a commitment to rigorous testing that includes Monte Carlo simulations, walk-forward matrix optimization, and live execution valida
FREE

This indicator is based on Mr. Mark Fisher's ACD strategy, based on the book "The Logical Trader."
- OR lines - A lines - C lines - Daily pivot range - N days pivot range - Customizable trading session - Drawing OR with the desired time Drawing levels A and C based on daily ATR or constant number - Possibility to display daily and last day pivots in color zone - Displaying the status of daily PMAs (layer 4) in the corner of the chart - Show the order of daily pivot placement with multi-day piv
FREE
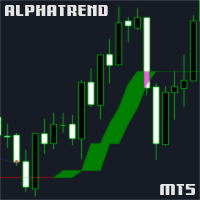
Overview: The AlphaTrend Indicator is a custom technical analysis tool designed for the MetaTrader 5 (MT5) trading platform. This indicator uniquely combines the Average True Range (ATR) and the Money Flow Index (MFI) to offer traders a novel approach to trend analysis and potential reversal points in the market. Key Features: ATR-Based Trend Analysis: Utilizes the Average True Range (ATR) to assess market volatility, aiding in identifying potential trend reversals. MFI Integration: Incorporates
FREE

Indicators are for trend followers!
A trading system constructed by three moving averages. Trade with the trend and let profits run. Necessary for traders: tools and indicators Waves automatically calculate indicators, channel trend trading Perfect trend-wave automatic calculation channel calculation , MT4 Perfect trend-wave automatic calculation channel calculation , MT5 Local Trading copying Easy And Fast Copy , MT4 Easy And Fast Copy , MT5 Local Trading copying For DEMO Easy And Fast Copy ,
FREE

Introduction
Auto Chart Alert is a convenient tool to set alert for your trading in your chart. With Auto Chart Alert, you can set the alert line in one click in your desired location in your chart. You can even set alert over the sloped lines in your chart. Auto Chart Alert is a great tool when you have to watch out importnat support and resistance levels for your trading. You can receive the sound alert, email and push notification when the price hit the alert line at you desired location. Au
FREE
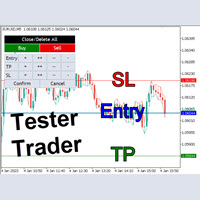
The Tester Trader EA is designed to simulate your manual trading strategy in the strategy tester. By default this is not possible and manual trading is completely disabled in the MT5 strategy tester. This tool helps you to open, manage and close orders and positions easily using action buttons in the chart. Forward testing your manual trading strategy can be a real pain. Time moves slow and it can take days or months to fully test a manual trading strategy. With this tool you can simulate forwar
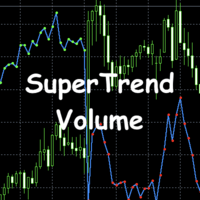
This indicator combines SuperTrend with Volume Profile. Main features are: SuperTrend Component: Works based on ATR (Average True Range) Determines trend direction (up/down) Customizable with ATR Period and ATR Multiplier parameters Shows trend direction with blue line Volume Profile Component: Analyzes trading volume for a specific period Detects volume trends Customizable with VPPeriod and VPLookback parameters Signal System: Shows arrows at trend changes Green arrow at uptrend start (buy sign
FREE
ADX_Expert is structured based on a specific technical analysis indicator ( Average Directional Movement ). It has many parameters so that each user can find the appropriate settings that suit their investment profile. It can work on 28 different pairs, one pair per chart. The default parameter settings are indicative, I recommend that each user experiment to find their own settings.
FREE

Volume Analysis Trader looks at volume using a fixed average of volume. This averaging helps spot when volume is rising or declining. Also I have added volume spikes which are when volume suddenly is above the average. These help spot market reversals.
This will hep a trader look for the following in their trading:
Rising volume during a rally shows trend is strong. Falling volume on a rally shows trend is weakening. As a rule of thumb on daily charts if current volume is higher than yesterda
FREE

Start earning profits by copying All trades are sent by our successful Forex trader & are extremely profitable. You can earn profits by copying trades daily Trial Period included You'll also get access to extremely powerful trading education which is designed in a simple way for you to become a profitable trader, even if you have no trading experience. https://ec137gsj1wp5tp7dbjkdkxfr4x.hop.clickbank.net/?cbpage=vip
FREE

Work logic
Stop Out utility is a simple but very convenient indicator showing how many points are left to the Stop Out level /
Its benefit lies in the fact that many traders deliberately overestimate the risk in trading in pursuit of profit, use the available margin at the maximum, and for this case it is very important to know where the broker can forcibly close your positions.
Just place the indicator on the chart and depending on the open position in Buy or Sell, you will see the border m
FREE

Experience the exhilarating world of trading with Boom or Bust, the groundbreaking MT5 trading game that takes your skills to the next level. Get ready to embark on a thrilling journey of virtual trading, where you can test your strategies and immerse yourself in the dynamic world of financial markets—all without risking real money. Experience the exhilarating world of trading with Boom or Bust, the groundbreaking MT5 trading game that takes your skills to the next level. Get ready to embark on
FREE
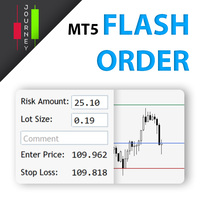
Trading has never been easier! Let's check this out! MT4 version: https://www.mql5.com/en/market/product/72118 The story: How I boost up my trading speed without any "Invalid SL or TP" error
NOW ALL YOU NEED TO DO IS Drag the lines Press Open Order button Enjoy! With this tool, you will no longer have to enter prices manually, which can cause many mistakes and you could miss the trade! From the board, we have: Risk Amount : the risk you want to apply for your trade Risk Unit : USD : If sele
FREE

VolumeFlow is a Volume Accumulation / Distribution tracking indicator. It works in a similar way to OBV, but it is much more refined and includes the options to use: Classical Approach = OBV; Useful Volume Approach; Gail Mercer's approach; Input Parameters: Input Parameters: Approach Type: Explained above; Volume Type: Real or Ticks; Recommendations: Remember: The TOPs or BOTTONS left by the indicator are good Trade Location points. This is because the players who were "stuck" in these regions w
FREE

In which direction should I trade today? For “TREND followers”, we need to determine the TREND . This indicator determines the Trend based on the price High, Low and Close of every bar, for a given period and timeframe. Calculating and plotting the Trend UP and Trend DOWN lines. If the: “Trend UP” line (Green) is above the “Trend DOWN” line (Red), then it is a BULLISH Trend (see "Screenshots" tab). “Trend DOWN” line (Red) is above the “Trend UP” line (Green), then it is a BEARISH Trend (see "
FREE

The MP Andean Oscillator is used to estimate the direction and also the degree of variations of trends. It contains 3 components: Bull component, Bear component and Signal component. A rising Bull component indicates that the market is up-trending while a rising Bear component indicates the presence of down-trending market. Settings: Oscillator period: Specifies the importance of the trends degree of variations measured by the indicator. Signal line per: Moving average period of the Signal line
FREE
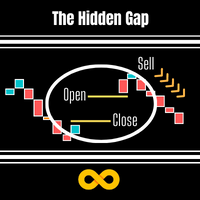
This EA is based on the Indice gaps between todays open price and yesturdays closing price. On Metatrader these are not shown as we only see a 24hr chart. If we want to know the gap between the open at 16:30 and yesturdays close at 23:30 on the SP500 this EA will reveal the gap. On Indices these types of Gap close approximately 60% of the time within the same day and is demonstrated on the panel which records previous gap closures and provides to the user a statistical proof of gaps closing for
FREE

The Forex Gangster Indicator allows you to determine the current trend. If the Forex Gangster Indicator line has moved below the price and turned blue, then you should open deals for an increase. If the Forex Gangster Indicator line has appeared above the price and turned red, then you should open deals for a decrease: The indicator is suitable for any time frames, but it needs to be supplemented with filtering indicators, since by itself it is late and does not have time to give an accurate si
FREE

Implied Fair Value Gap ICT Indicator MT5 The Implied Fair Value Gap ICT Indicator MT5 is a powerful tool designed to uncover hidden price inefficiencies within the MetaTrader 5 platform. This indicator employs a specialized method by plotting two theoretical lines at the midpoint of the shadows of consecutive candles, marking the space between them as an implied fair value gap. It's important to note that if the shadows of the neighboring candles fully overlap, no hidden fair value gap is formed
FREE

Offer of a pack of all our EAs, with support and updates.
This Expert Advisor (EA) has been specifically developed to trade BTC on the H1 timeframe for the Exness broker , which operates on a key time difference of UTC+0 , unlike most brokers that use UTC+2. This time difference is crucial as it affects the synchronization of strategies and candle analysis, allowing for greater precision in decision-making when using this EA on Exness. Introducing BTC AI Temporalidad H1 - Your
FREE
Our Forex Trading Bot specializes in executing trades on two major currency pairs: XAUUSD (Gold/USD) and AUDCAD (Australian Dollar/Canadian Dollar) . Designed with simplicity and efficiency in mind, this bot employs a straightforward strategy that combines technical analysis with dynamic risk management. For XAUUSD , the bot focuses on identifying trends in gold prices, leveraging key indicators like moving averages and RSI to pinpoint optimal entry and exit points. The bot capitalizes on gold’s
FREE

With Break Even Trader placed onto your chart, it will automatically place the stop loss and take profit levels when you open a buy or sell order. And when you are in profit by the amount defined in user settings, it will automatically move your stop loss to that break even level, thereby protecting your trade from a loss. Features :
Simple to trade with you just enter your trade it will place the stop loss and take profit as input in user inputs. Sends you an alert when your trade is in profit
FREE
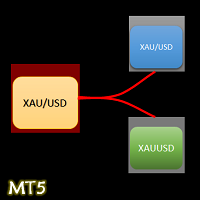
- The Symbol Changer Utility for MetaTrader is a tool that enables traders to switch between various symbols on the MetaTrader trading platform easily and quickly. - It is designed to change the symbol of the current and all open chart windows and the timeframe of the current chart window (by clicking the button). - The tool retrieves symbols from the Market Watch, displaying only the necessary symbols in the market watch.
FREE

Tops & Bottoms Indicator FREE Tops abd Bottoms: An effective indicator for your trades
The tops and bottoms indicator helps you to find ascending and descending channel formations with indications of ascending and/or descending tops and bottoms. In addition, it show possibles opportunities with a small yellow circle when the indicator encounters an impulse formation.
This indicator provide to you more security and speed in making entry decisions. Also test our FREE advisor indicator:
FREE

The Expert Advisor tool has been developed for Nasdaq, based on Vortex and pending orders. The stop loss is based on fixed pips. It has been backtested on more than 10-year long M1 data with high quality of modeling. The enclosed screenshots demonstrate the complexity and coverage of the test by Monte Carlo analysis with 200 simulations. T he Expert Advisor passed via Cluster Analysis, Optimization profile, System parameter Permutation. There is no need to set up parameters - all settings are al
FREE

Discover the ATR Bands Indicator: Your ally in mastering volatility and optimizing your trades! The ATR Bands rely on the flagship Average True Range (ATR) indicator to measure volatility and plot dynamic bands around the price. These bands adapt in real-time to market fluctuations, giving you a clear view of critical price zones. Why choose ATR Bands? Detect strong trends: Breakouts of the bands signal significant price movements, ideal for spotting trading opportunities. Optimize your stop-los
FREE

TOPOS INDICATOR AND HISTORIC BACKGROUNDS The Indicator of historical tops and backgrounds is based on the monthly chart where sharks hide so it was developed to facilitate the identification of these regions. The available features are the Incoming Triggers alerts and notifications that are sent to the mobile phone. Parameters 1-) Tops and Bottoms: You can change the color of the lines and the period in years and the filter range between the top and bottom and the median and consider th
FREE

Kindly rate and comment about the product for upgradation & Support
The 5 EMA is plotted in green color ( Lime ).
The 14 EMA is plotted in red color ( Red ).
The 20 EMA is plotted in blue color ( Blue ).
The 200 EMA is plotted in yellow color ( Yellow ).
The Quarter EMA that provided calculates and plots four Exponential Moving Averages (EMAs) on the chart using different periods: 5, 14, 20, and 200. Each EMA is represented by a different color on the chart. Here's a description of each EMA:
FREE

Value Chart indicator presents the Price evolution in a new form. This indicator, Price Momentum , was developed taking all the calculations presented in the book " Dynamic Trading Indicators " by Mark W. Helweg and David Stendahl (2002). The technique involves de-trended Prices from a user-defined Period of analysis and the addition of a Volatility index correction. The result is an Oscillator with 3 zones: Fair Price Value, Overbought/Oversold and Extremely Overbought/Oversold zones. Adding th
FREE

Ultimate Range Master EA: The Ultimate 4-in-1 Range Trading Solution Overview
The Ultimate Range Master EA is a cutting-edge expert advisor designed for traders who thrive in range-bound markets. Offering four distinct and powerful range trading strategies, this all-in-one EA provides unparalleled flexibility, precision, and automation to suit your trading style. Key Features Time Range Strategy Define the start and end times for a market range, and let the EA take control. Trades breakout oppo

You must add the address ' http://ec.forexprostools.com/ ' in the list of allowed URL tab 'Tools/Options/Advisors' Check out our MFI Version: https://www.mql5.com/en/market/product/75573
Live Signal:
https://www.mql5.com/en/signals/1286661
Please note that you will need to optimize and customize to your broker.
With FNG Advisor you are able to make strategies that best fit you and your trading style.
Features: Filter indicators: Envelopes, BEAR/Bull, Moving Average, Williams' Percent Rang
FREE

Volume Weighted Average Price (VWAP) is a trading benchmark commonly used by Big Players that gives the average price a Symbol has traded throughout the day. It is based on both Volume and price. This indicator contains Daily VWAP and MIDAS' VWAP, which means you are able to anchor the beggining of MIDAS' calculations and, therefore you will be able to use this methodology to study price versus volume moves after anchor point. You will be able to anchor up to 3 HIGH MIDAS VWAP's and 3 LOW.
Wish
FREE

TimeBar TimeBar is a simple information indicator that shows the remaining time until the bar closes, as well as the time elapsed since the bar opened and the current time. For ease of perception, two types of display modes have been added: in the form of a comment in the upper left corner of the graph, or in the form of a graphic object.
Advantages Font selection Font size. You can set any one. When commenting it is too small You can move objects. Any time can be selected by double clicking t
FREE

Moving Average Color
Moving Average (MA) is a trend indicator, which is a curved line that is calculated based on price changes. Accordingly, the moving average is the trader’s assistant, which confirms the trend. On the chart it looks like a bending line that repeats the price movement, but more smoothly. Moving Average Color it is a standard moving average indicator with a color change when the trend direction changes. The ability to set additional levels has also been added. It is a handy too
FREE

EA Free for the rest of the week ! Please test and comment ?? Sky is the Limit EA works very nice but read below and test in all case. It is trading on Supporting and Resistance levels ! See the Settings picture for the ulitmate settings I use ! It does have a SL setting but i found that, whatever i made it, the market will trigger it. I found that Long trades do better. Suggestion is to set Sell=0 or =1. It is possible that in a bullish market, long trades work better. I will be adding filt
FREE
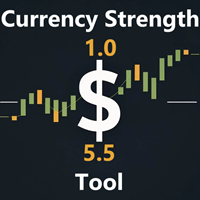
" Currency Strength Tool " is a straightforward and user-friendly indicator designed for analyzing the strength of eight major currencies based on daily price changes of currency pairs. It displays information compactly on the chart in three rows, providing traders with insights into current market dynamics. The indicator serves as an analytical tool, aiding in making informed trading decisions.
It appears as follows: -7.3% 0.5% 0.2% 6.4% 1.2% 3.2% 4.1% 0.4% (daily change) USD E
FREE

Initiated in 1995 by the physicist and technical analyst Paul Levine, PhD, and subsequently developed by Andrew Coles, PhD, and David Hawkins in a series of articles and the book MIDAS Technical Analysis: A VWAP Approach to Trading and Investing in Today's Markets.Latterly, several important contributions to the project, including new MIDAS curves and indicators, have been made by Bob English, many of them published in the book.
FREE

If you like this project, leave a 5 star review. Trading large volumes requires us to look at multiple instruments/charts to
find new opportunities, this indicator will help you by plotting specific
levels by the multiple of a number or its suffix and update them automatically
as the price changes, a task that would otherwise be tedious. For example, on GBPUSD, you could have 4 instances of the indicator on the
chart to plot: Each 0.01 intervals with line length of 100 bars. Each price ending in
FREE

The Stochastic RSI (StochRSI) is a technical indicator that combines the characteristics of the Relative Strength Index (RSI) with the Stochastic Oscillator, resulting in a more sensitive tool that generates a higher number of trading signals. Developed by Tushar Chande and Stanley Kroll, the indicator was designed to overcome a perceived limitation of the traditional RSI: the low frequency of overbought and oversold levels activation (commonly 80 and 20), especially in less volatile assets. Ho
FREE

Este robô foi criado exclusivamente para operar no ouro (XAUUSD) e funciona melhor em timeframes médios (M30, H1) . Diferente de scalpers tradicionais, o Best Scalper XAUUSD 30min foca em reversões de tendência , utilizando indicadores avançados como RSI, Bandas de Bollinger e Price Action . A estratégia é baseada em detectar níveis críticos de suporte e resistência , onde o mercado tem uma grande probabilidade de inverter a tendência. Ele combina essa análise com volatilidade intradiária , gar
FREE

Market Maker X Model Indicator MMXM MT5 The Market Maker X Model Indicator (MMXM) is a strategic trading tool designed to detect price movement patterns and trend reversals. This indicator analyzes market flow, tracking the interaction between buyers and sellers to help traders understand liquidity shifts and key price zones more effectively. «Indicator Installation & User Guide» MT5 Indicator Installation | Market Maker X Model mmxm ICT MT4 | ALL Products By TradingFinderLab | Best MT5 In
FREE
EMA Line Visualizer with Trend Analysis Description:
The Exponential Moving Average (EMA) Line Visualizer EA plots multiple EMAs on your chart (25, 50, 100, 200, and a custom EMA) and analyzes real-time trend direction. It detects whether the market is currently in an Uptrend , Downtrend , or Flat condition based on the latest EMA relationships. Features: Multi-EMA Display
Plot multiple EMAs with customizable periods. Custom Colors
Set distinct colors for each EMA line for better visual trac
FREE
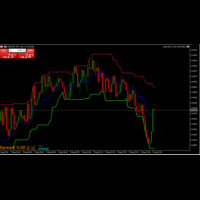
The Donchian Channel Indicator I created is a powerful tool for analyzing price trends and volatility. By plotting the highest high and lowest low over a specified period, it helps identify potential breakout opportunities and trend reversals. This indicator is valuable for traders seeking to understand market dynamics and make informed decisions based on price movements. Its simplicity and effectiveness make it an essential addition to any trading strategy.
FREE
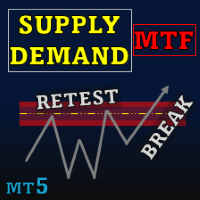
Special offer : ALL TOOLS , just $35 each! New tools will be $30 for the first week or the first 3 purchases ! Trading Tools Channel on MQL5 : Join my MQL5 channel to update the latest news from me Supply Demand Retest and Break Multi Timeframe , this tool plots supply and demand zones based on strong momentum candles, allowing you to identify these zones across multiple timeframes using the timeframe selector feature. With retest and break labels, along with customizable valid
Higher Timeframe Candles Viewer Description A MetaTrader 5 indicator that visualizes the opening and closing levels of higher timeframe candles on your current chart. Designed to simplify multi-timeframe analysis by highlighting key price levels from larger intervals. Key Features: Displays open/close lines of higher timeframe candles. Customizable colors for bullish and bearish candles. Auto-updates on timeframe or date changes. Clean removal of graphical objects when the indicator is deleted.
FREE

JCAutoStm 简繁塞壬模型 1.Zigzag3浪,大中小三浪代表市场潮流、趋势、涟漪。 2.自动识别当前三浪的走势,命名每一种结构形态。 Zig123下跌3浪5浪7浪:D3/D5/D7,下跌中继形态:DRF1/DRF2/DRF3,底部反转形态:BRP1,BRP2,BRP3,特殊结构下跌5浪后底部反转结构Zig123D5BRP1/2 Zig123上涨3浪5浪7浪:U3/U5/U7,上涨中继形态:URF1/URF2/URF3,顶部反转形态:TRP1,TRP2,TRP3,特殊结构上涨5浪顶部反转结构Zig123U5TRP1/2 3.趋势线绘制,分别以大中小三浪相邻的高低点进行绘制。 绘制的原则是,收敛形态。 4.三浪有效SR,F3,F6,F12,F15,绘制水平线。 MACD背离线
FREE

## Version 2.50
I created this EA with the intention of making it free for everyone to use. It serves as a tool to assist in trading with money management, entering order lots according to a percentage of the account balance, and automatically setting TP/SL based on high/low prices.
In Version 2.50, The Auto TP/SL feature adjusts from the Line In (entry point), and Auto price in this version only shifts the entry line to the current price. Input settings: Ato update SL/TP Line >>> In version
FREE

Judas Swing ICT Forex without confirmation MT5
The Judas Swing ICT Forex without confirmation Indicator is designed to recognize and interpret deceptive market movements within forex and stock trading. It pinpoints situations where the market executes a misleading move to entice traders before swiftly reversing direction. This tool is widely used in ICT trading methodologies and technical market analysis. «Indicator Installation & User Guide» MT5 Indicator Installation | Judas Swing ICT Forex
FREE

Performs export of the transaction history of the current trading account. The file is saved in the data folder, which can be opened through the main menu of the terminal: File -> Open Data Directory (Ctrl+Shift+D) and go to folder MQL5/Files . The file name is generated automatically or set manually through the script parameters. The history file can be used to analyze the history in Excel (may need to be opened through the Import Wizard) or to simulate the same sequence of
FREE
The MetaTrader Market is a simple and convenient site where developers can sell their trading applications.
We will help you post your product and explain you how to prepare your product description for the Market. All applications on the Market are encryption-protected and can only be run on a buyer's computer. Illegal copying is impossible.
You are missing trading opportunities:
- Free trading apps
- Over 8,000 signals for copying
- Economic news for exploring financial markets
Registration
Log in
If you do not have an account, please register
Allow the use of cookies to log in to the MQL5.com website.
Please enable the necessary setting in your browser, otherwise you will not be able to log in.