YouTube'dan Mağaza ile ilgili eğitici videoları izleyin
Bir alım-satım robotu veya gösterge nasıl satın alınır?
Uzman Danışmanınızı
sanal sunucuda çalıştırın
sanal sunucuda çalıştırın
Satın almadan önce göstergeyi/alım-satım robotunu test edin
Mağazada kazanç sağlamak ister misiniz?
Satış için bir ürün nasıl sunulur?
MetaTrader 5 için ücretli teknik göstergeler - 67
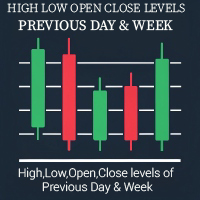
Revolutionize Your Chart Analysis with "Previous Daily Weekly HLOC Levels"! The Previous Daily Weekly HLOC Levels indicator is a must-have tool for traders who want to sharpen their technical analysis. This intuitive and powerful indicator automatically plots the High, Low, Open, and Close levels of the previous day and week on your chart, giving you a clear view of critical support and resistance zones. Key Features: Daily and Weekly Levels: Effortlessly displays the High, Low, Open, and Clos
I'll keep it Short and to the point. Let Your Backtest Results Speak for Themselves. After much deliberation, we’ve decided to release the foundational logic behind our process for public use.
This isn’t about changing the way you trade—because we know that’s unique to you. The best ways to enter a position? Those have always been confidential ! What we can share is the first of three essential steps we use before entering any trade. This tool is designed to keep you on the right side of the m

Introducing to your attention the unique trading system/indicator "Scaled Vidya Trends", designed for dynamic scalp trading on trend volatility pairs hour + timeframes.
Main features of Scaled Vidya Trends:
-Multi-level market analysis: it works on H1, H2, H3 timeframes; -Uses the most popular currency pairs: EURUSD, GBPUSD, USDCAD. Brokers usually set one of the lowest spreads for these pairs; -Applies a scalping method based on local targets for signals; -Signals appears at the new open of

The Easy Trend Trading Indicator delivers quick and accurate BUY/SELL signals, ensuring that traders can make timely decisions. It works flawlessly across various timeframes and supports all symbols, making it a versatile tool for any market. Whether you're trading short-term or long-term, this indicator adapts to your needs with ease. Quick Setup: Simply "Enable" the indicator via input settings With a low memory footprint, the indicator is designed for efficiency, ensuring smooth performance e
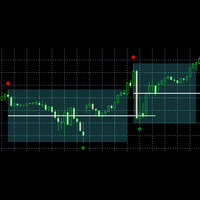
Based on concept of Zones from DTFX.
Video 2
Daves suggest using a length of 25 for optimal performance. But it's up to you to decide based on backtest/forwardtest results.
How this indicator draw zones
In bullish scenario, first it will find a swing high, then a swing low, then a break of with price closed above the swing high. But the way it find swing high and low heavily depends on structure length value. If you set structure length as 12: to find swing high it will check 13th candle high
Overview "L3 Counter Peacock Spread" is a comprehensive technical analysis indicator for MetaTrader 5, developed by Blackmill Solutions UG. It employs a sophisticated combination of multiple moving averages, K-lines, and weighted analysis to provide traders with a robust set of visual tools for market analysis. Key Features Multiple Moving Average Analysis Combines short and long-term moving averages (MA1, MA3, MA10, MA30) Utilizes both Simple Moving Averages (SMA) and Weighted Moving Averages

Volume Weighted Average Price (VWAP) is a measure that combines price and volume data to reflect the average price at which a security has traded throughout a specific period. This indicator calculates the VWAP based on your selected timeframe and plots it on the main chart. It automatically identifies new sessions for the chosen timeframe and resets the calculation accordingly, ensuring that the displayed VWAP remains current. Use VWAP MTF to observe areas where trading activity is concentrate

This indicator computes a rolling version of the STARR Ratio (Stable Tail Adjusted Return Ratio) over a specified number of bars and plots both the STARR Ratio and its Moving Average (MA). Unlike some original STARR Ratio implementations, this adaptation uses a rolling window of logarithmic returns and calculates Conditional Value-at-Risk (CVaR) at a given confidence level. By comparing the rolling average return to the magnitude of CVaR, it provides a metric for how returns stack up against wor
Introducing to your attention unique trading advisor, Squeeze roc xau points, exclusively designed for trading on the XAU/USD pair. We analyzed predominantly all objectively important timeframes and identified unique characteristics of gold movements relative to the dollar to create this product. These insights can be extremely useful in predicting market reversal points on timeframes from M30 to H8 for the XAU/USD pair. You can choose your favorite timeframe to receive signals or use multiple
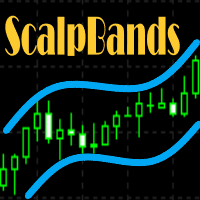
This indicator is designed for scalping Gold, BTC, US30, GBPUSD, and can also be used on any financial instrument. It does not repaint, erase past signals, and it is not lagging. The indicator is a combination of two well-known indicators: Bollinger Bands and TD Sequence. It has a relatively high win rate; however, it is not a complete system and should be used in conjunction with other indicators to filter noise, increase the win rate, and is intended for experienced scalpers. Always set reaso

Take the stress out of trading with the Buy Sell Chill Indicator —your ultimate companion for effortless trend identification. This easy-to-use tool gives you a clear visual arrow to show the direction the market is about to take, making trading decisions as simple and "chill" as possible. Why Choose the Buy Sell Chill Indicator? Relaxed and Intuitive : Designed to make trading less stressful and more enjoyable by giving you straightforward signals with no clutter. Customizable Features : ATR Pe

Four MA on OBV - Başarılı Ticaret İçin Nihai Kılavuzunuz! Four MA on OBV göstergesi ile işlemlerinizin gerçek potansiyelini ortaya çıkarın. MetaTrader 5 platformu için özel olarak tasarlanan bu güçlü gösterge, dört hareketli ortalamayı ve On-Balance Volume (OBV) ile birleştirerek doğru ve güvenilir sinyaller sağlar. Teknik Özellikler: Dört Hareketli Ortalama: Ayrıntılı trend izleme için basit, üstel, düzleştirilmiş ve doğrusal hareketli ortalamaların entegrasyonu. OBV Analizi: Fiyat değişikli

Mtf Candle – An Advanced Tool for Your Trading Strategy Analyze the market, identify trends, and enhance your strategy! Mtf Candle is an innovative indicator designed for professional traders, offering a clear and structured way to visualize market dynamics. With this tool, technical analysis becomes structured and easily accessible. What Does Mtf Candle Offer? In-depth Bar Analysis – Monitor bars across multiple timeframes and determine whether they indicate an uptrend or downtrend. Precise St
Introducing to your attention a unique trading advisor "Detrended scalper jpy points" indicator, designed for trading with major JPY crosses.
The idea is based on a modified indicator, detrended price oscillator, whose task is to eliminate the influence of the trend on price movements. This greatly simplifies the process of determining overbought/oversold cycles. The focus is on analyzing short cycles: long market cycles consist of several short ones. By analyzing the short components, we can
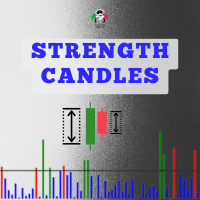
Indicator in histogram format, which is calculated using data on financial volume, tick volume and the body of the bar.
It is possible to visualize moments where there was a large entry of volume, both financial and in ticks, and that the market managed to progress and advance in one direction (up or down) due to the size of the bar body, which is where there really was a victory for one side of the negotiation (buyers and sellers).
By default, all bars in the indicator's histogram are colore
The Moving Average indicator remains one of the most popular tools in trading due to its simplicity, adaptability, and effectiveness in identifying market trends. Its role as a foundational tool for other technical indicators further cements its importance in both traditional and modern trading strategies.
The Multi MA indicator has 8 Moving Averages which can be plotted simultaneously using a unique set up of each MA.
Make Your Trading Simple dan Profit Again !

MACD indicator, first indicator, loading 3 cycles, 3 windows, 5-minute, 1-hour, 1-day chart, accurate comparison ,Can be used in conjunction with my EMA metrics, The other moving average indicator I sell on MQL5 can prevent volatile market conditions, The signal line needs to be fixed after the color changes, and then the signal direction can be confirmed,For example, for a 5-minute chart, you need to wait until the next 5 minutes to confirm that the signal direction is good

DYJ BoS göstergesi, piyasa yapısındaki değişimlerin temel unsurlarını otomatik olarak belirler ve işaretler, bunlar arasında şunlar yer alır:
Yapının Kırılması (BoS): Fiyatın önceki bir yapı noktasını kırarak önemli bir hareket yapması durumunda tespit edilir.
Olası yükseliş trendi çizgilerini ve düşüş trendi çizgilerini (UP & DN, yani sürekli yeni zirveler ve yeni dipler) işaretler ve fiyat bu çizgileri aştığında kırmızı (AYI) ve yeşil (BOĞA) okları işaretler
BoS genellikle fiyatın önceki f

Trade with Confidence: Understand the highs and lows of each session with live comparisons to previous period changes. Monthly Movement Tracking: Compare this year's performance with last year's to gauge market sentiment. Percentage Change Analysis: Helps avoid overpaying or underselling by showing price movement changes. Profit Overview: Instantly view your profit for different periods, including daily, weekly, and current values. Symbol Performance: Track the movement of any selected trading
The principle behind this indicator is lost,In theory, In theory, it can load infinitely on the chart, but requires different parameters,Recommend 5, 10, 20,This indicator is more accurate in 5 minutes, 1 hour, and 1 day,Can be combined with my MACD to use together, https://www.mql5.com/zh/market/product/129184?source=Site +Profile+Seller ea, Indicator,Strategy Analysis,strategy optimization,Need to write,Provide strategy,Write EA, indicators,contact Telegram @r24231

HistoEdge Indicator Welcome to the world of precision trading tools! Introducing HistoEdge, a powerful and customizable MetaTrader 5 indicator designed to provide you with the insights you need to make informed trading decisions. Please note: HistoEdge is not optimized by default; it is designed for traders like you to fine-tune and unleash its full potential according to your strategies. Key Features
Advanced MACD Histogram Visualization:
Utilizes the MACD (Moving Average Convergence Divergenc

Introducing the DivergenceSpotter Indicator!
Note: This indicator is not pre-optimized—it’s crafted for you to customize and optimize to suit your unique trading strategies! The DivergenceSpotter Indicator is your ultimate tool for identifying divergences in the market, giving you an edge in spotting potential trend reversals and continuation opportunities. Whether you're a novice trader or a seasoned expert, this powerful tool is here to elevate your trading game. How It Works:
The DivergenceS

MACD Momentum Shift Unleash the Power of Momentum in Your Trades
The "MACD Momentum Shift" is an advanced trading indicator based on the renowned Moving Average Convergence Divergence (MACD). It’s crafted to give you the tools you need to optimize and adapt it for your personal trading style. Your Customizable Edge
This indicator isn't pre-optimized—it's designed for you to take control. Modify MACD fast, slow, and signal periods, as well as the delay between signals, to suit your preferred str

Introducing the Phoenix RSI Indicator – your gateway to mastering market momentum and identifying profitable trading opportunities! Designed for traders who value control, this indicator comes pre-equipped with powerful features but is intentionally left unoptimized to empower YOU to tailor it to your unique trading strategy. What Makes the Phoenix RSI Indicator Special? Customizable RSI Analysis: Visualize market momentum with a sleek RSI line directly on your chart. Adjust the RSI period to s

Introducing "Dragons Pulse"
Are you ready to take your trading strategies to the next level? The Dragons Pulse Indicator is a powerful tool designed with flexibility in mind, empowering you to optimize it according to your unique trading style. While not pre-optimized, this indicator provides you with a foundation to unleash your creativity and craft strategies that truly work for you! Key Features: RSI-Based Insights: Uses the trusted Relative Strength Index (RSI) to analyze market momentum. P

Storm Seeker Indicator
Unleash the power of precision trading with the Storm Seeker Indicator! This tool is designed for traders who want to take charge of their strategies by customizing and optimizing a powerful divergence-based system. Why Choose Storm Seeker? Divergence Analysis: The indicator identifies potential reversals by detecting divergences between price action and the RSI oscillator, giving you clear buy and sell signals. Visual Clarity: Green arrows indicate potential BUY opportun

Crystal Cross RSI Introducing the Crystal Cross RSI indicator—crafted for traders who seek control over their strategy! This tool is not pre-optimized, leaving room for you to fine-tune and adapt it to your trading style. Key Features: Clear Buy and Sell Signals: Lime arrows highlight buy opportunities, while red arrows signal sell entries—keeping your decisions sharp and informed. Dynamic RSI Analysis: The blue RSI line tracks market momentum, complemented by a signal line for precise crossing

Desert Mirage Indicator Take your trading to the next level with the Desert Mirage Indicator! Designed with flexibility in mind, this tool is your ultimate companion for identifying lucrative opportunities in the forex market. Please note: this indicator is not optimized—it’s built for you to customize and tailor to your unique trading style! Key Features: RSI-Based Signals: Harness the power of the Relative Strength Index (RSI) to spot overbought and oversold market conditions with ease. Gener

Introducing the Thunder Wave Indicator
The Thunder Wave Indicator is a powerful tool designed for traders who love to optimize and tailor their strategies. This indicator is not pre-optimized, giving you full control to adjust it according to your trading style and market conditions. Why Choose Thunder Wave?
The Thunder Wave Indicator leverages the Relative Strength Index (RSI) to deliver actionable insights, while incorporating delay and visualization features to ensure precision and clarity.

Welcome to the Ocean's Gate Stochastic Indicator! Note: This indicator is not optimized by default—it has been crafted for you to tweak and optimize based on your unique trading style! Dive into precise decision-making with this advanced trading tool that harnesses the power of the stochastic oscillator. The Ocean's Gate Stochastic Indicator not only visualizes overbought and oversold conditions but also identifies critical crossovers, allowing you to anticipate market movements with confidence
Mountain Echo Indicator
Your key to uncovering trade opportunities, designed for custom optimization.
Price: $65 Key Features:
Visual Buy and Sell Signals
The indicator places visually appealing arrows directly on your chart: Lime Green Arrows indicate potential buy opportunities. Red Arrows signal potential sell opportunities. Customizable Stochastic Parameters
Includes key inputs like: %K Period (default: 14) %D Period (default: 3) Slowing (default: 3) Bars to Wait Between Signals (default: 1

STRICTLY FOR BOOM INDEX ONLY!!!!! Here I bring the Maximum Trend Arrows OT1.0 MT5 indicator. This indicator is made up of a combination of different trend indicators for entries and exits, for entries an orange arrow will paint on the chart below the current market and a red flag for closing of trades and it produces buy arrows only. When the orange arrow appears, it will appear along with it's sound to notify you. The 1H timeframe is recommended, don't use it anywhere else than on the 1H timefr

Introducing the Star Path Stochastic Cross Indicator Ready to explore your trading potential? The Star Path Stochastic Cross Indicator is here to guide your path. Designed for traders who love flexibility, this indicator is not optimized, giving YOU the freedom to tailor it to your strategies. Whether you're a beginner or an experienced trader, this tool is the perfect addition to your toolkit. The Logic Behind the Indicator
This indicator leverages the powerful stochastic oscillator to identif

Introducing Wind Dancer Indicator Ready to take control of your trading journey? The Wind Dancer Indicator is here to empower your strategies with a unique, visually intuitive approach. Designed with flexibility in mind, this indicator is not optimized, giving you the creative freedom to fine-tune and adapt it to your specific trading needs. How Does the Wind Dancer Indicator Work? The logic behind the Wind Dancer Indicator is a blend of sophisticated signals and a seamless visualization algori

Introducing the River Flow Divergence Indicator Are you ready to unlock your trading potential? Meet the River Flow Divergence Indicator, a powerful tool designed to help you navigate market trends and reversals with precision. This indicator is tailored for traders who are eager to fine-tune their strategies and take control of their success. Note: This indicator is not optimized out of the box. It’s crafted for you to customize and optimize according to your unique trading style and goals. Ho

Discover the untapped potential of market range trading with the Forest Shadow Indicator! Designed for traders who want to optimize their strategies, this tool provides raw, powerful insights into market trends and turning points. Note: The indicator is unoptimized, offering you full flexibility to tailor it to your unique trading needs. Core Logic:
The Forest Shadow Indicator uses a combination of stochastic momentum and visual signals to highlight potential buy and sell zones within range-bou

ZLMA Trend Candles indicator uses an enhanced Zero-Lag Moving Average to highlight key trend shifts, repainting candles in real time. It reacts faster than traditional moving averages, helping you spot potential market turns earlier. Gain clear entry and exit signals and filter out market noise with ease! This product is also available for MetaTrader 4 => https://www.mql5.com/en/market/product/129279 1. What Is ZLMA Trend Candles?
ZLMA Trend Candles is a MetaTrader 4/5 indicator based on the Z
Индикатор ProfitAndDistance.
Этот пользовательский индикатор для MetaTrader 5 предназначен для отображения полезной информации о текущих позициях и их прибыли прямо на графике. Он автоматически обновляется каждую секунду и отображает важные данные, такие как прибыль, расстояние до последней открытой позиции, количество открытых позиций и тип последней сделки. Индикатор будет полезен как новичкам, так и опытным трейдерам, желающим легко отслеживать свои позиции в реальном времени. Основные особе

Moon Touch Indicator
Unlock the full potential of your trading strategy with the Moon Touch Indicator! This advanced tool is designed for traders who want to fine-tune their approach and optimize their results. While the indicator isn't pre-optimized, it gives you the flexibility to tailor it perfectly to your trading style and market conditions. How Does It Work?
The Moon Touch Indicator is a versatile signal tool that works by identifying key market conditions: Buy and Sell Signals: Clearly m

Not Optimized – Created for Your Custom Optimization!
Introducing Diamond Crush – your pathway to mastering market squeezes! This indicator is designed to identify powerful trading opportunities by analyzing market conditions and visualizing key areas of market compression and expansion. Why Diamond Crush? Band Squeeze Analysis: Harness the power of dynamic upper and lower bands to capture market volatility and trend shifts effortlessly. Buy & Sell Signals: Visual cues guide you through potenti

Solar Flare Indicator
The Solar Flare Indicator is a versatile and customizable tool designed for traders who value precision and adaptability. Built to empower traders of all levels, this indicator highlights key market dynamics to support strategic decision-making. Please note, the indicator is provided without pre-optimization, giving you the freedom to tailor its settings to your specific needs. Behind the Strategy – How It Works:
The Solar Flare is rooted in a combination of technical anal

Cosmos Dance Indicator The Cosmos Dance Indicator is your next powerful tool in financial trading, designed for traders who value precision and flexibility. This indicator is not pre-optimized, giving you the freedom to fine-tune and adapt it to your specific trading strategy. With Cosmos Dance, you hold the reins to enhance your trading edge. Key Features and Logic: Clear Buy and Sell Signals: Visual arrows for "Buy" (green) and "Sell" (red) opportunities, helping you identify potential market

Aurora Cross: Your Customizable Path to Trading Success! About This Indicator
The Aurora Cross Indicator is designed to empower traders to refine and optimize their strategies. It’s a versatile tool created specifically for you to customize and tailor to your unique trading approach. It is not pre-optimized, giving you complete freedom to experiment and find the perfect settings for your trading style. How It Works
At its core, the Aurora Cross Indicator leverages advanced technical analysis te

Unlock the Power of the Storm Break Indicator The Storm Break Indicator is a cutting-edge tool designed to identify precise market entry points using the proven logic of Bollinger Bands. While this indicator is not optimized out of the box, it offers you an exceptional opportunity to tailor it to your trading style and maximize its potential. What Makes the Storm Break Indicator Unique? Core Logic: The indicator leverages Bollinger Bands, a time-tested technical analysis tool, to identify overb

Unleash Market Volatility with the Titan Force Indicator! Are you ready to dominate the market by capitalizing on volatility? The Titan Force Indicator is your ultimate trading tool, designed for traders who thrive during periods of heightened market activity. Not Optimized for You – Yet! This indicator is a canvas for your creativity. It's been crafted to let you optimize it according to your unique trading strategies and preferences. Your skills, your edge! How Does the Titan Force Indicator

Lion’s Roar - Trend Strength Indicator Are you ready to take control of your trading journey? The Lion’s Roar - Trend Strength Indicator is here to help you identify and harness powerful market trends with precision and confidence. Designed with traders in mind, this advanced tool is built on a robust strategy that combines trend direction with momentum validation using the Average True Range (ATR). This indicator is not pre-optimized, giving YOU the freedom to tailor it to your unique trading
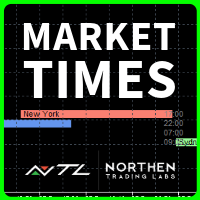
NTL Market Times Indicator The NTL Market Times Indicator for MT5 provides a clear unobtrusive display of the opening and closing times of the world’s major Forex trading centers. It automatically adjusts for UK daylight saving time, ensuring reliable market session information all year round. Main Features Major Markets: Displays New York, London, Frankfurt, Sydney, and Tokyo trading hours. Color-Coded Sessions: Each market session is uniquely color-coded for quick identification on the chart.
HLines User Guide Overview and Features The NTL HLines Indicator is designed to elevate your trading with precise support and resistance analysis. Utilizing a sophisticated algorithm, this MQL5 indicator scans for high-probability price levels across multiple timeframes, helping traders pinpoint strategic entry and exit zones. With fully customizable pivot scanning and multi-timeframe support, HLines provides a powerful, adaptable toolset for traders of all experience levels. Key features includ

Introducing the Falcon Turn Indicator Designed for customization and optimization, this indicator empowers traders to adapt it to their unique strategies. Why Choose the Falcon Turn Indicator?
The Falcon Turn Indicator leverages the power of the Parabolic SAR strategy to highlight potential buy and sell opportunities with precision and clarity. Perfect for trend-following enthusiasts and those who value flexibility in fine-tuning their trading tools. Key Features: Parabolic SAR-Based Signals: B

Wolf Signal Indicator Note: This indicator is not optimized and is designed for traders who prefer to tailor it to their unique strategies. It provides a robust framework, giving you the freedom to adjust parameters and refine its behavior to suit your trading style. Why Choose the Wolf Signal Indicator? The Wolf Signal Indicator is a powerful and versatile tool for identifying trading opportunities across multiple market conditions. Designed with precision, this indicator harnesses advanced al

Ocean State Indicator Unleash the Power of Precision Trading! Introducing the Ocean State Indicator, an innovative tool designed to elevate your trading experience. This indicator is a versatile, dynamic solution that equips you with the tools needed to analyze market trends and identify profitable entry and exit points. Priced at just $65, it’s an incredible value for traders seeking to optimize their strategies. Important Note: The Ocean State Indicator is not pre-optimized. It’s been created

The Mountain Guard Indicator is a highly customizable tool designed for traders who want full control over their optimization. It has not been pre-optimized, giving you the freedom to adapt it to your specific trading strategies and preferences. Key Features: Buy and Sell Signals: Clearly displayed with lime (Buy) and red (Sell) arrows on the chart.
SAR Line: A dotted line (Dodger Blue) to visualize the Stop-and-Reverse (SAR) trend-following indicator.
Adjustable Parameters: Control SAR step, m

Introducing the Crystal Shield Indicator – Your Ultimate Pivot Point Trading Companion! The Crystal Shield Indicator is a powerful trading tool built for traders who are ready to optimize and customize their strategies. It provides visual insights into key market levels and potential turning points, making it an essential companion for traders seeking precision and reliability. What Makes Crystal Shield Stand Out? Dynamic Signal Generation: The indicator plots clear Buy (Lime Arrows) and Sell (

Introducing the Phoenix Turn Indicator
The Phoenix Turn indicator is designed for traders who seek to harness the power of precise market-turn detection. This tool provides clear visual cues to identify potential buy and sell opportunities based on dynamic price-action and indicator-based logic. Why Choose Phoenix Turn? Unoptimized for Flexibility: This indicator is provided as a raw tool for you to optimize and customize, fitting perfectly with your unique trading strategy. Clear Visual Signal

Dragon State Indicator is a powerful trading tool designed to empower traders by giving them the foundation to optimize it further. This indicator is not optimized, making it a perfect choice for traders who love to tweak and customize trading tools to suit their unique strategies. The Logic Behind the Indicator
The Dragon State Indicator identifies pivotal market movements using these components: Buy and Sell Signals: Buy Signal: Clearly displayed with lime-green arrows when conditions suggest

Quantum Dynamic POC Hi Tf for MT5 Description: The "Quantum Dynamic POC Hi Tf" is a unique indicator developed for volume analysis. It is suitable for both real volumes (on futures contracts) and tick volumes (on the Forex market). The indicator is a channel tool consisting of three lines that dynamically change depending on the selected timeframe: Middle Line : the main dynamic Point of Control (POC), which reflects the average volume price. Upper Line : the maximum of the selected timeframe. L
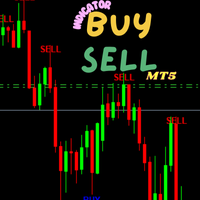
This indicator serves as a crucial leading tool for identifying pivotal points in market reversals. It provides traders with valuable insights regardless of the timeframe they are analyzing, whether it be minutes, hours, or days. Additionally, it is compatible with all trading pairs, making it highly versatile for various market scenarios. Incorporating this indicator into your trading strategy can significantly enhance your decision-making process and improve your overall trading performance. B
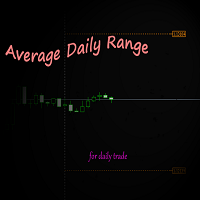
Average True Daily Range is an indicator that displays support and resistance zones based on the average daily price range. It is used to determine the intraday trading space and risk-return ratio. It needs to be traded in conjunction with other indicators to determine the direction. This indicator is used for intraday trading, so the indicator is only displayed on D1 below periods. If you are interested in day trading based on trend trading, you can test my other indicator " magic finger "
SCALP CAPITAL – Dominate the Market with a Success Rate Over 90%! Scalp Capital is an indicator system designed to provide unmatched precision for intraday traders and scalpers. It relies on two complementary indicators to ensure a success rate of over 90%: SCALP CAPITAL REVERSAL ( Provided for free after purchase, upon private request )
SCALP CAPITAL ARROW ( This is the indicator you purchase here ) ️ After your purchase, send me a private message to receive SCALP CAPITAL REVERSAL for f
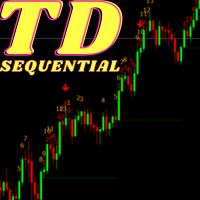
If you are unsure how to use this indicator, please feel free to reach out to me. I will explain it to you and provide reading materials to help you make the most of it. Here’s a brief description of how to use the indicator effectively.
MT4 version: https://www.mql5.com/en/market/product/129509?source=Site +Market+My+Products+Page My Other Products: https://www.mql5.com/en/users/1700046313/seller How to Use TD Sequential by Tom DeMark The TD Sequential is a technical analysis indicator develo

Usta Avcı v1.0
Bu indikatör RSI, MFI, Momentum ve ATR indikatörlerini kullanarak m15 - H1 - H4 ve 1D zaman dilimlerinde en iyi alış ve satış sevilerinde sinyaller verir. Her yeni sinyalde TP1, TP2, TP3 ve SL seviyelerini grafik üzerinde gösterir. Bu indikatörün tüm değerleri özelleştirilerek tüm ürünlerde kullanılabilir. Mevcut yüklü olan ayarlar Altın için Hazırlanmıştır. En iyi sonuçları Altın, Gümüş, Petrol, Doğalgaz ve Endekslerde vermektedir.
GOLD AYARLARI
TP1=7.50 TP2=14.75 TP3=37.500
Great For Binary options. Works on all timeframes. Recommended for M5 timeframe. one candle expiry. Experienced traders can explore. Strategy is based on price action and multi timeframe analysis. Recommended During high volatility sessions, like the London and new York sessions. For the M1(One minute) timeframe, Traders can use four or five candle expiry, this means it can be applied for 4, 5 or more minutes expiry. For forex traders, I tested the indicator with the JesVersal universal EA:
There are only 3 important levels on any chart- High Low & Close.
Once a candle closes , its very important to know where these levels are and to trade with respect to these levels is critical in trading.
This is especially true for the daily weekly and monthly levels.
This indicator will automatically plot the,
High Low & CLOSE of the Daily, Weekly and Monthly closed candles with custom styles and colors.
It will also draw a Daily period separator if you so choose.
We want to help you pl
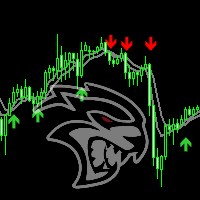
Highly advanced moving average - NON-REPAINT - Fast entries without lag. - Works on all timeframe recommended M5 AND M15 Orange arrow is a sell entry exit on opposite signal with is green arrow. Green arrow is a buy entry exit on opposite signal with is orange arrow. the ma will show double green arrows which indicates a strong up trend. the ma will show red arrows which indicates a strong down trend. Works on all pairs Low spread broker is highly recommended

The Quantum DELTA indicator for MetaTrader 5 (MT5) – a powerful volume analysis tool that stands out with its capabilities and accuracy. Indicator Description The Quantum DELTA indicator is designed for volume analysis in a separate MT5 window. Its main task is to identify and display divergences, allowing traders to make more informed and timely decisions. Indicator Features Volume Analysis : The indicator analyzes volumes in financial markets, allowing you to see how volumes are distribute
Engulfing Pattern Indicator Introducing the Engulfing Pattern Indicator! Are you ready to take your trading strategy to the next level? The Engulfing Pattern Indicator is your ultimate tool to spot powerful market reversals and trends based on the time-tested Engulfing Candlestick Pattern. This indicator is crafted to provide you with actionable insights, but remember: it’s not optimized—you have the freedom to optimize it to suit your trading needs! Why the Engulfing Pattern?
The Engulfing Pat

Unlock the Power of Precision with the Storm Peak Indicator! The Visual Storm Peak Indicator is a sophisticated, signal-driven tool designed for traders who seek clear and actionable market insights. It's built on a robust logic foundation, leveraging the Commodity Channel Index (CCI) to identify market peaks and reversals effectively. While the indicator comes with a pre-set structure, it has been specifically created for you to optimize and adapt to your unique trading style. Why Choose the S

Wind Shift Indicator Are you ready to harness market shifts with precision? The Wind Shift Indicator is your tool for identifying potential reversals and trend continuations. Designed for traders who prefer to fine-tune their tools, this indicator is not optimized, giving you the freedom to tailor it to your unique trading style. Logic Behind the Strategy: The Wind Shift Indicator employs a combination of Commodity Channel Index (CCI) logic and visual signal plotting to detect shifts in market

Unoptimized and Designed for You to Customize
The Mercury Track Indicator is a powerful trading tool created with flexibility in mind, allowing you to tailor it to your trading strategies and market conditions. Out of the box, it provides insightful signals, but it’s meant for traders to optimize and enhance according to their unique preferences and trading styles. Logic Behind the Strategy
At its core, the Mercury Track Indicator employs a combination of signal generation and dynamic band plot

Unleash the Power of the Neptune Blast Indicator!
The Neptune Blast indicator is your ultimate tool for identifying market breakouts and trend directions. Built on the proven Donchian Channel strategy, it combines visual clarity with precise logic to help you spot potential trading opportunities. Not Optimized, Built for YOU to Optimize!
This indicator is intentionally left unoptimized, empowering you to fine-tune it to match your trading style and strategy. Whether you’re a seasoned trader or
MetaTrader mağazası, alım-satım robotları ve teknik göstergeler satmak için en iyi yerdir.
MetaTrader platformu için ilgi çekici bir tasarıma ve iyi bir açıklamaya sahip bir uygulama geliştirmeniz yeterlidir. Milyonlarca MetaTrader kullanıcısına sunmak için size ürününüzü Mağazada nasıl yayınlayacağınızı açıklayacağız.
Alım-satım fırsatlarını kaçırıyorsunuz:
- Ücretsiz alım-satım uygulamaları
- İşlem kopyalama için 8.000'den fazla sinyal
- Finansal piyasaları keşfetmek için ekonomik haberler
Kayıt
Giriş yap
Gizlilik ve Veri Koruma Politikasını ve MQL5.com Kullanım Şartlarını kabul edersiniz
Hesabınız yoksa, lütfen kaydolun
MQL5.com web sitesine giriş yapmak için çerezlerin kullanımına izin vermelisiniz.
Lütfen tarayıcınızda gerekli ayarı etkinleştirin, aksi takdirde giriş yapamazsınız.