YouTube'dan Mağaza ile ilgili eğitici videoları izleyin
Bir ticaret robotu veya gösterge nasıl satın alınır?
Uzman Danışmanınızı
sanal sunucuda çalıştırın
sanal sunucuda çalıştırın
Satın almadan önce göstergeyi/ticaret robotunu test edin
Mağazada kazanç sağlamak ister misiniz?
Satış için bir ürün nasıl sunulur?
MetaTrader 5 için ücretli teknik göstergeler - 62

Ücretsiz indirme için grubumuza katılın. Sınırlı süreli teklif! Aşağı zaman dilimlerinde günlük mum sınırlarının net görsel ipuçlarını sağlayarak ticaret deneyiminizi geliştirmek için tasarlanmış yenilikçi MQL5 Göstergeyi tanıtıyoruz. Bu araç, günlük mumun ilerlemesini takip etmek isteyen ve daha iyi kararlar alarak stratejilerini uygulamak isteyen yatırımcılar için mükemmeldir. Ana Özellikler Günlük Mum Kutusu Görselleştirme: Düşük zaman dilimlerinde günlük mumun başlangıcından bitişine kadar b
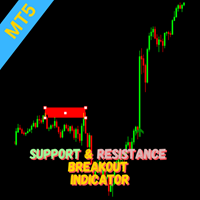
Indicator Overview This indicator utilizes the Zigzag indicator to identify potential support and resistance levels. When the price action breaks through one of these levels, a trading signal is generated. How it Works The Zigzag indicator is employed to pinpoint significant price highs and lows, forming potential support and resistance areas. A signal is triggered when the current candle closes beyond a previously established support or resistance level. Traders can consider entering a position
CLICK HERE FOR FREE DOWNLOAD This trading indicator Automatically identifies and plots contract blocks, which are essential zones marked by significant levels of support and resistance. This powerful tool provides traders with a clear and intuitive visualization of critical market points where prices are likely to bounce or reverse. The contract blocks, represented by distinct colored rectangles, highlight support zones (at the bottom) and resistance zones (at the top), enabling traders not onl

VolaMetrics VSA | Teknik Analizde Güçlü Bir Yardımcı VolaMetrics VSA , Volume Spread Analysis (VSA) metodolojisini ayrıntılı işlem hacmi analizi ile birleştiren bir teknik analiz göstergesidir. Önemli fiyat hareketlerini belirlemek ve izlemek için tasarlanan bu araç, hacim ve fiyat yayılması arasındaki etkileşimi kullanarak, ticaret kararlarına yardımcı olabilecek değerli içgörüler sağlar. Volume Spread Analysis (VSA) Temelleri Volume Spread Analysis (VSA) , teknik analizde saygı gören bir

Breakthrough signal indicator for the MT5 platform: Your reliable assistant in the world of trading!
We are pleased to present you with an innovative signal indicator, which was created in collaboration with an outstanding mathematician. This indicator combines advanced algorithms and the best of the world of mathematical analysis, providing traders with a unique tool for predicting market movements.
Why is this indicator unique?
1 .Entry signals without redrawing If a signal appears, it
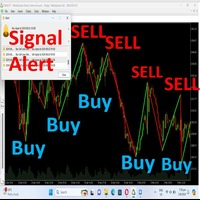
Hello Traders, *-For your bonus one indicator with SL,TP zone* just give your review, comment.Once finish developing I will give you**** Trend identification Indicator This is a indicator that will identify trend zone as bearish and bullish zone . This indicator can use for all pairs and any timeframe you can use it . *Green lime mean buy.Red line mean sell.You will receive alert sound when signal generate. The create best on high, low point and moving average calculation. You can customize valu
The VSA Scanner Dashboard is a multi-symbol, multi-timeframe scanner that displays VSA signals. It is based on the Volume Plus and VSA Signals indicator. Features Displays the VSA signal of the last closed candle. Monitors 28 customizable instruments (symbols) and up to 21 timeframes at the same time. Easily arrange symbols in any order. Each signal has a tooltip that displays the name and time of appearance. Click on each signal to open a new chart. All types of alerts (sound, pop-up, email,
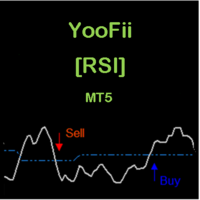
CONSTITUTION YooFii [RSI] is an indicator consisting of an oscillator and a dynamic level. The oscillator, dynamic level and warning signals can be adjusted via the inputs. It is designed for the MT5 platform only. APPLICATION This indicator should be used with a trend filter [e.g. two moving averages, MA 200 and MA 55] [see screen shots for more details]. when the oscillator crosses the dynamic level from bottom to top, we have a BULLISH move. when the oscillator crosses the dynamic level from

Adjustable Consecutive Fractals looks for 2 or more fractals in one direction and sends out a on screen alert, sound alert and push notification, for strong reversal points .
Adjustable Consecutive Fractals, shows the fractals on chart along with a color changing text for buy and sell signals when one or more fractals appear on one side of price.
Adjustable Consecutive Fractals is based Bill Williams Fractals . The standard Bill Williams fractals are set at a non adjustable 5 bars, BUT withe
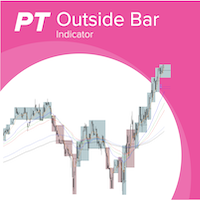
Outside bars (Außenstäbe) are important in professional price action trading and were made popular by Michael Voigt. Highs and lows of outside bars ( Aussenstäbe ) can be utilized as entry and exit for trades following different strategies. With combining different timeframes you can more easily detect the overall trend of the market, see potential resistance and support levels and also detect change in trend and framing of the market. Examples for strategies with inside bars (Innenstäbe) an

This MQL5 Speed Indicator script calculates the average speed of price movements for a selected financial instrument over a specified period. It uses the arithmetic mean to determine the average speed, which is computed by dividing the distance (change in price) by the time interval. The indicator then displays this value as a histogram in a separate window. Average Speed Calculation : The speed is calculated using the formula v = d t v = \frac{d}{t} v = t d , where d d d is the price differen
The "Order Block Indicator for MetaTrader 5" is an advanced trading tool designed to help traders identify key order block zones in the financial markets. Order blocks are areas of institutional buying and selling, often marking significant price levels where market reversals or continuations are likely to occur. This indicator provides a visual representation of these zones directly on the chart, enabling traders to make more informed trading decisions. Key Features: Accurate Order Block Identi

Session Box Indicator for MetaTrader 5
Description: The SessionBox indicator is designed to visually represent the trading sessions on a chart, specifically the Asian, European, and American sessions. This indicator draws customizable rectangles around each session, allowing traders to easily identify different trading periods. It also includes labels to denote each session, enhancing clarity.
Users only need to input the session start and end hours in their server time. Please note, the As
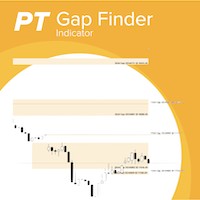
With the gaps finder indicator gaps between trading session are automatically added to you chart and you will never miss a gap which you can use in your trading strategies. Gaps often act as a magnet where the markets returns to or when a gap is closed often constitutes a reversal point.You don't have to draw manually gaps anymore. Key Features: Support for multiple trading sessions in a single chart, e.g market session and future session Configurable number of days to look back for gaps Highly
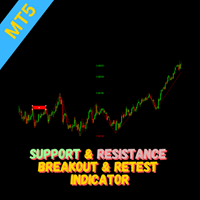
Overview The Breakout and Retest indicator is designed to identify potential trading opportunities by detecting price breakouts from significant support and resistance levels followed by a retest of the broken level. How it Works The indicator analyzes price data to determine key support and resistance areas. When the price decisively breaks through one of these levels and then retest it, then a potential breakout is signaled when it breakout again. To increase the probability of a successful t
Göstergeyi trend takibinde trend değişikliklerinin tespitinde kullanabilirsiniz. Her renk değişimi alım satım sinyalidir. En az 1 saatlik grafiklerde kullanılmalıdır. Tavsiye edilen 1 günlük grafiklerde kullanılmasıdır. Ancak dikkat edilmesi gereken, grafiğinizdeki anlamlı mum sayısının (gap'siz) en az 80 olmasıdır. Hesaplama metodu ATR, MA ve CCI göstergelerine dayanmaktadır. Ancak önemli bir kısmı için kendi geliştirdiğim ve standart sapma ile regresyon analizinin temel alındığı bir algoritma

WHY IS OUR FXACCCURATE TCT MT5 THE PROFITABLE ? Gives entry, stop and target levels from time to time. It finds Trading opportunities by analyzing what the price is doing during established trends. We have made these indicators with a lot of years of hard work. It is made at a very advanced level.
Established trends provide dozens of trading opportunities, but most trend indicators completely ignore them! The trend reveals trading indicator represents an average of 10 different trades per trend

Elder Impulse Indicator Overview: The Elder Impulse Indicator is a powerful tool designed for traders who want to combine the strengths of trend-following and momentum strategies. Developed by Dr. Alexander Elder, this indicator helps traders identify potential entry and exit points by analyzing both price direction and momentum. It’s an essential tool for making informed decisions in various market conditions, whether you're trend-trading, swing trading, or looking for momentum shifts. Key Fea

"Ultimate Bot Alerts göstergesi, yatırımcıların piyasadaki potansiyel giriş ve çıkış noktalarını belirlemelerine yardımcı olan, MetaTrader 5 için güçlü bir araçtır. Bu gösterge, alış ve satış sinyalleri oluşturmak için Ortalama Gerçek Aralığa (ATR) ve fiyat hareketine dayalı karmaşık bir algoritma kullanır.
Ultimate Bot Uyarıları göstergesini grafiğinize uyguladığınızda, satın alma sinyalleri için yeşil okları, satış sinyalleri için ise kırmızı okları göreceksiniz. Bu sinyaller doğrudan fiyat

Channel Vertex is a price action pattern formed by price Chanel and a triangle pattern . Price channels basically indicates possible support and resistance zones around a price movement and retracement or breakout at these levels can indicate possible trend continuation or reversal .
Majority of the times price fluctuations forms triangle patterns defined by 3 vertexes , these triangle patterns most times defines a trend continuation. A triangle pattern is a trend continuation pattern tha
Perfectly designed for traders who value clarity, precision, and ease of use, this cutting-edge Renko chart indicator provides everything you need to enhance your trading strategy. Unlike traditional generators that create offline charts, this indicator delivers real-time Renko charts directly on your live trading platform. The Live Renko Indicator also works seamlessly on Synthetic Indices such as Volatility 75, Step Index, Boom and Crash.

In the world of trading, the key to success lies in having the right tools at the right time. Our innovative Volume Profile indicator was developed with one goal in mind: to provide traders with unprecedented access to vital market activity information. This cutting-edge tool allows you to not only see where and when volumes are traded but also to understand market depth with clarity never seen before. Main Features: Temporal Flexibility: Set the analysis range up to 1800 minutes to perfectly ma

We proudly present our Smart Money Concepts (SMC) and Inner Circle Trader (ICT) indicator , specifically designed for professional traders who seek precision in their market analysis. This tool seamlessly integrates key SMC/ICT concepts directly into your charts, providing clear and accurate visual signals. Key Features: Automatic Order Blocks : Automatically detects bullish and bearish Order Blocks, highlighting zones where institutions place their orders. Customize the colors and styles to fit

Maximize Your Trading Opportunities with the "Auto Trendlines" Indicator Discover the "Auto Trendlines" Indicator: "Auto Trendlines" is the essential tool for every technical trader. This indicator automatically plots trend lines, pinpointing support and resistance levels with surgical precision. It's ideal for those looking to capitalize on market breakouts and reversals. Key Features: Automatic Trendline Plotting: Identifies and draws crucial trend lines without manual intervention. Advanced C

Optimize Your Trading Decisions with the "autoFibo" Indicator Discover the "autoFibo" Indicator: "autoFibo" is the essential analysis tool for traders who want to fully leverage Fibonacci levels without the hassle of manual plotting. This indicator automates the Fibonacci retracement process, providing instant visual access to key support and resistance zones. Key Features: Automatic Fibonacci Retracement: Automatically plots Fibonacci levels, making it easy to identify support and resistance zo
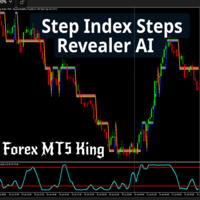
Unlock precision in your trading with the Step Index Steps Revealer AI . This advanced MT5 indicator is your ultimate tool for identifying key price levels on major forex pairs, including GBP/USD, EUR/USD, and others, as well as the step index
Key Features 1. Accurate Price Level Identification Plots precise key levels on major forex pairs like GBP/USD, EUR/USD, USD/JPY, and more. Ideal for traders looking to capitalize on bounce backs and breakouts with accuracy. 2. Optimized for Step Index C

Enhance Your Trading Performance with the "Better Volume" Indicator Discover the "Better Volume" Indicator: The "Better Volume" is the essential market volume analysis tool for traders aiming to stand out. It analyzes tick volumes with unprecedented accuracy, featuring an advanced moving average function (PERIOD_MA) and customizable buy and sell alerts. Key Features: Advanced Volume Analysis: Recognize volume peaks signaling crucial price movements. Intuitive Buy and Sell Alerts: Stay one step a
O delta volume é uma ferramenta poderosa utilizada em várias estratégias de operação, especialmente no trading de futuros, ações e criptomoedas. Aqui estão algumas das principais estratégias onde o delta volume é frequentemente aplicado: Identificação de Tendências : O delta volume ajuda a identificar a direção da tendência predominante, mostrando se há mais pressão de compra ou venda. Isso pode ser útil para confirmar a força de uma tendência ou identificar possíveis reversões. Confirmação de B

SuperTrend , trend yönünü belirlemek ve giriş-çıkış sinyalleri oluşturmak için ticarette en etkili ve yaygın olarak kullanılan teknik göstergelerden biridir. Volatilite ve trende dayalı olarak, bu gösterge piyasa koşullarına dinamik olarak uyum sağlar ve yatırımcılara net bir görsel referans sunar. Ana Özellikler: Trend Tespiti: SuperTrend piyasa trendini takip eder, düşüş trendinde fiyatın üzerinde, yükseliş trendinde ise fiyatın altında bir çizgi çizer. Kullanım Kolaylığı: Sezgisel grafik göst

CONGESTION BREAKOUT PRO
This indicator scans the breakout of congestion zones . This indicator unlike any other congestion indicator you will find in the market right now, it uses an advanced algorithm not peculiar to most traditional congestion indicators available today . The advanced algorithm used to define the congestions is greatly responsible for the high rate real congestion zones and low rate fake congestion zones spotted by this product.
UNDERSTANDING CONGESTION
Congestion are
Welcome to Super Trend System. The system has a track record of 18 months with a consistence performance in a live account. It is designed with a great trend base determination algorithm that performs over 88% of forex pairs positively. The algorithm is also populated by multi-time frames to find an overall market trend direction. Kindly find the images for trades management. How to use the System? When the signal line turns red, that is Sell signal, wait until the new red line creates and edg

Yeni Birleşik Gösterge - 3'ü 1 Arada Piyasa analizlerinizi ve yatırım stratejilerinizi geliştirecek ticaret araçları mı arıyorsunuz? En iyi üç göstergemizi tek bir güçlü ve uygun çözüme birleştirdik, böylece ticaretiniz için en iyi değeri elde etmenizi sağladık. 1. Order Block Göstergesi (daha önce 32,90$'ya satıldı) Order Block Göstergesi, piyasada güçlü kurumsal ilgi alanlarını belirlemek için temel bir araçtır. Bu gösterge, fiyat tersine dönüşlerinin veya trend devamlarının meydana gelebilece

O indicador media colors se baseia num canal que pode ser criado a partir de duas médias Media colors é um indicador de tendência utilizado no trading para identificar a direção predominante do mercado. Pode ser baseado na Média Móvel Simples (SMA) e na Média Móvel Exponencial (EMA) que dá mais peso aos preços mais recentes, tornando-a mais sensível às mudanças de preço. Como Funciona: Cálculo: A EMA é calculada aplicando um fator de suavização aos preços de fechamento de um ativo financeir

Finansal Gösterge SolarTrade Suite: Comet Piyasa Göstergesi - Finans Piyasaları Dünyasında Güvenilir Rehberiniz!
Bu, değerini hesaplamak için özel yenilikçi ve gelişmiş algoritmalar kullanan ve ayrıca hoş bir tasarıma ve ek işlevlere sahip bir dönem göstergesidir.
Bu göstergenin okumalarını anlamak çok kolaydır: yeşil dikey çizgi yeni bir dönemin başlangıcıdır. Ek işlevler olarak: - ön plan rengini maviye değiştirmek için ana grafik penceresinin üst yarısına birkaç kez tıklayın veya, - ön p
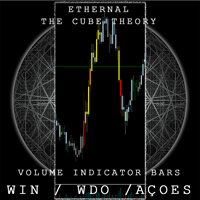
The Cube Bars Brasil pinta os candles de acordo com o volume , excelente para saber os picos de compra e venda . Pode ser regulado livremente pelo usario . Possui regulagem de parametro de entrada para que o usuario tenha a liberdade de regular o colume de acordo com o ativo que escolher . Possui 4 cores que diferenciam os candles de acordo com o tamanho do volume naquele instante
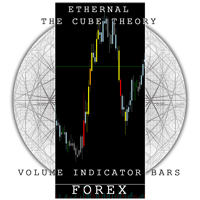
The Cube Bars Forex is an indicator for meta trader 5 created by me Tomas Lekim to color the candlesticks based on the volume peaks of the large investors in the forex market. It tracks the buy and sell peaks and paints the candles according to the amount of money invested by the other robots. It is a powerful tool against large robots because it identifies the moments when it must make decisions. It can be configured according to the currency pair you will use. It has 4 different colors so that

"Fair Value Gap" (FVG) Göstergesi - Piyasa Dengesizliklerinin Gücünü Keşfedin Ticaret dünyası, yalnızca doğru araçlara sahip olanların etkili bir şekilde tanımlayıp yararlanabileceği gizli fırsatlarla doludur. FVG Göstergemiz , bunu yapmanıza yardımcı olmak için tasarlanmıştır. Piyasayı okuma yeteneğinizi geliştirmek ve en iyi giriş ve çıkış noktalarını belirlemek isteyen bir tüccarsanız, FVG Göstergesi mükemmel müttefikinizdir. Fair Value Gap (FVG) Nedir? Fair Value Gap kavramı, fiyat grafiğind
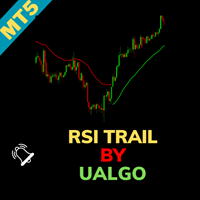
RSI Trail [UAlgo] Indicator for MetaTrader 5 The RSI Trail [UAlgo] indicator is a sophisticated technical analysis tool designed to enhance trading strategies by leveraging the Relative Strength Index (RSI) in conjunction with various moving average calculations. This indicator dynamically plots support and resistance levels based on RSI values, offering clear visual signals for potential bullish and bearish market conditions. Key Features:
Dynamic Support and Resistance Levels: The indicator
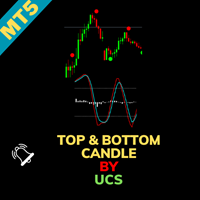
UCS_Top & Bottom Candle Indicator for MetaTrader 5 The UCS_Top & Bottom Candle is an innovative experimental indicator designed for MetaTrader 5. Based on momentum, this indicator identifies the top and bottom candles for most swing movements, assisting traders in making precise market entries and exits. Key Features: Momentum-Based Analysis: Utilizes momentum to detect the top and bottom candles for swing trading opportunities. Customizable Settings: Percent K: Set the Percent K value (default
"Schaff RSX" nedir? "Schaff RSX", Göreceli Güç Endeksi'nin (RSX) etkinliğini Schaff Döngüsü'nün hassasiyetiyle birleştirerek, piyasaya giriş ve çıkış yapmak için en iyi anları kolayca belirlemenize yardımcı olacak benzersiz bir gösterge oluşturur. Bu, gizli ticaret fırsatlarını tespit eden bir radara sahip olmak gibidir ve diğer tüccarların göz ardı edemeyeceği bir rekabet avantajı sağlar. Neden "Schaff RSX" Seçmelisiniz? Net ve sezgisel görsel sadelik : "Schaff RSX"in renkleri ve çizgileri, piy

HiperCube Piyasa Profili!
Piyasa Profili, fiyat ve zaman bilgilerini bir dağıtım biçiminde birleştiren grafiksel bir gösterimdir. Fiyat bilgilerini dikey ölçekte (y ekseni) ve hacim bilgilerini yatay ölçekte (x ekseni) görüntüler. Bu grafik türü, piyasa aktivitesine ilişkin içgörüler sunarak, yatırımcıların adil piyasa değerini gerçek zamanlı olarak görselleştirmelerine ve değerlendirmelerine olanak tanır.
Özellikler: Özel Renkler Özel Grafik Grafikte net bilgi Grafik ve çekici arayüz Style
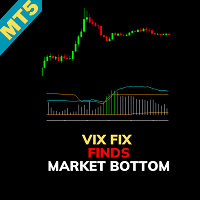
Indicator Name: CM_Williams_Vix_Fix Finds Market Bottoms Overview: The CM_Williams_Vix_Fix Finds Market Bottoms indicator is an advanced tool designed to identify market reversal points across various asset classes. Inspired by the original work of Larry Williams, this indicator provides similar insights to the VIX for stock indices but with the added flexibility of functioning effectively across all asset types. Key Features: Versatility Across Asset Classes: Unlike traditional indicators that

"HiperCube USD ENDEKSİ (DXY /USDX) ", hisse senetleri, tahviller veya emtialar gibi belirli bir varlık grubunun performansını temsil eden ve değerleri ABD doları cinsinden olan bir finansal kıyaslama ölçütüdür. Bu endeksler yatırımcıların belirli sektörlerin veya piyasaların performansını zaman içinde takip etmelerine ve karşılaştırmalarına yardımcı olur. Endeks, ABD doları cinsinden ifade edilerek, varlıkların yerel para birimi veya coğrafi konumundan bağımsız olarak yatırımları değerlendirmek
Entry Confirmation Indicator for MT5: Precision Trading for Volatility Indices The Entry Confirmation Indicator for MetaTrader 5 (MT5) is a powerful and versatile tool tailored specifically for traders who focus on volatility indices. Whether you're looking to capitalize on trend continuations or identify key reversal points, this indicator is designed to provide clear and actionable signals that enhance your trading strategy. Targeted Instruments: A Focus on Volatility This indicator is optimiz
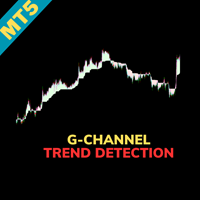
Indicator Name: G-Channel Trend Detection Overview: The G-Channel Trend Detection indicator offers a unique approach to trend analysis, leveraging AlexGrover's G-Channel methodology. This indicator provides a clear and simplified view of market trends by identifying bullish and bearish conditions based on price interactions with the G-Channel boundaries. Key Features: Trend-Based Market Analysis: The indicator determines trend direction by monitoring price action relative to the G-Channel bounda

CVD SmoothFlow Pro - Her Varlık İçin Sınırsız Hacim Analizi! CVD SmoothFlow Pro , hassas ve sınırsız bir hacim analizi arayan trader'lar için nihai çözümüdür. Cumulative Volume Delta (CVD) hesaplamasını ve gelişmiş gürültü filtrelemesini kullanarak, Pro sürümü herhangi bir finansal varlık için gereken esneklik ve doğruluğu sağlar. CVD SmoothFlow Pro Neler Sunar? Açık Analiz : Pazar gürültüsünü filtreler ve her finansal varlıkta önemli hacim hareketlerini vurgular. ️ Kesin Hesaplama : Alım

Süper Gösterge, yeni ve deneyimli yatırımcılar için özel olarak tasarlanmış kapsamlı bir ticaret çözümüdür. Uyarı vermek için 5'ten fazla göstergeyi birleştirir
Sinyal Netliği: Açık giriş ve çıkış noktaları için ok sinyalleri sunar. Gerçek Zamanlı Uyarılar: Yatırımcıları ticari giriş ve çıkış uyarılarıyla bilgilendirir. Özellikler:
Yeniden boyanmaz Maksimum aktivasyon 7'den fazla strateji 5 Gösterge hepsi bir arada Giriş ve çıkış noktaları ve oklar Telefon ve e-postaya uyarılar Öneri

DYJ SmoothedMA Strategy is a very simple but powerful system to get forex and s ynthetic market trend direction. This indicator is actually a moving average indicator containing 10 smoothing algorithms in a file . The indicator can help you to see the whole trend break out/rebound signal. And these BUY and SELL signals are sent out. You can use DYJ GameDevice follow-up software to receive these signals and realize automatic opening and closing of positions. And can use the game strategy fu
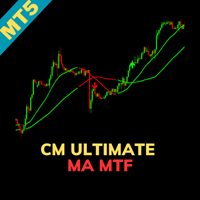
Indicator Name: CM_Ultimate_MA_MTF_V2 - Added Tilson T3 Overview: The CM_Ultimate_MA_MTF_V2 is a powerful moving average indicator that offers a high degree of customization and flexibility for traders. It supports multiple types of moving averages, including the advanced Tilson T3, and provides features such as multi-timeframe analysis, cross detection, and visual highlights. Key Features: Multi-Timeframe Flexibility: The indicator defaults to the current timeframe on the chart but allows users

The Spike Forecaster SFD is a system that was developed to catch spikes, it simple to use, its just plug and play.
It will give both Buy Alerts and Sell Alerts through arrows white and red respectively.
The system was designed to make it easier for those traders who might be busy to analyse the market hence it will just give you simple alerts to know the direction of the market. Regards
Spike Forecaster

This is a early support and resistance indicator. It will allow you to choose how many candles back. You can use it on all timeframes. Change the color as you like. You can use it with other indicators for better entry prediction it will give you trend for bear market and bull market. It will help you predict sideways market trending market and falling market. Save trading
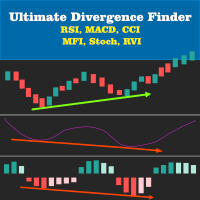
Multi Indicator Divergence Finder Enhance your trading strategy with the Multi Indicator Divergence Finder! This versatile tool is engineered to help traders quickly and accurately identify both regular and hidden divergences across multiple popular indicators simultaneously, including RSI, MACD, CCI, Stochastic, MFI, and RVI. Experience real-time divergence detection with signals plotted directly on your charts. Key Features: Simultaneous Multi-Indicator Divergence Detection : Detect regular an
Contact us to receive a comprehensive user guide after purchasing. Enhance your trading experience with the Hydra Trend Rider Indicator, meticulously designed by MQL5 silver award winning developer to provide you with unparalleled market insights and empower your decision-making process. This advanced tool is perfect for traders seeking precision and efficiency in their trading strategies. Join our MQL5 Channel Indicator Features: Multiple Timeframe Dashboard: Gain a comprehensive view of the
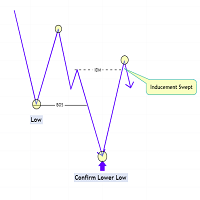
The Market Structure with Inducements & Sweeps indicator is a unique take on Smart Money Concepts related market structure labels that aims to give traders a more precise interpretation considering various factors.
Compared to traditional market structure scripts that include Change of Character (CHoCH) & Break of Structures (BOS) -- this script also includes the detection of Inducements (IDM) & Sweeps which are major components of determining other structures labeled on the chart.
SMC &

Previous Candle Levels MT5 shows the previous candle levels, it shows the previous candle Open High Low Close levels (OHLC Levels) in different time frame. It's designed to help the trader to analyse the market and pay attention to the previous candle levels in different time frame. We all know that the OHLC Levels in Monthly, Weekly and Daily are really strong and must of the time, the price strongly reacts at those levels. In the technical analysis, the user can use them as a support and res
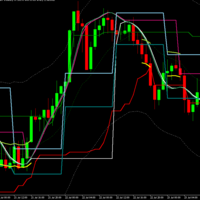
Mega Analyzer MT5 Indicator: A Comprehensive Trading Solution In the dynamic world of trading, having an edge can make all the difference. The "Mega Analyzer MT5 Indicator" offers traders that edge, providing a powerful tool that deciphers market movements with precision and clarity. Designed for both novice and experienced traders, this indicator is tailored to enhance decision-making and optimize trading strategies by revealing key price levels and market conditions that often go unnoticed by

VolumeSecret: Volume’un Gücü Elinizde Programlama dünyasında karşılaştığımız zorluklar, sürekli olarak büyümemize ve gelişmemize neden olur. Pazarın getirdiği zorlukları ve traderların en yüksek performansa ulaşma mücadelesini derinden anlıyoruz. Bu yüzden, pazar kararlarını daha akıcı ve hassas hale getirmek için yenilikçi çözümler üzerinde durmaksızın çalışıyoruz. VolumeSecret , bu bağlılığın bir sonucudur. Bu gelişmiş göstergeler, hacim analizi ile sofistike bir stratejiyi birleştirerek piyas
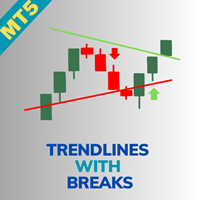
Indicator Name: Trendlines with Breaks [LuxAlgo] Overview: The Trendlines with Breaks [LuxAlgo] indicator provides traders with pivot point-based trendlines that highlight real-time breakouts. This tool is highly customizable, allowing users to adjust the steepness of trendlines, choose different slope calculation methods, and receive alerts on trendline breakouts. Key Features: Pivot Point-Based Trendlines: The indicator automatically generates trendlines based on pivot points, providing a clea

Buy Sell Storm
Professional indicator for trading on financial markets, designed for MT5 platform .
Trading on the indicator is very simple, Blue arrow to buy , Red arrow to sell.
The indicator does not redraw and does not change its values.
After purchase write to me and I will send you a Bonus in the form of an EA Buy Sell EA on this indicator.
( see the video of the EA on the indicator, the set file is attached).
In the default settings the Period parameter is set to

Trendline Wizard Overview: The Trendline Wizard is a powerful and versatile MetaTrader 5 indicator designed for traders who rely on trendlines for their technical analysis. This indicator automatically monitors specified trendlines and provides real-time alerts when price action interacts with these critical levels. Whether you’re a swing trader, day trader, or long-term investor, the Trendline Wizard is an essential tool to enhance your trading strategy. Key Features: Customizable Alerts : Set
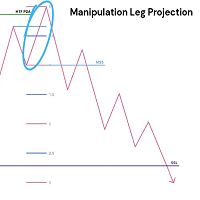
This indicator delves into using standard deviations as a tool in trading, specifically within the Inner Circle Trader (ICT) framework. Standard deviations are a statistical measure that helps traders understand the variability of price movements. These projections is use to forecast potential price targets, identify support and resistance levels, and enhance overall trading strategies. Key Concepts: Understanding Standard Deviations : Standard deviations measure how much a set of values (in thi

Genel Bakış Multi Level ATR ve Hareketli Ortalama Bandı göstergesi, fiyat hareketlerini volatiliteyi göz önünde bulundurarak kapsamlı bir analiz sunar. Çeşitli bantlar aracılığıyla görsel temsil, trend ve konsolidasyon aşamalarını, ayrıca potansiyel tersine dönme noktalarını belirlemeyi kolaylaştırır. Özelleştirme seçenekleri sayesinde kullanıcılar, göstergeleri ticaret ihtiyaçlarına göre uyarlayabilirler. Özellikler Birden Fazla Bant Görselleştirmesi: Fiyat seviyeleri, yüksek, orta ve düşük değ
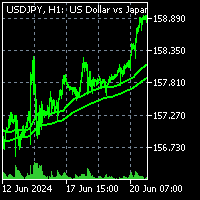
To get access to MT4 version please click here . This is the exact conversion from TradingView: "Liquidity Weighted Moving Averages" by "AlgoAlpha ". This is a light-load processing and non-repaint indicator. All input options are available expect time frame input . Buffers are available for processing in EAs. You can message in private chat for further information/changes you need. Thanks for downloading

TK - Rainbow Indicator Description: The TK - Rainbow indicator is a robust tool for technical analysis, designed to provide a clear view of market trends through a multi-line approach. With 30 lines calculated at different periods, it offers an extensive analysis of price movements. The indicator uses a dual-color scheme to highlight upward and downward trends, making it easy to interpret market conditions at a glance. Key Features: 30 Lines: Each line represents a different smoothing period to
Welcome to Tomas Lekim's Cube theory. The Theory is based on the calculation of the largest pattern existing in nature. A pattern that contains all other patterns and sequences. All patterns such as prime numbers, Fibonacci and other number sequences are contained in the universal mesh of my theory. It is possible to perceive the price pattern and the meeting between the two opposing forces that exist in the entire logic of negotiation and competition. .Games in which a team competes with anothe
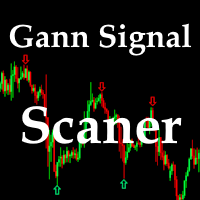
This indicator is based on the Gann Signal indicator and acts as a market scanner. All you need to do is fill in the selected currency pairs in the settings and that’s it. Next, the indicator itself will view all these currency pairs and time frames from M5 to D1 simultaneously. When a new signal appears, the indicator will give you an Alert and also draw the letter N where this new signal will be.

Currently, the product's selling price is over $480; however, we are offering a monthly rental system for only $30. This allows many people to enjoy and experience our products during this launch stage, which will likely lead to positive reviews from users, making it more enjoyable | We hope that if there are more than 10 positive reviews, the GOOD NEWS is that the next use will last for 3 months at a fixed price of only $30 | Take advantage of our promo opportunity, before it goes back to sell

Ekom Spike Detector Pro
Take your trading to the next level with the Ekom Boom and Crash Spike Detector Indicator Pro, designed for serious traders who demand more. This advanced version provides: Key Features: - Accurate Spike Detection: Identify high-probability spike patterns in real-time using price action - Clear Visual Signals: Displays clear buy and sell arrows on the chart for easy decision-making - Customizable: easily change arrows and line colors and also select wether Boom or

Forex için manuel ticaret ve teknik analiz göstergesi.
İşlem gününün açılış seviyesini gösteren bir trend göstergesi ve giriş noktalarını belirlemek için bir ok göstergesinden oluşur.
Gösterge yeniden renklenmez; mum kapandığında çalışır.
Sinyal okları için çeşitli uyarı türleri içerir.
Herhangi bir grafikte, alım satım aracında veya zaman diliminde çalışacak şekilde yapılandırılabilir.
Çalışma stratejisi trend boyunca fiyat hareketlerini aramaya dayanmaktadır.
" Buy " işlemleri ya

Yenilikleri görmek için "Neler Yeni" bölümüne göz atın. v1.4 sadece küçük düzenlemeler içeriyor, özel bir şey yok.
Bu göstergede özelleştirilebilir bir fraktal göstergesine ihtiyaç duyduğum için bunu oluşturdum. Aynı zamanda azalan hacimleri kontrol ederek bir tür onay sağlar. Aşağıda detaylar mevcut: Genel Bakış Bu gösterge, fiyat hareketi ve hacim dinamiklerini analiz ederek piyasadaki anahtar dönüm noktalarını belirlemeye yardımcı olur. Özellikler Gösterge stratejisinin temeli, genellikle ön
MetaTrader Mağaza, geliştiricilerin ticaret uygulamalarını satabilecekleri basit ve kullanışlı bir sitedir.
Ürününüzü yayınlamanıza yardımcı olacağız ve size Mağaza için ürününüzün açıklamasını nasıl hazırlayacağınızı anlatacağız. Mağazadaki tüm uygulamalar şifreleme korumalıdır ve yalnızca alıcının bilgisayarında çalıştırılabilir. İllegal kopyalama yapılamaz.
Ticaret fırsatlarını kaçırıyorsunuz:
- Ücretsiz ticaret uygulamaları
- İşlem kopyalama için 8.000'den fazla sinyal
- Finansal piyasaları keşfetmek için ekonomik haberler
Kayıt
Giriş yap
Gizlilik ve Veri Koruma Politikasını ve MQL5.com Kullanım Şartlarını kabul edersiniz
Hesabınız yoksa, lütfen kaydolun
MQL5.com web sitesine giriş yapmak için çerezlerin kullanımına izin vermelisiniz.
Lütfen tarayıcınızda gerekli ayarı etkinleştirin, aksi takdirde giriş yapamazsınız.