YouTube'dan Mağaza ile ilgili eğitici videoları izleyin
Bir alım-satım robotu veya gösterge nasıl satın alınır?
Uzman Danışmanınızı
sanal sunucuda çalıştırın
sanal sunucuda çalıştırın
Satın almadan önce göstergeyi/alım-satım robotunu test edin
Mağazada kazanç sağlamak ister misiniz?
Satış için bir ürün nasıl sunulur?
MetaTrader 5 için ücretli teknik göstergeler - 71

MURKA Levels PRO.
MURKA Levels PRO - is an indicator for MetaTrader 5, which displays High/Low, Open/Close, ATR levels (set manually) of the day, week, month on the chart. Marks round levels, signs the days of the week, numbers every week (you can set two types of round levels at the same time). ATH (All-time high) и ATL (All-time low). Levels are marked with price tags with a price symbol. Also, the indicator automatically calculates and displays on the chart the distance that the price has p
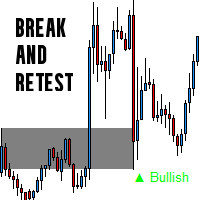
Break & Retest Indicator – Precision Market Structure Tool The Break and Retest Indicator is a powerful trading tool designed to help traders spot high-probability break-and-retest setups based purely on support and resistance levels . This indicator automatically identifies when price breaks a significant level and then retests it, providing clear bullish or bearish signals . Key Features: Automated Break & Retest Detection The indicator scans price action in real time to identify valid breakou

Probabilistic Price Predictor (QuantBreak Probability Suite) – The Bayesian Edge for Smarter Trading Unlock the Power of Probability in Market Forecasting. The Probabilistic Price Predictor is a revolutionary trading indicator that applies Bayes' Theorem to forecast breakout probabilities with mathematical precision. Instead of relying on traditional, rigid indicators, QuantBreak uses adaptive probability calculations to identify high-probability trade setups based on historical price action

Sonic R Indicator Description Overview The Sonic R Indicator for MT5 is designed to help traders analyze market trends using moving averages and volume analysis. This tool assists in identifying potential price movements by displaying trend zones and volume strength, making it suitable for various trading strategies. Key Features Dual EMA Trend Channels – Uses 34-period Exponential Moving Averages (EMA) to visualize price movement. Volume Analysis – A color-coded histogram to indicate changes i

If you are looking for precision in identifying strategic tops and bottoms, the ZigZag SMC/SMT Indicator for MT5 is the tool that will contribute to your technical analysis. Developed based on the advanced concepts of Smart Money Concepts (SMC) and Smart Money Trap (SMT), it offers an insight into market behavior, helping you make decisions.
What will you find in this indicator? Automatic identification of strategic tops and bottoms Based on institutional strategies Ideal for analyzing liqu
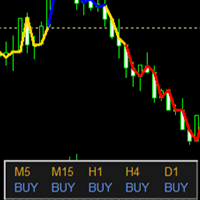
The trend indicator has the ability to adjust the viewing depth and sensitivity, does not repaint and does not lag. In addition to the current trend, the chart displays trends for 5 more periods with zero trend levels for them. This allows for a comprehensive assessment of the nature of the trend movement. There is a possibility to choose the trend algorithm settings {Only Open, Average Open/Close, Average High/Low} The trend indicator can be used for any Forex financial instruments. The color s

Adaptive Momentum Oscillator (AMO) – Next-Gen Momentum Indicator Overview The Adaptive Momentum Oscillator (AMO) is a powerful technical analysis tool that dynamically adjusts its sensitivity to market conditions by incorporating adaptive lookback periods, noise filtering, and normalization techniques . Traditional momentum indicators use fixed lookback periods, which can lead to inefficiencies in trending and ranging markets. The AMO overcomes this limitation by adapting its calculation based o
Unlock Institutional Trading Insights with Our Advanced Supply & Demand Zone Indicator Harness the power of institutional trading strategies with our cutting-edge Supply & Demand Zone Indicator —a game-changing tool designed to pinpoint high-probability entry and exit points in any financial market. By identifying where institutional buyers and sellers are positioned, this indicator gives you the edge to trade alongside the pros and capitalize on major market reversals. Why This Indicator Is
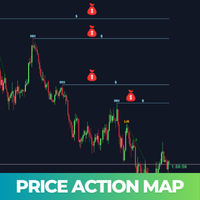
Price Action Map is an advanced trading indicator meticulously designed to provide clear visual insights into market structure by precisely labeling Higher Highs (HH) , Higher Lows (HL) , Lower Highs (LH) , and Lower Lows (LL) . Traders who find it challenging to accurately identify higher highs, lower lows, or understand different market phases will find this tool exceptionally valuable. Price Action Map significantly simplifies the analysis process, enabling traders at all skill levels to conf

Currency Strength Indicator - Track Market Power
Overview: Gain a competitive edge with the Currency Strength Indicator for MetaTrader 5. This intuitive tool measures the relative strength of 8 major currencies and displays them in a clear, sortable table directly on your chart. Perfect for forex traders looking to identify strong and weak currencies at a glance. Key Features: Dynamic Strength Table: Displays real-time strength for EUR, USD, GBP, JPY, CHF, AUD, CAD, and NZD in the upper-left c
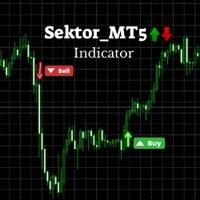
SektorMT5 - Advanced Trading Indicator Specification Automated Buy/Sell Signal Indicator for Meta Trader 5 (MT5)
Setting Description Recommended Value Timeframe (TF) The recommended chart timeframe for optimal signal accuracy. H1 (1 Hour) Symbol The financial instrument on which the indicator works best. XAUUSD (Gold) Lookback Period Number of candles used to determine breakout levels. 24 Candles (Adjustable) Buy Signal Green upward arrow appears when price breaks above resistance. Displayed on

BVP - Gelişmiş Alıcı/Satıcı Piyasa Tarayıcısı
BVP (Alıcı/Satıcı Paneli) ile çoklu zaman dilimlerinde gerçek zamanlı piyasa duyarlılığını deneyimleyin - modern yatırımcılar için tasarlanmış sofistike bir piyasa analiz aracı. Neden BVP?
Günümüzün dinamik piyasalarında, alıcı ve satıcı hakimiyetini anlamak çok önemlidir. BVP, M1'den D1'e kadar 12 zaman diliminde anlık görsel geri bildirim sağlayarak, piyasa değişimlerini belirgin hale gelmeden önce fark etmenize yardımcı olur. Temel Özellikler
Dina
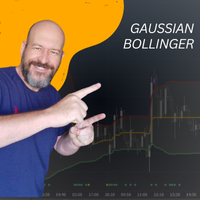
Gauss Hareketli Ortalama ile Gauss Bollinger Bantları ️ Gelişmiş Matematik ile teknik analizin pratik verimliliğini birleştiren yenilikçi bir indikatör ile ticaret stratejinizi dönüştürün! ️ İster yeni başlayan ister deneyimli bir yatırımcı olun, Gauss Bollinger Bantları , piyasa analizlerinizi bir üst seviyeye çıkarmak isteyenler için mükemmel bir çözümdür. Bu özel indikatör, geleneksel hareketli ortalamayı Gauss Hareketli Ortalama (GMA) ile değiştirerek, piyasadaki gerçek koşullara d

This is an indicator to determine when to sell or buy, and it can be combined with other indicators, such as the SND indicator that I also sell. This indicator is very suitable for BTC, XAU, and NAS100. This is an indicator for MT5. It is highly battle-proven if studied properly. Please consult andriawanjaya@gmail.com before using it. This product is very suitable for XAU, BTC, and NAS100. This product is very limited It is only sold on Gogo Jungle and MQL5.

Ticaret dünyasında, her tik yeni bir hikayenin başlangıcı olabileceği için güvenilir bir müttefike sahip olmak çok önemlidir. TrendVarianceSpectrum sadece bir ticaret robotu değil; aynı zamanda dalgalı piyasalarda size rehberlik eden bir kılavuzdur. Yılların deneyimiyle geliştirilmiş ve 25 yılı aşkın veri üzerinde eğitilmiş olan bu sistem, matematiğin zarafetini modern teknolojinin gücüyle birleştirir. TrendVarianceSpectrum'un Temel Avantajları: Minimum Drawdown: TrendVarianceSpectrum, önemli

Smart Detector — Akıllı Para ve ICT Sırları Avucunun İçinde!
Büyük oyuncular gibi ticaret yapmak ister misin? Smart Detector, "Akıllı Para" (Smart Money) ve Inner Circle Trader (ICT) stratejilerinin dünyasını açıyor. Bu MetaTrader 5 göstergesi, piyasa yapıcıların izlerini bıraktığı kilit bölgeleri anında tespit eder: güçlü emir blokları ve gizli Fair Value Gap (FVG) boşlukları. Likiditenin nerede saklandığını öğren ve bunu kendi avantajına kullan! Akıllı Para: Bankaların ve hedge fonlarının har
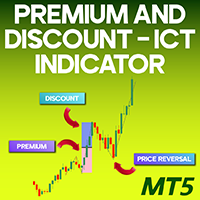
Premium and Discount PDA ICT Indicator for MT5 The Premium and Discount Indicator for MetaTrader 5 is a liquidity-based tool that tracks short-term market movements using a zigzag pattern. It highlights premium and discount zones, assisting traders in identifying optimal entry points and setting Take Profit (TP) and Stop Loss (SL) levels. This indicator is specifically designed to detect minor market shifts, placing a "D" at significant lows and a "P" at key highs. By clicking these markers, tra

TimeView Pro – Grafiklerinizde Zamanı Net ve Düzenli Görüntüleyin TimeView Pro, MetaTrader 5 grafiklerinde yerel saati gösteren, tamamen özelleştirilebilir bir göstergedir. Grafik düzeninizi bozmadan net ve anlaşılır bir zaman göstergesi sunar. Ana Özellikler Mum Çubuğuna Otomatik Hizalama – Saat etiketi en yakın muma otomatik olarak hizalanır (varsayılan olarak açık). Hızlı Kısayol Tuşu – Click Chart + H tuşları ile saati kolayca açıp kapatma. Özelleştirilebilir Çizgiler – Yatay çizgileri (vars

JAJ Binary Pro is a precision-driven binary options strategy created by Jamaine Walkin , a full-time trader and investor. Designed for adaptability in Forex and OTC markets , it focuses on high-probability trade setups and disciplined risk management. Optimised for Pocket Option & MT5 , it reflects Jamaine’s structured approach to trading Options, ensuring consistency and confidence in execution.
Always use Proper Risk Management when trading.
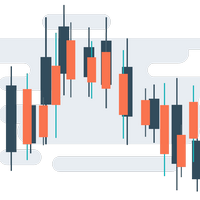
Bu gösterge öncelikle manuel ticaret için tasarlanmıştır. Gösterge son fiyat hareketlerini analiz eder. Ve bunları kendi algoritması ile işler. Bu analize dayanarak gösterge en önemli fiyat seviyelerini hesaplar. Bu seviyeler fiyat değerlerini üç bölgeye ayırır - alış, satış ve nötr. Yeni pozisyonlar yalnızca fiyat uygun bölgede ise açılmalıdır. Eğer fiyat nötr bölgede ise pozisyonları kapatmayı, breakeven noktasına taşımayı vb. düşünmeniz gerekir. Ayrıca gösterge pozisyon açmak için kendi öner
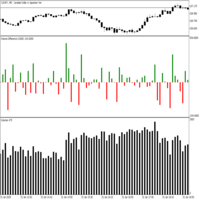
An indicator showing the difference between the vertical volume columns, with it you will see where exactly the largest volume surge was relative to the previous volume, often the largest volume surge is not at peak values, so sometimes it is difficult to notice, and you will also be able to see where on an increasing or decreasing interval the speed of increase or decrease in volume increases or decreases. This indicator can also be used to confirm simple and complex patterns, since the size o

PipHistogram is an essential tool for traders who want to gain insight into price distribution and concentration. Its customizable, visually appealing histogram allows you to pinpoint key levels and make more informed trading decisions. Enhance your market analysis and improve your trading strategy with PipHistogram —your shortcut to understanding price dynamics in MetaTrader 5. Overview : PipHistogram is a powerful indicator for MetaTrader 5 that visually displays the percentage distribu

The best and the only World Time Display for MT5
Features :
- JAPAN, LONDON & NEW YORK Time Display
- You can customize with different Font, Color And Text Size
- You can customize Box Position and Box Color to meet your satisfaction
- Only For Metatrader 5
- Customize GMT according to your Time Zone
- Simple To Use. Just Attach to your MT5
- No hidden code or no errors

Introduction to the Manual Backtesting Indicator on MQL5 The MetaTrader platform provides an excellent backtesting tool for evaluating Expert Advisors (EAs). However, when it comes to manually backtesting a strategy to assess its effectiveness, this tool has some limitations: You cannot manually draw zones or trend lines while in backtesting mode. You cannot switch timeframes to check time alignment. For example, if my strategy requires additional confirmation from a higher timeframe (HTF), this
Product Name : SII - Synthetic Indices Indicator
Overview :
The SII (Synthetic Indices Indicator) is a specialized trading tool designed to identify high-probability levels in synthetic indices using imbalances. By leveraging the concept of imbalances, SII provides traders with precise insights into potential market reversals and continuations, enhancing trading accuracy and decision-making.
Key Features
1. Imbalance Detection: SII automatically identifies and marks imbalances on the chart,

Candle Reversal , is designed to identify and highlight key candlestick patterns that signal potential trend reversals or continuations in the market. It focuses on two primary types of patterns: 3-Line Strike Patterns (Bullish and Bearish) Engulfing Patterns (Bullish and Bearish) The indicator provides visual cues (arrows and text labels) on the chart to help traders quickly identify these patterns, making it easier to make informed trading decisions. use with MACD or awesome oscilator to

The Time_Price_SQ9_Degree indicator is based on the 9 Gann square. Using this indicator, you can identify strong time and price zones. The indicator displays the levels as a degree value. The degrees can be set in the settings. After launching, the MENU button appears. If it is highlighted, it can be moved to any point on the graph, and after double-clicking on it, it stops being highlighted and menu buttons appear. To hide the menu, just double-click on the button, it will become highlight

VANGARD Trade Info MT5 – Gelişmiş Ticaret Bilgileri ve Tam Kontrol! VANGARD Trade Info MT5 , gerçek zamanlı işlem takibi yapmak isteyen yatırımcılar için vazgeçilmez bir araçtır . Özelleştirilebilir gizlilik ayarları, ayarlanabilir arayüz ve akıllı marjin uyarıları ile işlem bilgileri, marjin seviyeleri, swap ve işlem maliyetleri gibi detayları optimize edilmiş bir arayüzde sunar, böylece daha hızlı ve verimli kararlar almanıza yardımcı olur. Neden VANGARD Trade Info MT5'i Seçmelisiniz?

Sapma Algılamalı Gelişmiş Stokastik Gösterge - Scalping
MetaTrader 5 platformu için titizlikle tasarlanmış son teknoloji Stokastik Göstergemizi tanıtıyoruz. Bu araç, yatırımcıların piyasa hareketlerini tahmin etmelerine ve karlılığı en üst düzeye çıkarmak için işlem stratejilerini optimize etmelerine olanak tanıyan gelişmiş bir sapma tespit özelliğini bünyesinde barındırıyor.
Stokastik Göstergemizin Rekabet Avantajları:
Bu gösterge, kısa zaman dilimlerinde yüksek hassasiyetle işlem yapmak is

Supertrend is a trend-following indicator based on Average True Range (ATR). The calculation of its single line combines trend detection and volatility. It can be used to detect changes in trend direction and to position stops. History The Supertrend indicator was created by Olivier Seban. Calculations To calculate bands of the Supertrend, use the following formulas: hl2 = (high + low) / 2 basicUpperBand = hl2 + (multiplier × ATR) basicLowerBand = hl2 - (multiplier × ATR) upperBand = basicUpper

PMax is a brand new indicator developed by KivancOzbilgic in earlier 2020. It's a combination of two trailing stop loss indicators; One is Anıl Özekşi's MOST (Moving Stop Loss) Indicator and the other one is well known ATR based SuperTrend. Both MOST and SuperTrend Indicators are very good at trend following systems but conversely their performance is not bright in sideways market conditions like most of the other indicators. PMax tries to solve this problem. PMax combines the powerful sides of

MATRIX Market Scanner
Comprehensive Analytics Without the Complexity Our innovative, cell-based dashboard gives you a panoramic view of the market—letting you monitor multiple instruments and timeframes seamlessly. Its high level of customization delivers an intuitive, dynamic display that adapts to your trading style, empowering you to see the bigger picture and make smarter, faster decisions. New Update The latest update to the Indicator Matrix Market Scanner introduces a powerful new feature

"Unlock deeper market insights with our advanced MQL5 Volume Indicator! This tool combines real-time volume data with an EMA25 overlay, highlighting key zones where volume surges at least 1.5 times above the EMA25—perfect for spotting high-impact trends. Customize colors and opacity effortlessly to suit your style. Plus, streamline your charts by disabling MT5’s default volume display: simply go to the chart settings, uncheck the built-in volume option, and let our indicator take the lead. Prec

A powerful trend-following tool that uses ATR-based volatility to identify market trends across multiple timeframes . This enhanced version allows you to overlay the SuperTrend of a higher timeframe directly on your current chart, helping you align your trades with the dominant trend. How It Works The indicator calculates dynamic support and resistance levels using Average True Range (ATR) : Upper Band = Source Price + (Multiplier × ATR) Lower Band = Source Price - (Multiplier × ATR) In an uptre
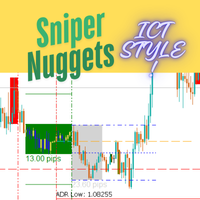
!!!!!!!! Sniper Nuggets !!!!!!!!
Sniper Nuggets is an all-in-one indicator for many things ICT style. It includes the following functionalities: Custom periods : which allow you to set custom daily period start and end times according to your taste. ADR Markers: which plots the average daily range. Worktime: which plots the various boxes on the chart for Asia range (including its high, low and midpoints, standard deviation predictions ), London open, New York open, CME open and London close.

### Introducing the Price Action Ultimate Suite – The Ultimate Trading Tool for Professional Traders!
Are you searching for a powerful tool to elevate your Price Action trading strategy? Look no further than the **Price Action Ultimate Suite** – a comprehensive and intelligent indicator for MetaTrader 5 (MT5) – designed to be your trusted partner in conquering the financial markets! Packed with advanced features and user-friendly functionality, this indicator helps you identify key price patte
Hello, traders! Welcome to the introduction of Multi Timeframe Analyzer v1.0 ! ( MT5 )
This is the Meta Trader 5 version of the "Market Meeter". Click here to Get MT4 version <<---
What is this indicator? Simply put, this indicator analyzes the market across eight different timeframes , from lower to higher, and predicts the next price direction along with an estimated continuation time. It does this by using volume, volatility, and price patterns in its calculations. Let's dive into the inf

A powerful high-frequency tick analysis tool that automatically processes vast streams of market data and provides traders with an accurate picture of market activity to seize trading opportunities. Easily adaptable to any trading style, TickFlow becomes your personal analytical assistant, instantly responding to market changes and helping to identify key support, resistance, and cluster zones. TickFlow is a modern analytical platform that combines intelligent big data processing with intuitive
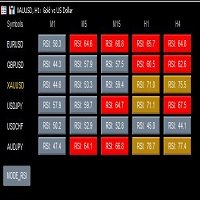
This is a powerful multi cycle, multi currency pair, and multi indicator monitoring tool for MT5 version, with main functions including: 1. Monitor real-time performance of multiple indicators, including RSI, MACD, MA, and STO. 2. Monitor multiple currency pairs, customizable to add or delete currency pairs, and automatically update indicators. 3. Monitor multiple currency pairs over multiple cycles. 4. After clicking, you can directly switch to the chart and cycle you want to view. 5. Click th

This is a custom indicator script for MetaTrader, designed to generate buy and sell signals based on price action relative to Bollinger Bands. It identifies potential trade opportunities when the closing price crosses the lower Bollinger Band, plotting arrows on the chart to highlight entry points. Key Features: Buy and Sell Signals: A buy signal is generated when the closing price moves above the lower Bollinger Band after being below it. A sell signal is triggered when the closing price moves
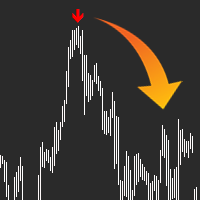
QUICK OVERVIEW: Use AI to predict the markets with AI Arrow, the ultimate trading tool, let it manage the probabilities and send you a simple signal in the form of an arrow, ready to trade, no complex configurations. The indicator will analyze the market and let you know when a potential movement will happen, sometimes it takes some extra bars for the movement to happen as it can't predict the exact top/bottom every time. Arrow will appear at the start of a new bar and alert you, so you have ti

Scalping Signals Pro is a powerful custom indicator designed to help traders identify key market turning points with ease. It provides clear Buy and Sell signals directly on the chart, making it ideal for traders who want to enhance their decision-making process. Key Features:
️ Intuitive and user-friendly interface
️ Non-repainting Buy and Sell signals
️ Works across different timeframes and assets
️ Designed for trend-following and reversal strategies
️ Customizable settings to fit yo

AdaptiveMomentumCCI Indicator
The AdaptiveMomentumCCI is a custom technical indicator for MetaTrader 5 that enhances the traditional Commodity Channel Index (CCI) by incorporating adaptive period adjustments, momentum analysis, and signal filtering. It calculates a smoothed CCI based on a user-defined price source (e.g., HLC/3, OHLC/4, or close), with its period dynamically adjusted using the Average True Range (ATR) to reflect market volatility. The indicator features a dual-line system with

Mini Índice Composition: A Revolução na Análise do Mini Índice! O Mini Índice Composition é um indicador inovador que monitora em tempo real as principais ações que compõem o mini índice, trazendo uma visão quantitativa poderosa sobre o fluxo de ordens do mercado! Como Funciona? Diferente de outros indicadores que utilizam apenas dados históricos, o Mini Índice Composition faz uma leitura ao vivo das ordens que entram e saem das ações, pesando o impacto direto no mini índice. Com

Buy Signal Indicator This indicator generates a Bu y Signal when a potential upward movement is detected. A G reen Arrow appears below the price chart, indicating a possible entry point for a long position. The signal helps traders identify moments of strength in the market.
TIP:- USE 1 HOUR OR BIGGER TIMEFRAMES FOR BETTER RESULTS. TRAIL STOP LOSS BY USING NEAREST SWING HIGHS AND LOWS. NOTE:- THIS INDICATOR GIVES ONLY BUY SIGNALS FOR SELL SIGNAL USE MY OTHER INDICATOR.

Sell Signal Indicator This indicator generates a Sell Signal when a potential downward movement is detected. A Red Arrow appears above the price chart, indicating a possible entry point for a short position. The signal helps traders identify moments of strength in the market.
TIP:- USE 1 HOUR OR BIGGER TIMEFRAMES FOR BETTER RESULTS. TRAIL STOP LOSS BY USING NEAREST SWING HIGHS AND LOWS. NOTE:- THIS INDICATOR GIVES ONLY SELL SIGNALS FOR BUY SIGNAL USE MY OTHER INDICATOR.

MATRIX CURRENCY - Power of Multi-Timeframe Analysis DESCRIPTION Matrix Currency is a professional indicator that revolutionizes your Forex market analysis through a dynamic currency strength matrix. Developed for traders seeking precision and efficiency in their operations. MAIN FEATURES: ️ Multi-Timeframe Analysis Monitors 9 timeframes simultaneously (M1 to MN1) Real-time updates Intuitive color matrix visualization Smart Alert System Customizable notifications Alerts via pop-up,
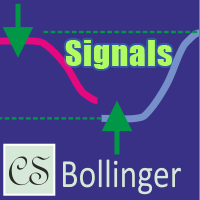
CS Bollinger – Bollinger Bantları temelli, görsel işlem sinyalleriyle önemli destek ve direnç seviyelerini hızlıca belirlemek için geliştirilmiş bir sinyal göstergesidir. Geliştirilmiş seviye geçiş mantığı sayesinde gösterge, grafik üzerinde seviyeleri otomatik olarak ayarlar ve fiyat dönüşleri onaylandığında sinyal oklarını görüntüler. Bu, yatırımcıların piyasaya giriş ve çıkış için uygun anları hızlıca bulmalarını sağlar. Gösterge, esnek ayarlarıyla kişisel işlem stratejilerine uyarlanabilir v

This is a true trend lines indicator for MT4/MT5.
This indicator draw real trend lines.
Usually the trend line is drawn as a solid line.
The next trend line that is likely to be valid is drawn as a dotted line.
The most recent invalidated trend line is drawn as a dashed line.
Three-touch lines is drawn as a bright colors.
If the starting point of the trend line is new, the blue line is displayed(call shortline),
if it is old, the gold line is displayed(call longline).
The number of bars border

Parabolic SAR + Deviation [BigBeluga] is an enhanced Parabolic SAR indicator designed to detect trends while incorporating deviation levels and trend change markers for added depth in analyzing price movements. Key Features: > Parabolic SAR with Optimized Settings: Built on the classic Parabolic SAR, this version uses predefined default settings to enhance its ability to detect and confirm trends. Clear trend direction is indicated by smooth trend lines, allowing traders to easily visuali

Gösterge , alım satım sinyallerini gösterir . Zaman dilimi - herhangi biri , döviz çifti - herhangi biri. Ayarlar : alertsMessage - mesaj kutusunu devre dışı bırakır ve etkinleştirir. alertsSound - sesi kapatır veya açar. Ok Türü - ok simgesini seçmek için. Gösterge sinyallerini filtrelemenin üç basit yolu : Yönü göstergenin okumasıyla daha yüksek bir zaman diliminden kontrol etmek. Standart MACD diyagramını kullanın . Parabolik gösterg
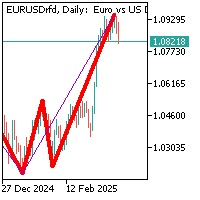
Bu göstergede 13 ve 55 farklı periyotlara sahip iki adet zikzak oluşur. Göstergenin iki segmenti oluştuğunda ve belirli bir zaman diliminde fiyatın minimum veya maksimumunu oluşturarak birleştiğinde, gösterge fiyatın ters yönde olası bir dönüşü işaret eder. Zigzag'ın en küçük periyodu (13) oluştuğunda, en büyük periyot (55) aynı minimum veya maksimumda kalırsa, bu, önceki maksimum veya minimum'a doğru bir düzeltme hareketinin mümkün olduğu anlamına gelir, bu da açık pozisyona lot pozisyonu eklem

Trend Risk Analyzer intelligently identifies trends, impulses, and corrections, calculating optimal trade volumes and safe levels for stop-loss and take-profit. Increase your accuracy, reduce risks, and boost your trading profits! This product is also available for MetaTrader 4 => https://www.mql5.com/en/market/product/134800 The key feature of Trend Risk Analyzer is its capability to calculate the average range of each market element, enabling traders to set justified stop-loss and take-profi

API BullBearPower mtf MT5 Designed for traders who rely on BullBearPower, this tool provides a multi-timeframe (MTF) view of BullBearPower, helping you identify possible dominant trends. Key Features: Multi-Timeframe Analysis – Analyze BullBearPower across different timeframes in real time. Dynamic Color Changes – Identify possible BullBearPower per individual timeframe with color changes. Volume Integration – Get a picture of possible trend strength with BullBearPower volume of each time

Elite Market Precision Indicator: Outsmart Institutional Manipulation with Fibonacci & Pivot Synergy The Institutional Trap: Why Most Traders Fail The financial markets are a battlefield where institutional traders manipulate price action to create false breakouts, liquidity hunts, and engineered reversals. Most retail traders fall victim to these deceptive moves, leading to emotional trading, fake signals, and capital losses. The Solution: Precision Trading with Fibonacci, Pivot Points & Candle

Trend magic indicator uses cci and atr to create buy and sell in the market . this a a line that changes its color when any of the conditions occur ie buy and sell . I find the indicator given you a bit of a better entry when you change the parameters to CCI=20, ATR=100, ATR MULTIPLIER= 2.
Set up entry just above the indicatror afetr a retracement. Set your stop loss a 20 cents to a dollar (depending on share size) below your entry. Be ready to enter a new position above indicator again if you

The indicator is a combination of 3 identical moving averages with a JMA calculation option with different smoothing depth settings. When the fast line crosses the middle and slow lines, the color of all lines changes, and only when the fast line crosses the middle and slow lines in the opposite direction will the color change - a trigger is triggered that does not allow switching directions if only the middle or slow line was crossed, so that the readings do not jump and there is a confident

TickATR Indicator for MT5 Description The TickATR indicator is a powerful volatility measurement tool for MetaTrader 5 that displays the Average True Range (ATR) in terms of actual price ticks. This innovative approach provides traders with a more precise and instrument-independent way to gauge market volatility compared to traditional ATR indicators. By measuring volatility in ticks rather than price units, TickATR offers consistent readings across different instruments regardless of their pric
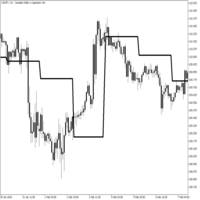
WapPrag: trend and level indicator, showing the most important level of the day, it analyzes the price and volume values of yesterday and with their help creates a level, only one at the very beginning of the day, and continues until the end of the day. The indicator shows the direction of the trend and its reversal as accurately as possible. It is well suited for trading on the trend.

Gold Rush Scalper The Gold Rush Scalper is a simple yet powerful trading indicator designed for scalping gold (XAU/USD) on the 5-minute chart. It provides clear Buy and Sell arrows, helping traders identify potential trade opportunities with ease.
Key Features:
Buy & Sell Arrows Only: No extra indicators, just precise entry signals. 5-Minute Timeframe : Specifically designed for fast-paced gold trading.
Gold ( XAU/USD ) Only: Not intended for other assets .
No Built-in Risk Management: Trade

FX QUICKSTRIKE Is a high-speed scalping tool designed for gold and forex pairs, providing precise buy and sell arrow signals on the 5-minute timeframe. It leverages momentum shifts, volatility spikes, and price action patterns to detect optimal entry points.
Trade Filtering: Avoids choppy markets by detecting low volatility zones to reduce false signals.
Lot Size Management: Recommends adjusting lot size based on account balance to prevent overexposure.
Spread Protection: Ensures trades are

HMM4 Indicator Documentation HMM4 Indicator Documentation Introduction The HMM4 indicator is a powerful technical analysis tool that uses a 4-Gaussian Hidden Markov Model (HMM) to identify market regimes and predict potential market direction. This indicator applies advanced statistical methods to price data, allowing traders to recognize bull and bear market conditions with greater accuracy. The indicator displays a stacked line chart in a separate window, representing the mixture weights of f

Spike Hunter B500 A precision trading tool designed exclusively for the B500 1-minute chart. It identifies sharp price movements and potential trade opportunities with built-in risk indication features to help manage volatility. Ideal for traders looking to capitalize on quick market spikes. Alert notifications Push notifications
Disclaimer: Trading involves significant risk of capital loss. You trade at your own risk. Past performance does not guarantee future results. Use proper risk manage
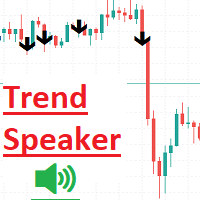
Trend Speaker göstergesi gerçek zamanlı olarak piyasa trendlerini kolayca izlemek ve analiz etmek isteyen tüccarlar için tasarlanmış güçlü bir araçtır. Grafikte net ve güvenilir alım ve satım sinyalleri sağlar, bu da piyasanın mevcut trendini değerlendirmeyi son derece uygun hale getirir. Kullanıcı dostu arayüzü sayesinde, Trend Speaker, potansiyel bir ticaret fırsatını kaçırmamanızı sağlar, bilinçli kararlar almanıza ve ticaret stratejinizi geliştirmenize yardımcı olur. Tüm ALIM ve SATIM sinya

Receive notifications for multi-trendline or single trendline breakout. Yes! You heard us right! You will be notified the moment price crosses any and all the timeframe trendlines that you have chosen. 1. ADDING MULTIPLE OR SINGLE TRENDLINES IN THE SAME DIRECTION To trigger a stronger trading opportunity you can require that price breaks one or more trend lines of different timeframes in the same direction. To do this navigate to the timeframe for which you want to add a trendline and click

Max Min Delta Indicator Gain Deeper Insights into Market Volume Imbalance with Delta Analysis What is the Max Min Delta Indicator?
The Max Min Delta Indicator is a powerful market volume analysis tool that visually represents maximum and minimum delta values using a histogram. It helps traders identify market strength, weakness, absorption, and aggressive buying/selling activity with precision. Key Features:
Histogram Visualization: Displays Max Delta (Green) and Min Delta (Red) as

The Naveen Dynamic Square MT5 is one of the best known technical analysis tools inspired by WD Gann along with the Gann Fan and Gann Box. It is considered a cornerstone of his trading technique that is based on time and price symmetry.
The Naveen Dynamic Square MT5 is a powerful tool in finance for determining support and resistance levels based on a stock's extreme price points. It works by extrapolating probable price levels from a central value, typically an all-time or cyclical high o
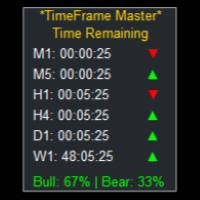
TimeFrame Master: Multi-Timeframe Countdown & Trend Analyzer Unlock the Power of Precise Market Timing with TimeFrame Master: Your Ultimate Multi-Timeframe Countdown Solution! Elevate your trading game with this revolutionary indicator designed to transform your MetaTrader into a powerful time management and trend analysis tool. Key Features: Real-Time Countdown Timers : Never miss a candle close again with precise countdown timers for all your favorite timeframes. Multi-Timeframe Analysis : M

Direct Scalping shows the most SUPER SUPER SUPER EARLY opportunity to scalp the market. Do entry as early as possible, as soon as the first sign appears, because the following signs are pretty much less important.
It plays sound alert so that you can wait the moment while doing something else.
Remember to cut loss below the '' area. Yes, it is not stop loss but cut loss. Made for M1 timeframe, but higher is good. My favorite setup: M5 with 4 indicators with different parameters: 15, 30, 45, an

Multi Currency Multi Time Market Scan Signals It is an Advanced multi-utility dashboard which works with full customization of signal settings and graphical interface. It works with Multi Symbols and Multi-Time frames from 1 SINGLE CHART TEMPLATE. It will automatically open the charts where the latest signals had formed- showing the important levels (Entry, Targets, Stop Loss) Many types of sorting methods for the scanner. A robust ENTRY based on TREND OF MULTI-TIME FRAMES ( Complex Signals
MetaTrader mağazası, MetaTrader platformu için uygulama satın almak adına rahat ve güvenli bir ortam sunar. Strateji Sınayıcıda test etmek için Uzman Danışmanların ve göstergelerin ücretsiz demo sürümlerini doğrudan terminalinizden indirin.
Performanslarını izlemek için uygulamaları farklı modlarda test edin ve MQL5.community ödeme sistemini kullanarak istediğiniz ürün için ödeme yapın.
Alım-satım fırsatlarını kaçırıyorsunuz:
- Ücretsiz alım-satım uygulamaları
- İşlem kopyalama için 8.000'den fazla sinyal
- Finansal piyasaları keşfetmek için ekonomik haberler
Kayıt
Giriş yap
Gizlilik ve Veri Koruma Politikasını ve MQL5.com Kullanım Şartlarını kabul edersiniz
Hesabınız yoksa, lütfen kaydolun
MQL5.com web sitesine giriş yapmak için çerezlerin kullanımına izin vermelisiniz.
Lütfen tarayıcınızda gerekli ayarı etkinleştirin, aksi takdirde giriş yapamazsınız.