MetaTrader 5용 무료 Expert Advisor 및 지표 - 20

NtickChart-BVcandle Features This is a free version with limited functionality.
This is a tick chart indicator that displays in a sub-window. Inspired by Bob Volman's (BV) scalping method, it is designed as a tool for achieving simple and effective trading. It is a tick chart specifically for day trading and scalping, focusing even on 1 pipette changes. Instead of time-based candle bars, it generates candle bars for a specified number of ticks (ticks_in_candle). This allows for a more detailed
FREE

Volume Analysis Trader looks at volume using a fixed average of volume. This averaging helps spot when volume is rising or declining. Also I have added volume spikes which are when volume suddenly is above the average. These help spot market reversals.
This will hep a trader look for the following in their trading:
Rising volume during a rally shows trend is strong. Falling volume on a rally shows trend is weakening. As a rule of thumb on daily charts if current volume is higher than yesterda
FREE
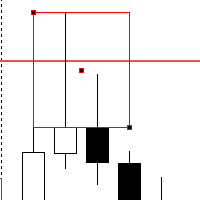
Introducing our Rejection Block Scanner – a powerful and intuitive tool designed to revolutionize your trading by effortlessly identifying key rejection zones across various timeframes. This cutting-edge scanner is crafted to cater to both beginner and experienced traders, offering unparalleled insights into potential market turning points.
**Key Features:**
1. **Multi-Timeframe Analysis:** Uncover opportunities on a grand scale! Our Rejection Block Scanner meticulously scans multiple timefra
FREE
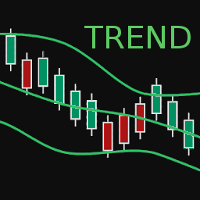
BBTrend is a relatively new indicator developed by John Bollinger to work with Bollinger Bands. It is one of only a few indicators that can signal both strength and direction making it a very valuable tool for traders.
Calculations The calculations are fairly simple. The default periods of 20 and 50 are shown, but these can be changed through the parameters. Lower = MathAbs(lowerBB(20) - lowerBB(50)) Upper = MathAbs(upperBB(20) - upperBB(50)) BBTrend = (lower - upper) / middleBB(20)
Interpret
FREE

혁신적인 전문가 어드바이저 Awesome Comparative를 통해 Awesome Oscillator 지표의 가장 효과적인 전략을 발견하세요.
Awesome Comparative를 사용하면 MetaTrader5 전략 테스터에서 포괄적인 테스트를 수행하여 귀하의 브로커, 선호하는 자산 및 시간대에 가장 적합한 Awesome Oscillator 전략을 결정할 수 있습니다.
저희 EA는 Saucer, Twin Peaks 및 Zero Line Cross와 같이 세 가지 포함된 전략을 제공합니다. 또한 이러한 전략을 9가지 다른 방식으로 조합할 수 있어 결과와 스크린샷을 예시로 얻을 수 있습니다.
Awesome Comparative의 장점 중 하나는 Awesome Oscillator 지표에 대한 독점적인 초점입니다. 추가적인 필터나 진입 트리거가 포함되지 않아 이 지표의 특성을 철저히 탐구하고 이해할 수 있습니다. 또한 포지션 종료를 변경하는 스탑로스나 테이크프로핏 레벨은 포함되어 있
FREE

Moving Average 4 TimeFrames
Display 4 moving averages of 4 different timeframes on the same chart. In order not to pollute the chart, the indicator will plot the complete average only in the current timeframe of one of the 4 registered averages, for the other timeframes of registered averages the indicator only displays a part of the average so that you know where it is at that time graphic.
Example:
Display on the 5-minute chart where the 200-period arithmetic moving average of the 5 minute
FREE
A 'Seconds Period' chart, offering enhanced precision for charting and analysis. Especially beneficial during volatile market conditions and intraday trading. This indicator addresses the limitations of MT5's predefined timeframes, allowing for finer granularity down to second intervals.
Since only one EA can run per chart, being an Indicator allows for the additional advantage of running an EA alongside the Seconds Timeframe Candles Indicator on the same chart. Compatible with any intraday tim
FREE

Certainly! Let me introduce you to a powerful tool for MetaTrader 5 (MT5) that can automatically identify and draw support and resistance (S&R) levels on your trading charts. This tool is called the “Support and Resistance Levels Guru” . Support Resistance Levels Guru The Support & Resistance Indicator automatically displays essential S&R levels on your chart. These levels are crucial for technical analysis and are used by many traders. Resistance levels (zones) are shown in R ed , while suppo
FREE

The indicator My Big Bars can show bars (candles) of a higher timeframe. If you open an H1 (1 hour) chart, the indicator puts underneath a chart of H3, H4, H6 and so on. The following higher timeframes can be applied: M3, M5, M10, M15, M30, H1, H3, H4, H6, H8, H12, D1, W1 and MN. The indicator chooses only those higher timeframes which are multiple of the current timeframe. If you open an M2 chart (2 minutes), the higher timeframes exclude M3, M5 and M15. There are 2 handy buttons in the lower r
FREE
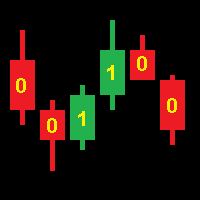
Operation of the CodEx Expert Advisor is based on patterns composed of consecutive candles. Positions are closed when opposite signals appear. Sequences of candles are encoded into an integer according to the following rule. The code number must be converted to binary form and the highest bit must be discarded. The resulting sequence of bits encodes a continuous sequence of candles, where 1 is a bullish candle, 0 is a bearish candle. The higher bits encode the earlier candles. For example: 19[10
FREE

"Here We Gold" is an EA suitable for trading XAUUSD with M15 timeframe. It has a principle for entering orders using indicators such as Candle pattern, MACD, and RSI. The profit principle involves using a Trailing stop. Recovery system, no grid Strategy. Info Minimum recommended account size: 300 USD Lot size : Fix lot 0.01 Timeframe : M15 Symbol : XAUUSD For better result, please use low spread broker. Recommended broker : IC Market
Live Account (Myfxbook): https://shorturl.asia/0axzG
FREE
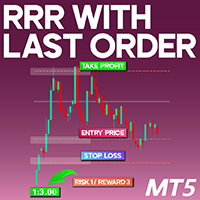
Risk-Reward Ratio with Last Order Indicator for MT5 The Risk-Reward Ratio with Last Order (RRO) Indicator is an essential tool designed for traders using the MetaTrader 5 (MT5) platform. This indicator helps users assess the risk-to-reward ratio of their trades by calculating the distance between the stop loss, take profit, and entry point . The resulting ratio is prominently displayed in the top left corner of the chart, allowing for quick and easy evaluation. «Indicator Installation & User Gui
FREE

At first, I got my teeth into Dragon Ultra Expert Advisor. Take your time to test demo. You should be always perfectly familiar with your Expert Advisor before a live trading. Based on the statistics, you are more likely to succeed if you learn from experience to use this. Dragon Lite is a free version for you to understand how the bot works. Parameter Trading Mode: Change to UNLIMITED. You should use the Dragon Training proficiently before using the Dragon Ultra .
The Forex Tr
FREE

Jackson Support and Resistance it a powerful advance support and resistance indicator which provide signal base on price action, it Design to make things easy for everyone to draw support and resistance. we believe most strategies are built with support and resistance as a foundation .Having support and resistance perfect can be a game change to you way of trading. It flexible to all instrument .don't forget to watch our video on how to us this indicator prefect and progressive.
FREE

Daily pivot are relatively important in trading.
This indicator have options to select 5 commonly use pivot point calculations.
User input Choose Pivot Point Calculation (Method Classic, Method Camarilla, Method TomDeMark, Method Fibonacci or Method Woodies.) Choose Applied Timeframe for the calculation (M5, M15, H1, H4, D1, W1 etc) Can be attached to any timeframe Choose color of Pivot point Note:
For MT4, please refer here : https://www.mql5.com/en/market/product/22280
FREE

Volume Weighted Average Price (VWAP) is a trading benchmark commonly used by Big Players that gives the average price a Symbol has traded throughout the day. It is based on both Volume and price. Additionally we put in this indicator the MVWAP (Moving Volume Weighted Average Price). For those who do not know the usage and the importance od this indicator I recommend a great article about this subject at Investopedia ( https://www.investopedia.com/articles/trading/11/trading-with-vwap-mvwap.asp
FREE

The "Matrix Series" indicator is a technical analysis tool designed to identify potential support and resistance zones by visualizing overbought/oversold conditions and trend direction using a combination of price data and customizable parameters, incorporating Commodity Channel Index (CCI) to highlight potential reversal points within the market.
Key features of the Matrix Series indicator: Dynamic Zones: Calculates support and resistance levels based on CCI values, allowing users to adjust th
FREE

Indicator IRush uses a modified version of a popular indicator RSI (Relative Strength Index) to look for entries on a daily chart or lower. The indicator has been set up and tested with the major symbols: AUDUSD, EURUSD, GBPUSD, USDCAD, USDCHF, and USDJPY. An automated trading with this indicator is implemented in the expert advisor Intraday Rush . This expert advisor can open, trail and close its trades. Check it out, it may be exactly what you are looking for!
A Correct Reading of IRush
The c
FREE

The Candle High Low Exit indicator uses the highest high and the lowest low of a range to draw trailing stop lines (orange under buys, magenta over sells) that advance with the trend until the trend changes direction. Moreover, the trailing stop lines are generated to support the order’s trend direction (long or short): In an upward trend, the long trailing stop line (orange line under buy) appears and advances upward until the close crosses under the line.
In a downward trend, the short trai
FREE
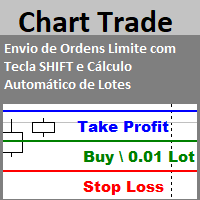
Envio de Ordens Limite com Tecla SHIFT (Cálculo Automático de Lotes) Funcionalidades: Definição de Níveis: Estabeleça os níveis de Stop Loss, Take Profit e o preço da ordem utilizando a tecla SHIFT e cliques do mouse. Cálculo Automático de Lotes: Os lotes são calculados automaticamente com base no risco da conta.(A opção também para usar volume fixo) Gerenciamento de Posições: Botão para fechar todas as posições abertas enviadas pelo EA. Botão para cancelar todas as ordens pendentes enviadas pe
FREE

EA는 수익성 있는 포지션을 검색하고 마감함으로써 수익성 없는 포지션을 마감할 수 있습니다 .
이 조수는 모든 직위 중에서 터미널에서 가장 수익성이 낮은 직위를 찾습니다 . 또한, 나머지 수익성 있는 포지션을 검색하여 하나 이상의 포지션의 이익이 다른 포지션의 손실보다 클 때 손실을 보상할 수 있는 일련의 포지션을 계산합니다. 그러한 포지션 세트가 발견되면 고문은 해당 포지션을 닫습니다. 일련의 위치는 절대적으로 모든 위치로 구성될 수 있습니다. 최대 수는 조언자 설정에서 조정 가능합니다. 검색 시 최소 손실 금액과 마감 시 추가 이익을 지정할 수도 있습니다. MT4 버전
전체 설명 구입 방법
설치하는 방법
로그 파일을 얻는 방법 테스트 및 최적화 방법 Expforex의 모든 제품 전략 테스터에서 Expert Advisor를 테스트하고 시각적 모드에서 EAPADPRO 도구 모음을 사용하여 거래할 수 있습니다! 차트에서 Cl
FREE

This Expert Advisor examines signals from indicators such as MACD, Stochastic, and RSI to identify market trends and turning points. It incorporates multiple strategies and works seamlessly together. The Advisor analyzes the market situation in real time and automatically executes trades at predefined stop loss and take profit levels. HydraAlchemist is also easy to use. The intuitive and easy-to-understand setup screen allows you to execute trading strategies with few parameters. When trading Go
FREE

The Fisher Transform is a technical indicator created by John F. Ehlers that converts prices into a Gaussian normal distribution. The indicator highlights when prices have moved to an extreme, based on recent prices. This may help in spotting turning points in the price of an asset. It also helps show the trend and isolate the price waves within a trend. The Fisher Transform is a technical indicator that normalizes asset prices, thus making turning points in price clearer. Takeaways Turning poi
FREE

TransitGhost Signal indicator, this is one of my best forex trading strategy. The strategy is based on the simple moving average cross, 5 SMA AND 200 SMA of which take a longer time to cross. Whenever the is a cross between the 5 SMA and 200 SMA a signal will be given, when the 5 SMA cross the 200 SMA to the upside ,a buying arrow will appear on chart, and push notification(alert) "Buy now, use proper risk management" will be sent on both the MT5 PC and mobile app, and when the 5 SMA cross the 2
FREE
Exponential Moving Average indicators are widely used by Forex traders all around.
This EA uses a simple Scalping Strategy using 4 exponential moving averages and have lots of config parameters. EMA1: 9 | EMA2: 13 | EMA3: 21 | EMA4: 200 Basically the EA Strategy place an order when it detects that the last candle touched the 3ª EMA line and the last 5 candles do not touch it.
In order to know more about the strategy, we presented it in our youtube channel: Video with EA Strategy Details: htt
FREE

소개용으로는 무료입니다. 제가 $198에 제공하는 유료 버전을 확인해 보세요.
https://www.mql5.com/en/market/product/136928
이 봇은 이동 평균(MA) 교차 전략을 사용하며, 위험 관리 기능과 마틴게일 기능(선택 사항)이 내장되어 있습니다.
핵심 매개변수:
MagicNumber - 충돌 방지를 위한 봇 거래 고유 ID FixedLotSize - 기본 거래 규모(예: 0.01) FastValue/SlowValue - 빠른 이동 평균과 느린 이동 평균의 기간(예: 3 및 6) ReverseLogic - true: 빠른 이동 평균이 느린 이동 평균을 상향 교차할 때 매도; false: 표준 전략
리스크 관리:
SL_Pct/TP_Pct - 손절매/이익실현 가격 비율(0으로 설정하면 비활성화) UseMartingale - true: 손실 후 랏 크기 증가 LossesToActivate - 마틴게일 활성화에 필요한 손실 거래 MaxMartinga
FREE

Description: For a comprehensive understanding of our indicators, we invite you to explore the entire Q&A section within this MQL5 blog post here . The "Live Account Statistics" Indicator is a powerful technical analysis tool that provides real-time insights into the performance of your trading account. With this indispensable tool, you can access crucial account statistics, such as balance, equity, drawdown, and more, allowing you to make data-driven trading decisions. Key Features: Real-Ti
FREE

Corazon is an EA that operates using the martingale method, with carefully selected entry points. When a trade goes in the wrong direction, the EA will open martingale orders with increasing lot sizes and distances, then average the price and reset the overall TP for all the orders. Corazon EA also has options for trailing functionality for individual orders, trailing all martingale orders together, or only trailing the initial order.
FREE

Real Quants Forex Volatility Catcher for MT5 Introduction Real Quants Forex Volatility Catcher is a cutting-edge automated trading system designed specifically for MetaTrader 5. Developed through advanced machine learning and exhaustive data mining techniques, this system offers traders a robust strategy for navigating the complex terrains of the forex markets. With a commitment to rigorous testing that includes Monte Carlo simulations, walk-forward matrix optimization, and live execution valida
FREE
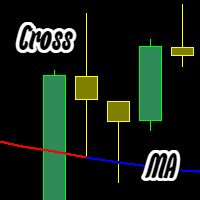
이 인디케이터는 두 가지 색상의 이동평균선(MA)을 표시합니다: 파란색 — 이전 봉의 시가와 종가가 MA 선 위에 있을 때. 빨간색 — 이전 봉의 시가와 종가가 MA 선 아래에 있을 때. 설정 가능 옵션: MA 유형 (단순, 지수, 평활, 선형); MA 기간; MA 색상 변경 시 알림. 문제가 있으면 알려주세요. 수정하겠습니다! bar cross Moving cross candle cross Moving cross bar cross MA cross candle cross MA cross bar cross Moving Average cross candle cross Moving Average cross bar
이 인디케이터는 두 가지 색상의 이동평균선(MA)을 표시합니다: 파란색 — 이전 봉의 시가와 종가가 MA 선 위에 있을 때. 빨간색 — 이전 봉의 시가와 종가가 MA 선 아래에 있을 때. 설정 가능 옵션: MA 유형 (단순, 지수, 평활, 선형); MA 기간;
FREE

INTRODUCTION : The breakout strength meter is a trading tool that is used to identify which currencies are the strongest to breakout, and which currencies are the weakest to breakout. The settings for the indicator are easy, and if you cannot find the settings, please leave a comment The tools are completely free to use Please, if you like the indicator, please leave a comment and rate the indicator in order to develop it
FREE
No Nonsense Forex 방법을 위한 트레이드 패널 차트를 깨끗하게 유지하면서 거래 속도를 향상시키십시오.
특징: -포지션 사이징: 매수/매도를 클릭하면 이 도구는 귀하의 위험에 가장 근접한 로트의 양으로 2개의 거래를 엽니다(각 거래에서 사용되는 잔액의 백분율). 핍 값 계산은 잊어버리세요!
-SL 및 TP: 각 거래는 1.5*ATR에서 손절매로 시작되고 1*ATR에서 이익실현으로 두 절반 중 하나가 열립니다. 사용된 ATR 값은 일일 양초를 완료하는 데 4시간 미만이 남은 경우 현재 양초 중 하나이고, 그렇지 않은 경우 이전 양초 값입니다.
- 손절매 업데이트: 손절매를 손익분기점으로 설정하거나 NNFX의 규칙에 따라 후행 손절매를 업데이트하십시오(가격이 2*ATR로 이동한 후 손절매를 1.5*ATR로 이동). -포지션 닫기: 종료 신호를 받으면 단 한 번의 클릭으로 모든 매수 또는 매도를 마감합니다.
기타 고려 사항: - 프로그램은 다른 전문가가 개설한
FREE

Resistance and Support is an easy to use indicator to apply horizontal lines of resistance and support. There are two windows for adding levels. When you press the button, a line appears on the price chart. It is possible to move this line with the mouse, thereby changing the indicator readings. In the indicator menu there is a choice of possible alerts - no alert, alert on touching the level and an alert for closing the candle after the level.
FREE

Seeing and interpreting a sequence of Candlesticks is easy to spot when you are a human... Higher Highs, Higher Lows, are the panorama of a Buying trend, at least in a short period of time... Seeing a current candlestick higher high and a lower candlestick low, as a human, you can immediately spot a "divergence", an "alert", a "starting range", but in the end and based on other analysis a human trader can understand and behave accordingly to this kind of candlestick data... But what about EAs (r
FREE

Willkommen in einer neuen Ära des Tradings mit dem AI Moving Average Indikator, einem fortschrittlichen MetaTrader 5 Indikator, der Tradern prädiktive Einblicke in Marktbewegungen bietet. Dieses Tool kombiniert die Leistungsfähigkeit von KI mit der Zuverlässigkeit eines Zero-Lag-Exponentialgleitenden Durchschnitts, um präzise und zeitnahe Vorhersagen über zukünftige Preisentwicklungen zu liefern. Innovatives Lineares Regressionsmodell Der AI Moving Average nutzt ein maschinelles Lernmodell der l
FREE

Revolution Martingale is an indicator designed for trading binary options on the M5 timeframe. Features: M5 Timeframe: It is recommended to use the indicator on the M5 timeframe for optimal trading. Trade Entry: Trades should only be opened on the first candle after a signal appears. Signals: A blue diamond indicates a buying opportunity for upward movement, while a red diamond indicates a buying opportunity for downward movement. Configured for Effective Binary Options Trading: The indicator i
FREE

The Martinware Manual Trading Helper indicator is aimed at helping people start their lives in manual trading. It can be used to display both some generic images at the right side of the graph, where custom operational remarks may be displayed or just a blank rectangle hiding the chart while backtesting. Moreover, it can periodically play a list of sounds. To show a blank rectangle, let the first image name input field empty and select the desired color. To show one or more custom images inste
FREE
Dynamic Arrow Pro – Precision Buy/Sell Signal Indicator
Works best on Higher Time Frames 30m,H1,H4,Daily
Overview : Dynamic Arrow Pro is a powerful, multi-timeframe buy/sell signal indicator designed for traders looking to enhance their decision-making process with clear, precise arrows on the chart. This indicator dynamically adjusts its settings based on the timeframe and provides reliable signals for trend-following strategies. Key Features : Dynamic Settings : Automatically adapts the in
FREE

거래 복사기 - 투자자 비밀번호 - 거래 복사 - MT4 x MT5 크로스 플랫폼
참고: 클라이언트 계정이 뒤따를 마스터 계정에 "Mirror Copier Master"가 필요하고 마스터 계정이 뒤따를 클라이언트 계정에 "Mirror Copier Client"가 모두 필요합니다.
블로그 : https://www.mql5.com/en/blogs/post/756897
작동 방식:
https://www.youtube.com/watch?v=V7FNpuzrg5M
MT4 버전
마스터 : https://www.mql5.com/en/market/product/114774
클라이언트: https://www.mql5.com/en/market/product/114843
MT5 버전
마스터 : https://www.mql5.com/en/market/product/114775
클라이언트 : https://www.mql5.com/en/market/product/114844
"
FREE

MT5 Grid Flowcon: An Automated Expert Advisor (EA) for USOIL, designed to deliver consistent cash flow through efficient and systematic trading strategies.
Key features include: Auto Demand & Supply Zones : Identifies and trades key supply and demand levels effortlessly. Grid Trading : Strategically places orders to capitalize on price movements within set ranges. Dynamic TP/SL with VWAP : Adjusts take profit and stop loss levels in real time using Volume Weighted Average Price. Drawdown Simul
FREE

Channels indicator does not repaint as its based on projecting the falling and raising channels. As a trader you need a path to be able to place your buy and sell trades such as: Supply and Demand , Falling & raising channels. Falling and raising channels can be in any time frame and also can be in all time frames at the same time and the price always flows within these channels. Experienced trades will draw the key levels and channels around the time frames. But, they will not be able to draw
FREE
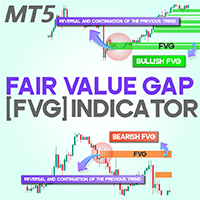
Fair Value Gap or FVG indicator MT5
The Fair Value Gap (FVG) Indicator is a valuable asset for traders using MetaTrader 5, designed to highlight market inefficiencies. An FVG occurs when an imbalance between supply and demand causes a rapid price movement. To understand this, picture three consecutive candlesticks; the space between the first and third candlestick represents the "FVG." This indicator automatically marks these gaps on the chart using dynamic boxes—green for bullish FVGs and red
FREE

The Kijun-Sen Envelope is a powerful trend-following indicator based on the Kijun-Sen line from the Ichimoku Kinko Hyo system. This tool creates dynamic upper and lower bands around the Kijun-Sen, forming an envelope that helps traders identify market trends, potential reversals, and overbought/oversold conditions.
Key Features: • Trend Confirmation – Helps determine whether the market is in a strong uptrend, downtrend, or ranging phase. • Support & Resistance Zones – The envelope acts as
FREE

The XU_30_913073101_S_HH_CF_SQX is an algorithmic trading strategy for MetaTrader, tested on XAUUSD (Gold) using the M30 timeframe from April 1, 2004, to April 24, 2024. There is no need to set up parameters, all settings are already optimized and fine-tuned.
Recommended broker RoboForex because of EET timezone.
You can find the strategy source code for StrategyQuant at the link: https://quantmonitor.net/gold-emperor/
Key details are:
Parameters
MagicNumber: 913073101
Main Chart: Curre
FREE
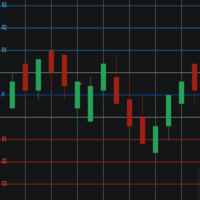
Pivot Points Levels Description The Pivot Points Levels indicator is an advanced and comprehensive tool for technical analysis based on support and resistance levels calculated from pivot points. This free indicator combines 6 different calculation methods with support for multiple timeframes, offering a robust solution for identifying key price reversal and continuation areas. Key Features 6 Calculation Methods : Traditional, Fibonacci, Woodie, Classic, DeMark (DM), and Camarilla Multi-Timefram
FREE

This is a buyer and seller aggression indicator that analyzes the shape of each candle and project this data in a histogram form. There are 4 histograms in one. On the front we have two: Upper - Buyer force. Lower - Seller force. At the background we also have two histogram, both with same color. They measure the combined strenght of buyers and sellers. This histograms can be turned off in Input Parameters. It is also possible to have the real or tick volume to help on this force measurement. IN
FREE

Hello this is MT5 version of my first EA Project - MA CROSS Simple MA Cross Fast and Slow with additional High Time Frame Filter. You can set manually to get optimum Result. It's suit for swing Trader that Trade on High Time Frame. ex. H1 / H4 with D1 Filter. Or you can modify It that follow your strategy.
Give me good feedback to improve for better version. Cheers!!
Hurry up FREE download for Limited Time!!
Please test It on Demo account or strategy tester before applied on Live Account
FREE

Wyckoff fans, enjoy!
Ideally to be used with the Weis Waves indicator, but it can be easily used alone, the Waves Sizer puts the range (in resulting Price movement) done by the Price on its market swings. You can control how accurate or loose will be the swings. This tool is very helpful for visually know how much the Price has traveled in your Timeframe. This way you can confront this level of effort with the resulting Volume, etc... Weis Waves indicator:
https://www.mql5.com/en/market/produc
FREE

Not Profitable, i could find optimisation, you can try
-Recommended Time Frame: 4H -Currency: GBPUSD -for 1000 USD is 0.02 -Recommended equity lots for 50x leverage = 200 -Recommended equity lots for 100x leverage = 100 -Recommended equity lots for 200x leverage = 50 -Recommended equity lots for 50x leverage = 200 -Recommended equity lots for 100x leverage = 100 -Recommended equity lots for 200x leverage = 50 BUT YOU CAN CHANGE YOUR OWN RISK SETTINGS
You can test using it in other time frames
FREE

This indicator is based on Mr. Mark Fisher's ACD strategy, based on the book "The Logical Trader."
- OR lines - A lines - C lines - Daily pivot range - N days pivot range - Customizable trading session - Drawing OR with the desired time Drawing levels A and C based on daily ATR or constant number - Possibility to display daily and last day pivots in color zone - Displaying the status of daily PMAs (layer 4) in the corner of the chart - Show the order of daily pivot placement with multi-day piv
FREE

All traders should know the trend before making their decision when placing the buy or sell orders. The first step always starts with supply and demand , rising and falling channels , trend lines, engulfing candles etc. All the above contribute to what is called “Price Action” and that is the best and most reliable way in trading and catching the trend and making profits, without stress. The Investment Castle Trend Line Indicator will automatically draw the trend lines on the MT5 for you.
FREE

McS Super Trend -This is one of the most popular classic trend indicators. It has a simple setting, allows you to work not only with the trend, but also displays the stop loss level, which is calculated by this indicator. Benefits:
Instruments: Currency pairs , stocks, commodities, indices, cryptocurrencies. Timeframe: М15 and higher. Trading time: Around the clock. Shows the direction of the current trend. Calculates the stop loss. It can be used when working with trading. Three types of no
FREE
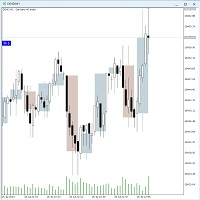
The Twotimeframe-Candles (RFrame) - Indicator for MT5 shows the candles of an higher, timeframe as an overlay on the current timeframe. You can choose the number of candles and color of the overlays. The indicator calculates the candle evevery tick. If you like the indicator, please left a comment. Version 1.1: The second time frame can now be set.
Keywords:
Candlestick, Multitimefram, Two Timeframes,
FREE
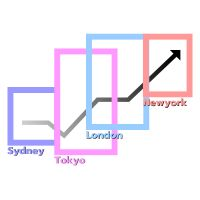
Time Zones and the Forex Market
The Forex market operates continuously 24 hours a day, facilitated by its global distribution across various time zones. The market is anchored by four primary trading centers: Sydney , Tokyo , London , and New York . Each trading center has specific opening and closing times according to its respective time zone. These differences significantly impact market volatility and trading opportunities during each session. Features Enable/Disable Date Display Enable/Di
FREE

설명 :
우리는 외환 시장(PSAR)에서 전문적이고 인기 있는 지표 중 하나를 기반으로 하는 새로운 무료 지표를 도입하게 된 것을 기쁘게 생각합니다. 이 지표는 원래 포물선 SAR 지표에 대한 새로운 수정이며, 프로 SAR 지표에서 점과 가격 차트 사이의 교차를 볼 수 있습니다. 교차는 신호가 아니지만 이동 가능성의 끝을 말하는 것입니다. 새로운 파란색 점으로 매수를 시작하고 첫 번째 파란색 점 앞에 손절매를 1 attr 배치하고 마지막으로 점이 가격 차트를 교차하는 즉시 종료할 수 있습니다.
매수 또는 매도 신호를 여는 방법은 무엇입니까? 첫 번째 파란색 점으로 공개 매수 거래 및 첫 번째 빨간색 점으로 공개 매도 거래
정확한 손절매는 어디에 있습니까? 안전한 정지 손실은 첫 번째 점에 있을 수 있습니다(구매의 경우 첫 번째 파란색 점, 매도의 경우 첫 번째 빨간색 점)
올바른 이익실현은 어디에 있습니까? 이익실현은 손절매 거리와 RR에 따라 조정할 수 있으므로 내 제
FREE
The Stochastic RSI (StochRSI) is a technical indicator that combines the characteristics of the Relative Strength Index (RSI) with the Stochastic Oscillator, resulting in a more sensitive tool that generates a higher number of trading signals. Developed by Tushar Chande and Stanley Kroll, the indicator was designed to overcome a perceived limitation of the traditional RSI: the low frequency of overbought and oversold levels activation (commonly 80 and 20), especially in less volatile assets. Ho
FREE

TG Ponto de Cobertura (Coverage Trade)
This Indicator checks your trading results on the day relative to the asset on the chart and adds a line at the price corresponding to the coverage point for the open position, considering the entry price and lot size. The coverage point will be recalculated after new entries, based on the average price of the open operation and the lot size.
If the result for the day is zero, a line will be displayed at the price of the current trade.
If the day's result
FREE
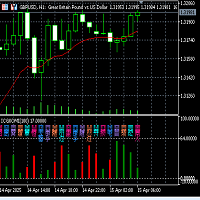
Fuxi Guaxiang Dual-color Oscillation Indicator Function and Usage Instructions (V2.1)
Fuxi Guaxiang Dual-color Oscillation Indicator Instructions: (1) This Guaxiang change indicator is based on the Yin-Yang transformation thought of the "Book of Changes" philosophy in ancient Chinese culture, integrating the results of the long-short game in each candlestick K-line period of the financial trading K-line chart, using China's oldest predictive coding method, in the form of the 64 Guaxiang of the
FREE

In this indicator you choice a data to be used from yesterday (high, low, open, close, etc) to automatically draw an line to be the zero. And, from that a percentage deviation ("Percentage to be used") is calculated and used to draw others line to both side until a limit be reached.
Both sides can have diferrent colours as show in screenshots. Also, more than one indicator can be used at same time.
FREE

Aurea Stella EA – Illuminate Your Trading Path Like the guiding stars that lead sailors through uncharted waters, Aurea Stella EA empowers you to navigate the unpredictable seas of the financial markets. Craft Your Own Constellation of Strategies: Endless Combinations – Weave together Bollinger Bands, Stochastic, RSI, MACD, Envelopes, and Donchian Channels to create your unique trading patterns.
Precision Control – Adjust stop loss, take profit, trailing stops, and choose whether to reverse
FREE

AliSession Highlight is an indicator that highlights a specific period of time according to your preferences. It can help you gain a clear vision of price movements into a specific session, the range of a session, and also to easily identify the high and low of the session. You can use it on any currency pairs, indices, and any timeframes. Settings: Start Hour: Set the hour to initiate the session highlight. Start Min: Set the minute for the start of the session highlight. End Hour: Specify the
FREE

Custom Panel allows you to gather all kind of important information and display it as one handy table in the upper right corner of the chart.
You can choose the contents of the panel yourself. Every row will show your own customized condition or value. Every column shows a different timeframe. The panel may contain up to 10 rows and up to 8 columns. Sample usage Row : Price > EMA(30)
Mode : YES_NO
Meaning : is current price above EMA(30)
Row : Ask < Bands[L]
Mode : YES_NO
Meaning : is current a
FREE

This indicator is based on the Bollinger Bands indicator. It helps the user identifying whether to buy or sell. It comes with an alert that will sound whenever a new signal appears. It also features an email facility. Your email address and SMTP Server settings should be specified in the settings window of the "Mailbox" tab in your MetaTrader 5. Blue arrow up = Buy. Red arrow down = Sell. Line = Trailing Stop. You can use one of my Trailing Stop products that automatically move the Stop Loss and
FREE

(Google 번역) 이 지표는 Worden Brothers, Inc 에서 개발한 원본 " TSV(Time Segmented Volume) "를 기반으로 합니다. 그러나 여기에 몇 가지 기능을 추가했습니다. 원본에서 사용하는 기본 종가만 사용하는 대신 적용할 가격을 선택할 수 있습니다. 실제 범위를 기반으로 하는 가상 볼륨을 포함하거나 볼륨 가중치를 전혀 적용하지 않는 등 사용할 볼륨 가중치를 선택할 수도 있습니다. (Original text) This indicator is based on the original “ Time Segmented Volume (TSV) ” developed by Worden Brothers, Inc . However, I added an extra few features to this one. One can choose the price to be applied, instead of only having the default close price us
FREE

Prompt Firm Ready! Limited Free Version ZenithPulse는 높은 빈도의 전략과 엄격한 리스크 관리가 결합된 강력한 정밀 거래 어드바이저로, EUR/USD에 대해 뉴스 발표 시 거래하며 즉시 발생하는 변동성에 반응합니다. 주요 특징: 간단하고 사용하기 쉬움: ZenithPulse는 설정과 이해가 매우 쉬워, 초보자든 숙련자든 상관없이 모든 트레이더가 빠르게 설정하고 기본 전략을 이해할 수 있습니다. 이 EA를 사용하려면 자동 거래 전문가일 필요가 없습니다. 자동 예약 주문: EUR/USD 시장의 중요한 포인트에 자동으로 Buy Stop 및 Sell Stop 주문을 배치하여, 수동 개입 없이 중요한 시장 움직임을 포착합니다. 고급 리스크 관리: 로트 크기, 스톱 로스 및 테이크 프로핏을 개인 설정에 맞게 조정할 수 있습니다. 또한, EA는 자동으로 스톱 로스를 조정하고 트레일링 스톱을 활성화하여 각 거래에서의 이익을 보호합니다. 브레이크
FREE

Clock GMT Live에는 중개인에 대해 더 많이 알아야 할 모든 것이 있습니다. 여러 번 귀하는 내가 있는 GMT 또는 내 중개인이 작업 중인 GMT를 궁금해할 것입니다. 이 도구를 사용하면 실시간으로 GMT와 브로커와 현지 시간의 시차, 브로커의 핑도 지속적으로 알 수 있습니다. 하루 중 시간에 배치하기만 하면 정보를 얻을 수 있습니다.
인수할 때마다 가격이 상승합니다. 이를 통해 소수만이 나만의 전략을 가질 수 있도록 보호하겠습니다. 내 다른 개발은 여기에서 볼 수 있습니다
정확한 타이밍은 거래에서 중요한 요소가 될 수 있습니다. 현재 런던 또는 뉴욕 증권 거래소가 이미 열려 있습니까, 아니면 아직 닫혀 있습니까? Forex 거래의 영업 시간은 언제 시작하고 끝납니까? 수동으로 거래하고 라이브로 거래하는 거래자에게 이것은 큰 문제가 아닙니다. 다양한 인터넷 도구, 금융 상품의 사양 및 시간 자체를 사용하여 자신의 전략으로 거래할 적기가 언제인지 빠르게 알 수 있습니다.
FREE

Highly configurable Adx indicator.
Features: Highly customizable alert functions (at levels, crosses, direction changes via email, push, sound, popup) Multi timeframe ability Color customization (at levels, crosses, direction changes) Linear interpolation and histogram mode options Works on strategy tester in multi timeframe mode (at weekend without ticks also) Adjustable Levels Parameters:
ADX Timeframe: You can set the lower/higher timeframes for Adx. ADX Bar Shift: you can set the of
FREE

This MetaTrader 5 indicator identifies and visually displays the trading hours of major financial markets (Europe, US, and Asia) on the chart. Through customizable colored fills, it marks the trading periods of each market, respecting server times (GMT+2) and excluding weekends. Market names are displayed near the top of the chart in Arial Black font, also with customizable color. The indicator automatically adjusts to the chart scale, maintaining the fill across its entire vertical range.
FREE

Gatotkaca Support Resistance Trendline Indicator is a simple indicator that detects support, resistance and trendlines. It will helps you find breakout momentum based on lines calculated by this indicator. This is conceptually based on fractals, but with customizable periods. Compatible for any timeframes. You can customize how this indicator work by setting up the period input.
FREE

"골드 트레이더"는 투자자와 트레이더가 금 시장에서 보다 일관되고 수익성 있는 투자 결정을 내리는 데 도움이 되도록 설계된 금융 로봇입니다. 이 로봇은 고급 데이터 분석 알고리즘을 사용하여 금 시장 동향을 실시간으로 분석하고 금 자산을 언제 매수, 매도 또는 보유해야 하는지에 대한 통찰력을 제공합니다.
"골드 트레이더"를 사용하면 투자자는 금 시장을 연구하는 데 시간을 들이지 않고도 투자 전문가의 기술적 분석에 대한 경험과 지식을 활용할 수 있습니다. 로봇은 각 투자자의 전략에 제시된 개념 내에서 개별적인 필요와 선호도에 맞게 맞춤화될 수 있습니다.
또한, "Ouro Trader"는 투자자에게 상당한 손실에 대한 더 큰 보호를 제공하는 고급 위험 관리 기능을 제공합니다. 이 로봇은 시장을 실시간으로 모니터링하고 시장 상황에 따라 투자 전략을 자동으로 조정하도록 설계되었습니다.
만약 당신이 금 시장에서 기회를 활용하는 데 관심이 있는 투자자 또는 거래자라면, "Gold Trad
FREE
MetaTrader 마켓은 거래 로봇과 기술 지표들의 독특한 스토어입니다.
MQL5.community 사용자 메모를 읽어보셔서 트레이더들에게 제공하는 고유한 서비스(거래 시그널 복사, 프리랜서가 개발한 맞춤형 애플리케이션, 결제 시스템 및 MQL5 클라우드 네트워크를 통한 자동 결제)에 대해 자세히 알아보십시오.
트레이딩 기회를 놓치고 있어요:
- 무료 트레이딩 앱
- 복사용 8,000 이상의 시그널
- 금융 시장 개척을 위한 경제 뉴스
등록
로그인
계정이 없으시면, 가입하십시오
MQL5.com 웹사이트에 로그인을 하기 위해 쿠키를 허용하십시오.
브라우저에서 필요한 설정을 활성화하시지 않으면, 로그인할 수 없습니다.