YouTube'dan Mağaza ile ilgili eğitici videoları izleyin
Bir ticaret robotu veya gösterge nasıl satın alınır?
Uzman Danışmanınızı
sanal sunucuda çalıştırın
sanal sunucuda çalıştırın
Satın almadan önce göstergeyi/ticaret robotunu test edin
Mağazada kazanç sağlamak ister misiniz?
Satış için bir ürün nasıl sunulur?
MetaTrader 4 için ücretli teknik göstergeler - 13

MT5 Version
Understanding market sentiment is a critical aspect of successful trading. Market sentiment refers to the overall feeling or attitude of traders and investors towards a particular financial instrument, such as a stock, currency pair, or cryptocurrency. It is a collective perception of market participants' emotions and beliefs about the asset's future price direction. Market sentiment can be bullish (positive), bearish (negative), or neutral (sideways). Knowing the market sentiment

このインディケータはボリンジャーバンドを裁量およびEAで実際に利用してきた私自身の経験から、より手軽に、かつ効果的に活用できるよう作成された裁量トレード用サインツールです。 ブレイクアウトでの順張り、リバウンドでの逆張りの両面で利用でき、各種のフィルター機能でより精度の高いサインを発信します 勝敗判定機能により、このインディケータの直近の相場環境に対する有効性を確認できます 全通貨ペア、全タイムフレームで利用できます。リペイントはしません
設定項目は以下の通りです。 Bollinger Bands Period
Bollinger Bands Deviation
Bollinger Bands Shift
Entry Mode ...ボリンジャーバンドにタッチしてからのBreakout(順張り), Rebound(逆張り)のどちらかを指定 Plus Filter ...独自アルゴリズムによるフィルターでシグナルの精度を高めます(Reboundモード専用) Trend Filter ...下で設定する移動平均のトレンド方向でのシグナルに限定します Moving Aver

MultiCurrencyWPR (MCWPR) indicator applies conventional WPR formula to plain Forex currencies (that is their pure strengths extracted from Forex pairs), market indices, CFDs and other groups of tickers. It uses built-in instance of CCFpExtraValue to calculate relative strengths of selected tickers. Unlike standard WPR calculated for specific symbol, this indicator provides a global view of selected part of market and explains which instruments demonstrate maximal gain at the moment. It allows yo
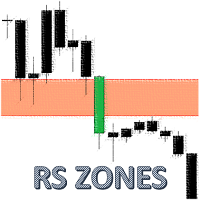
The indicator uses a mechanical approach to identify resistance/support zones and assess their levels of strength showing which price zones are more important than others. Resistance and Support are the main leading indicators used by most traders around the world. To be a successful trader, every trader needs to master the proper detection of price zones. This indicator was created to avoid subjectivity rules when drawing support/resistance zones. Most of the time, resistance and support are no

Ayak izi grafiği için çok talep edilen bir istek ekledim. Gösterge çok basittir ve teklif hacimlerini ve talep hacimlerini gösterir. Bu bir sinyal göstergesi değildir, sadece mumlardaki hacimleri gösterecek ve aynı zamanda geçmiş değerleri de gösterecektir. Forex'in merkezi bir hacmi yoktur, ancak bu parçalanır ve kene hacmini gösterir. Mum satmak istekleri, mum almak teklifleri gösterecektir. Tek bir analiz sistemi olarak veya diğer faktörlerle birlikte alınıp satılabilir. Piyasayı bu anlamda
Market Reversal Catcher Dashboard indicator looks for market reversal points or major pullback. To do this, it analyzes previous price movements and using a flexible algorithm for estimating the probability of a reversal, also gives recommendations on entry points and sets recommended profit targets for positions opened on a signal. The dashboard is designed to sit on a chart on it's own and work in the background to send you alerts on your chosen pairs and timeframes. Dashboard does not requi

View the institutional support and resistance on every time frame with alerts on and off buttons for each timeframe for instant chart decluttering. Monthly, Weekly, Daily, 4hour, 1hr, 30 min, 15min,5min etc. Ability to change colors each timeframe Solid or Outline Use bottom or top of Order Blocks as stop loss = defined risk
My Trading Story Began in 2013 in the wild west of the crypto market, I’ve spent over $10,000 on trading courses and what I've learned from this experience is that man

"SOLVE ALL YOUR PROBLEMS FOREVER WITH THIS UNIQUE TRADING SYSTEM!" Buy Trend Reversing PRO Indicator And You Will Get Forex Trend Commander Indicator for FREE !
The one who makes money from the forex market, wins by doing something very simple, he wins 6 out of every 10 trades. Of course for this you need a good indicator and proper money management if you ever hope to become a profitable trader. Anyone who doesn't do so ALWAYS ends up empty handed! Because, I'll say it again: "Traders who don

Grafiklerinizde trend çizgileri çizme sürecini otomatikleştiren yenilikçi MT4 göstergesi Auto Trendline ile tanışın. Manuel olarak trend çizgileri çizmenin sıkıcı ve zaman alan işine elveda deyin
ve Auto Trendline'ın işi sizin için yapmasına izin verin!
* Size talimatları ve adım adım kılavuzu göndermek için satın aldıktan sonra benimle iletişime geçin .
Gelişmiş algoritması ile Otomatik Trend Çizgisi sizin için trend çizgilerini otomatik olarak algılar ve çizerek
zamandan ve emekt

Emtia Kanalı Endeksi (CCI) göstergesinin çok para birimi ve çok zaman çerçeveli modifikasyonu. Parametrelerde istediğiniz para birimini ve zaman dilimlerini belirtebilirsiniz. Ayrıca panel aşırı alım ve aşırı satım seviyelerini geçerken bildirim gönderebilir. Noktalı bir hücreye tıkladığınızda bu sembol ve nokta açılacaktır. Bu MTF Tarayıcıdır.
Kontrol panelini grafikten gizlemenin anahtarı varsayılan olarak "D"dir.
Parametreler CCI Period — ortalama dönem. CCI Applied price — fiyat tür

Overview Automated smart money market structure identification following smart money concept and inner circle trader concept, it gives an unprecedented edge on your smart money and market structure analysis by automatically identifies valid market structure using smart money concept: Identify impulsive and corrective moves Identify valid pullbacks built by impulsive and corrective market moves Idenitfy bearish or bullish leg and their inducements for smart money concept Identify valid market st

Yalnızca HİSSE SENETLERİ(CFD'ler) İÇİN GÜNLÜK TİCARETİ.
Ticaret emek ister. Tüm girişleri ve çıkışları size bildirecek hiçbir kısayol veya gösterge yoktur. Kâr, akıl durumundan gelir. Göstergeler, para yönetimi ve başarı psikolojisi ile birlikte kullanılacak araçlardır. Hacim profilindeki dengesizlikleri bulun. Ticaret fiyat hacmi dengesizlikleri.
Kapanışta ve açılışta ve haberlerde birçok dengesizlik olur. Hisse senetlerinde alıcılara karşı satıcılara bakın. Fiyat üzerinde kimin kontrol sa

The liquidity swings indicator highlights swing areas with existent trading activity. The number of times price revisited a swing area is highlighted by a zone delimiting the swing areas. Additionally, the accumulated volume within swing areas is highlighted by labels on the chart. An option to filter out swing areas with volume/counts not reaching a user-set threshold is also included.
This indicator by its very nature is not real-time and is meant for descriptive analysis alongside other c

The intention of the dashboard is to provide a quick overview of the daily, weekly and monthly range of configured assets. In "single asset mode" the dashboard shows you possible reversal points directly in the chart, thus making statistics directly tradable. If a configured threshold is exceeded, the dashboard can send a screen alert, a notification (to the mobile MT4) or an email. There are various ways of using this information. One approach is that an asset that has completed nearly 100% of

v. 1.0 This indicator can show with maximum accuracy up to 1 bar the presence of a Maximum/minimum on the chart, regardless of the timeframe. It has a flexible configuration. You can use either one value on all TF, or you can use your own value on each TF individually.
This indicator is already being improved and those who purchase it receive all updates for free.
Next, it is planned to display an indication of the strength of the pivot point at each extremum (in % or in color drawing). It

This strategy is best used for Scalping and Binary Options. Strategy: There are 3 EMAs: Faster, Medium and Slower. When Price is Trending, wait for Price to bounce an EMA and scalp at each bounce. Features: - Check if 3 MAs are Stacked - Check Price Bounce Off MAs (Faster, Medium, Slower) - Min Distance Between Faster and Medium MA Filter - Max Distance Between Entry Price and Faster MA Filter - High Volume Check - Heiken Trend Check - Volatility Check - Higher/Lower Timeframes MA Stacked check
OTOMATİK SİPARİŞ BLOKLARI OSW
(METATRADER 5)
Bu gösterge, Sipariş Bloklarını önceden belirlenmiş bazı kurallara göre göstermekten sorumludur, bunlardan bazıları:
>önceki dürtüyü kıran bir dürtü vardır.
>Bulunduğu zaman oluşan şamdan formasyonunu bulmak, yerin en yüksek ve en düşük seviyesini en verimli şekilde hesaplamak, Order Block'un en yüksek ve en düşük seviyesini oluşturmakla görevlidir.
>Sipariş Bloğu oluşturulduktan sonra Gösterge, olası bir sinyal olduğunu belirten bir uyarı

Choppines robotu, MT4 göstergeler klasörüne bir gösterge olarak yüklenir
Mum zamanlamasının 5 dakika kullanılması tavsiye edilir, tavsiye edilen robotun son kullanma süresi 5 dakikadır.
Robot, MT2, MX2, PRICEPRO platformlarına sinyal gönderecek şekilde yapılandırılabilir. Sinyal göndermek için çalışmak istediğimiz platformun konnektör programını kullanmalısınız.
Konektörü takmak için aşağıdaki prosedürü gerçekleştirin (MT2 platform konektörüyle yapılandırmayı açıklayan bir resim ektedir):

Girişlere yardımcı olmak için yeniden boyanmayan bir ok göstergesi Trend olan piyasalarda daha iyi sinyaller veriliyor Oku yerine kilitlemek için mevcut çubuğun kapanmasını bekleyin Kafanızı karıştıracak hiçbir ayar olmadan sadece grafiği yükleyin Okun rengi ve boyutu ayarlanabilir Gösterge herhangi bir çift veya herhangi bir zaman diliminde kullanılabilir - Forex, kripto ..... Daha büyük zaman dilimi trendiyle ticaret yapmak daha iyi -------------------------------------------------- ---------
Fibonacci Breakout, Fibonacci düzeltmesini kullanan bir ticaret stratejisidir. Bu teknik aslında trendin başlangıcına girmemizi sağlayan bir tekniktir. Yeni başlayanlar için bile anlaşılması çok kolay. Strateji, otomatik özel fibonacci'nin görünmesini beklemeniz ve ardından bekleyen siparişinizi manuel olarak vermeniz, zararı durdurmanız ve Fibonacci seviyesinde kar elde etmenizdir. Fiyat başarılı bir yeniden test yaptığında pozisyon açılacaktır. Fibonacci Breakout Forex, Crypto ve hisse senetl
Magic Channel is a channel indicator for the MetaTrader 4 terminal. This indicator allows finding the most probable trend reversal points. Unlike most channel indicators, Magic Channel does not redraw. The alert system (alerts, email and push notifications) will help you to simultaneously monitor multiple trading instruments. Attach the indicator to a chart, and the alert will trigger once a signal emerges. With our alerting system, you will never miss a single position opening signal! You can t
Bu gösterge, göstergenin bağlı olduğu grafiği kaydırdığınızda birden çok grafiği aynı anda kaydırır. Çoklu zaman dilimi stratejilerini, çoklu çift stratejilerini geriye dönük test etmek, aynı anda birden fazla grafiği izlemek ve birkaç piyasanın aynı anda tarihsel olarak nasıl performans gösterdiğini görmek için geriye bakmak için kullanışlıdır. Gösterge hafiftir ve aynı anda 99 grafiğe kadar hareket etmek için kullanılabilir.
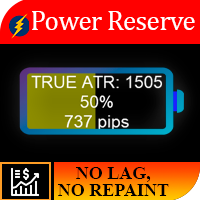
çalışma mantığı
Bu göstergenin önemi, “cihazda ne kadar yakıt kaldığını” anlamanıza izin vermesi gerçeğinde yatmaktadır. Aküsü yarı boş bir arabada bıraktığınız durumu bir düşünün, ortalama olarak bu miktar bir araba için 250 km'lik bir enerji yeterlidir, yani isterseniz 700 km'lik bir mesafeyi aşamazsınız. Yani her enstrüman için belirli bir günlük fiyat hareketi var ve istatistiksel gözlemler sonucunda varlığın günde 1 ATR'yi geçtiği zamanın %95'inde ve zamanın sadece %5'inde 2 veya daha fa

M1 Scalper System is a unique scalping manual trading system. This trading system automatically analyzes the market, determines price reversal points, shows the trader when to open and close orders. This system shows all the information a trader needs visually on the chart.
M1 Scalper System - sends a trader to the phone and email signals! Therefore, you do not need to sit at the PC all the time, waiting for a signal. When a good signal appears on the market to open a trade, the indicator will
Day Trader Edge is a Range Breakout Correlation With Multi Symbol Lookup (NON-REPAINT Enhance your trading strategy with our cutting-edge Indicator! This versatile tool is designed to provide precise breakout signals and comprehensive analysis to help you make informed trading decisions. Discover the features that make our indicator a must-have for any forex trader: -INDEPENDENT COMPLETE DAY TRADING SYSTEM- Key Features: Range Breakout Time-Based Analysis: Accurately identifies breakout level

Bu ürün, broker sunucunuzun saat dilimine göre 15 ülkenin işlem seanslarını ve grafik sıkışıklığını önlemek için istediğiniz ayarlara göre çeşitli görüntüleme modlarını görüntülemek ve kullanıcının istediği zamana göre seans ayarlama imkanı sunmak üzere tasarlanmıştır.
Forex piyasasında güneş asla batmaz, ancak ritmi farklı işlem seanslarının ritmine göre dans eder. Bu oturumları, örtüşmelerini ve benzersiz atmosferlerini anlamak, piyasaya karşı değil, piyasaya karşı hareket etmek isteyen her

All patterns from Encyclopedia of Chart Patterns by Thomas N. Bulkowski in one indicator. It draws an up or down arrow whenever a pattern is identified. Patterns are selected in the drop-down list of the Pattern variable (located at the beginning of the properties window). The indicator has numerous external parameters, some of them apply to all patterns, while others are selective. To see more information on the parameters used for the selected pattern, enable the ShowHelp variable (located at
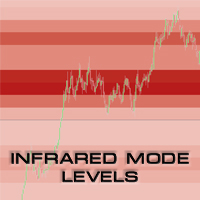
UPDATE 3 - Scan what you see - the indicator will scan and draw levels for all VISIBLE bars on the chart, rather than Current Bar - till first visible bar on the chart (historical bar on the left side). Assumption is, if you are going back in history and you want to check levels, you care about that specific moment in time and what the levels were during that moment (excluding data of the future which is not visible). UPDATE 2 - version 2.1 introduces the "Always ON" feature. If enabled, you ca

Non-repaint indicator to identify trade opportunities in swing action as prices move within an upper and lower band. Inspired by the Keltner Channel, the most popular channel Indicator introduced by Chester Keltner. It is different with a Bollinger Bands. It represents volatility using the high and low prices, while Bollinger's studies rely on the standard deviation. Customized by adding the trends exactly in the middle line, arrows when price cross over the outer lines and Fibonacci Levels L
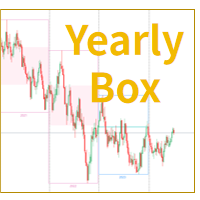
MT4 Yıllık Mum Kutusu Göstergesi
MetaTrader 4 platformundaki "Yıllık Mum Kutusu" göstergesi, bir yıl içindeki fiyat hareketlerini dikdörtgen bir kutu içinde görsel olarak gösteren bir grafik analiz aracıdır. Bu gösterge, fiyat aralığını çerçeveleyerek ve arka planı renklendirerek yıllık açılış ve kapanış fiyatlarını vurgular. Yatırımcılar, piyasada yıllık eğilimleri ve desenleri net bir şekilde anlamak için Yıllık Mum Kutusu göstergesini kullanarak yıllık fiyat dalgalanmalarını kolayca tanıml

5/10 kopya 30$ ---> sonraki 50$ // MT5 versiyonu
Forex Vigor , 8 ana para biriminin (EUR, GBP, AUD, NZD, USD, CAD, CHF, JPY) momentum gücünü değerlendiren teknik bir göstergedir. Gösterge, 28 döviz çifti arasındaki korelasyon eksikliğini ölçen matematiksel hesaplamalara dayanır. Değerlerini hesaplamak için, Doğrusal ağırlıklı ortalama yöntemi (LWMA) artı modelde önemi temsil etmeyen değerleri ortadan kaldıran istatistiksel bir sistem kullanarak kapanış fiyatları arasındaki yüzde farkını anali
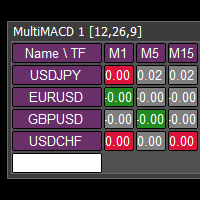
This tool monitors MACD indicators on all time frames in the selected markets. Displays a table with signals to open a BUY trade (green) or SELL trade (red). You can set the conditions for the signal. You can easily add or delete market names / symbols. If the conditions for opening a trade on multiple time frames are met, you can be notified by e-mail or phone message (according to the settings in MT4 menu Tools - Options…) You can also set the conditions for sending notifications. The list of

WolfeWaveBuilder göstergesi ile ticarete katılın! Bu, en başarılı ve karlı yatırım kararlarını almak için özel olarak oluşturulmuş benzersiz bir araçtır. Canlı hesaplar için idealdir ve tamamen test edilmiş ve neredeyse garantili bir ticaret stratejisinden yararlanır. fırsatı kaçırmayın! WolfeWaveBuilder göstergesi ile ticaret yaparak para kazanmaya başlayın!
MT5 sürümü https://www.mql5.com/ru/market/product/82360
Gösterge Özellikleri
Wolfe Waves stratejisi için sinyaller verir.

Waddah Explosion Scanner Features : - Waddah Trend, Explosion Increase/Decrease
- Trend Percentage with Threshold
- DeadZone
- Trend Direction Aligned Checks
- Highlight and Alerts
- Multi-Timeframe & Multi-Currency
Check out the blog post for more info: https://www.mql5.com/en/blogs/post/758020
Customizable Threshold: With customizable threshold, you can identify best trading opportunities in volume-based trading. Use Trend Height (x times Explosion) : Trend height in relat
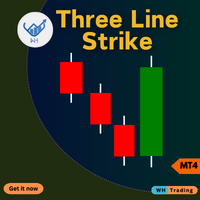
Üç Hatlı Saldırı Göstergesi MetaTrader 4 (MT4) için. Bu gelişmiş araç, piyasadaki potansiyel dönüşleri hassas ve kolay bir şekilde belirlemenize yardımcı olmak için tasarlanmıştır.
İster yeni başlayan ister deneyimli bir yatırımcı olun, bu gösterge alım satım kararlarınızı geliştirebilir ve karınızı en üst düzeye çıkarabilir. Contact me after purchase for guidance Ana Özellikler: Doğru Ters Dönüş Sinyalleri : Teknik analizde kanıtlanmış bir mum çubuğu oluşumu olan üç çizgili vuruş mode

Gerçek Arz ve Talep göstergesi - tüm zaman dilimlerinde direnç ve destek seviyelerinin yerini hızlı bir şekilde belirlemenizi sağlar. Gösterge, işlemlerinde teknik analiz kullananlar için faydalı olacaktır. Göstergenin kullanımı kolaydır, sadece grafik üzerinde sürükleyip bırakın ve gösterge size en olası destek ve direnç seviyelerini gösterecektir. Zaman dilimlerini değiştirirken, yeni seçilen zaman dilimi için seviyeleri göreceksiniz.
Önerilen Robot Scalper - sınamak .

The technical indicator "Reversal patterns" is a mathematical interpretation of the classic reversal patterns: Pin Bar, Harami and Engulfing. That is, the "reversal bar", "Harami" and "Absorption". This indicator allows you to determine the moment of reversal of quotes based on market dynamics and the winner between the "bulls" and "bears".
The indicator displays the moment of reversal at the local highs and lows of the chart of any timeframe, which allows you to increase the accuracy of the

MA Trend Following Indicator for MT4 is a simple technical analysis tool designed to follow the trend in any currency pair chosen by the trader by combining 3 moving averages on two different time frames, one long term and one short term.
It basically provides a bullish or bearish signal when the moving averages on one time frame align with the moving averages on a different time frame to have a confluence signal.
The indicator is presented as a screener with multiple currency pairs (that

VR Pivot is an indicator of key pivot points. Pivot points are a special type of support and resistance levels that are used to determine the strongest price zones. Professional traders use pivot levels to determine prices at which there is a high probability of a price reversal. The levels are calculated using special mathematical formulas, which include the closing, opening, high, and low prices of the previous time period. The most effective is the daily period. It is important to note that a

Reversal Alert Pro göstergesi, piyasadaki geri dönüş alanlarını otomatik olarak tespit etmek için tasarlanmış güçlü bir araçtır. Doğrudan mobil cihazınıza gönderilen uygun bildirimler sunar ve sesli açılır uyarıları görüntüler. Bu göstergeyi ticaret stratejinize dahil ederek, ticaret pozisyonlarını etkili bir şekilde filtreleyebilirsiniz. Ayrıca gösterge, üretilen sinyalleri daha da hassaslaştırmak için CCI, RSI ve Stokastik göstergelerini kullanma seçeneği sunarak çok yönlülüğünü ve uygulanab
Moving Average Scanner, grafiği değiştirmeden, birkaç zaman dilimindeki trendi bir bakışta görmek için mükemmel, çok zaman dilimli bir tarayıcıdır.
9 zaman birimi üzerinden seçtiğiniz 4'e kadar hareketli ortalamayı kullanabilir. Tamamen yapılandırılabilir ve basitçe "sürükle ve bırak" yöntemiyle grafik üzerinde herhangi bir yere taşınabilir.
Hareketli ortalamalar 4 farklı hesaplama yöntemiyle yapılandırılabilir. Ayrıca hareketli ortalamaların sayısına ve dönem sayısına göre uyarılar da aya

Ultimate Trend Finder (Multi Pair And Multi Time Frame) : ---LIMITED TIME OFFER: NEXT 25 CLIENTS ONLY ---46% OFF REGULAR PRICE AND 2 FREE BONUSES ---SEE BELOW FOR FULL DETAILS Institutional traders use moving averages more than any other indicator. As moving averages offer a quick
and clear indication of the institutional order flow. And serve as a critical component in the decision making
within numerous institutional trading rooms.
Viewing the market through the same lens as the i

Ultimate Pinbar Scanner (Multi Pair And Multi Time Frame) : ---LIMITED TIME OFFER: NEXT 25 CLIENTS ONLY ---46% OFF REGULAR PRICE AND 2 FREE BONUSES ---SEE BELOW FOR FULL DETAILS A strong pinbar is clear evidence that the institutions are rejecting a particular price level.
And the more well defined the pinbar, the higher the probability that the institutions will
soon be taking prices in the opposite direction.
Pinbar patterns are widely used by institutional traders around the world.

The indicator (Current Strength) is represented in a separate window by Blue and Pink histogram . The parameter NPeriod represents the number of bars on which we calculate the variation of forces, the recommended value is 5. The Blue histogram measures the buyers force , while the Pink histogram measures the sellers force . The change in color signifies the change in strength which leads t he price . Each drop (especially below 52.8) after touching levels 96.3 or 1.236 must be condidered

I recommend you to read the product's blog (manual) from start to end so that it is clear from the beginning what the indicator offers. This multi oscillator, multi time frame and multi symbol indicator identifies when a divergence occurs between price and an oscillator/indicator. It identifies both regular/classical (trend reversal) and hidden (trend continuation) divergences. It has moving average, RSI/Bollinger, ADX, pin bar and engulfing filter options which makes it possible to filter

Suggested timeframes to trading :M1-M5 - M15-M30 -H1 wait london and newyork markert open after wait best then select the best strong index and weakest index by sniper. histogram is indicated by one arrow at a time. The signal in the end direction of weak and strong all red and green mean trending index,natural market is displayed only in white SL Sniper Indicator can be used for short term long and scalping. It is better to confirm entry signals with high low price action. currency is gaining

First and foremost, the Insight Flow Indicator stands out as a Non-Repainting, Non-Redrawing, and Non-Lagging tool. This makes it a prime choice for both manual and algorithmic trading, ensuring reliable and consistent signals. User Manual: Settings, Inputs, and Strategy The Insight Flow Indicator leverages price action, strength, and momentum to provide a clear edge in the market. Equipped with advanced filters, it eliminates noise and false signals, enhancing trading potential. By using multip

Sonar Mekanik göstergesi. SonarHistogram güç dengesi göstergesini ücretsiz almak için satın aldıktan sonra benimle iletişime geçin! Sonar Mechanic göstergesi gerçekten çalışan bir göstergedir, çünkü piyasaya giriş için trend ve karşı trend sinyallerini doğru bir şekilde tanımlayan üç yazar algoritması kullanarak çalışır. Gösterge tüm varlıklar ve zaman dilimleri üzerinde çalışır. Gösterge Kılavuzu: https://www.mql5.com/en/blogs/post/750128 Altın ve döviz çiftlerinde, M1, M5 ve M15 zam

Currently Price 20% OFF ( for unlimited use ) BONUS AUX VIP Club 2024 : Include EA Airbag and Load Data History to enhance the performance of this tool to its maximum potential Click Here to Download Files ( for users only ) Hello World! Introducing..
SMCpro VIP tool and Indicator for MetaTrader 4, designed to revolutionize your trading experience with the ICT Smart Money Concept. This system is meticulously crafted to empower traders with advanced insights and precision in

TrendSwift Herkes tarafından kullanılmak üzere tasarlanmıştır; ticarete yeni başlayan biri bile onu kullanabilir. ASLA yeniden boyamaz. Göstergeler yakından yakına verilmektedir. Tek başına kullanılmak üzere tasarlanmıştır, başka hiçbir göstergeye gerek yoktur.
O nasıl çalışır TrensSwift, fiyat hareketi ve Fibonacci sistemi ile birleştirilmiş dahili bir trend göstergesi kullanıyor. Strateji, herhangi bir yeniden hesaplama, yumuşatma veya enterpolasyon olmaksızın kesinlikle uygulanır. Yorum
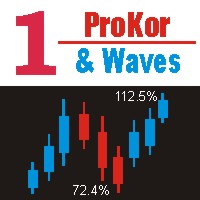
MT4. Показывает процент коррекции цены к предыдущей волне, процент превышения цены над предыдущим пиком или впадиной волны. Помечает волны. Диапазон волн регулируется параметром на графике, путём ввода в поле цифры от 5 до 300. Рисует уровни Фибоначчи от вершин или впадин предыдущей волны, а так же в противоположную сторону от текущей вершины или впадины волны.
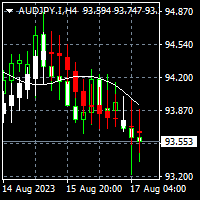
To download MT5 version please click here . - This is the exact conversion from TradingView: "Linear Regression Candles" By "ugurvu". - This is a non-repaint and light processing load indicator - You can message in private chat for further changes you need. This is a sample EA code that operates based on bullish and bearish linear regression candles . #property strict input string EA_Setting= "" ; input int magic_number= 1234 ; input string Risk_Management= "" ; input double fixed_lot_size=
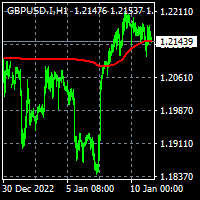
To get access to MT5 version please click here . - This is the exact conversion from TradingView: "Trend Regularity Adaptive Moving Average","TRAMA" By " LuxAlgo ". - This is a light-load processing and non-repaint indicator. - Buffer is available for the main line on chart. - You can message in private chat for further changes you need. Thanks for downloading

To get access to MT5 version please click here . - This is the exact conversion from TradingView: "Stochastic Momentum Index" By "UCSgears". - This is a popular version of stochastic oscillator on tradingview. - This is a light-load processing and non-repaint indicator. - Buffers are available for the lines on chart. - You can message in private chat for further changes you need. Thanks for downloading

The QQE indicator is a momentum-based indicator used to identify trends and sideways. The Qualitative Quantitative Estimate (QQE) indicator works like a smoothed version of the popular Relative Strength Index (RSI) indicator. QQE extends the RSI by adding two volatility-based trailing stops. This indicator is converted from Trading View QQE MOD by Mihkel00 to be used in MT4 Version.
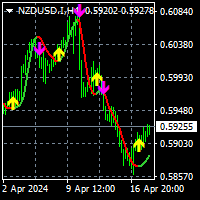
To download MT5 version please click here .
- This is the exact conversion from TradingView: " PA-Adaptive Hull Parabolic " By "Loxx".
- This is a non-repaint and light processing load indicator
- You can message in private chat for further changes you need.
- All input options are available except candle coloring.
- Buffers are available for processing within EAs.
Pinbar Pattern Scanner: Your Ultimate Forex Trading Tool The Pinbar Pattern Scanner is a cutting-edge, non-repainting, non-lagging price action tool designed for both novice and expert traders. With its unique ability to scan across 9 timeframes, this tool alerts you of potential price rejections in any forex symbol, all from a single chart.
Key Features:
Versatility: Originally developed for forex, it's also suitable for binary options for those well-versed in price action.
Customizable:

This Real Magic Trend indicator is designed for signal trading. This indicator generates trend signals.
It uses many algorithms and indicators to generate this signal. It tries to generate signals from the points with the highest trend potential.
This indicator is a complete trading product. This indicator does not need any additional indicators.
The indicator is never repainted. The point at which the signal is given does not change.
Features and Recommendations Time Fram
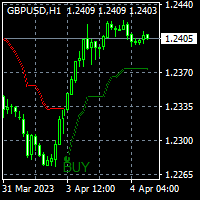
To get access to MT5 version please click here . This is the exact conversion from TradingView: "Supertrend" by " KivancOzbilgic ". This is a light-load processing and non-repaint indicator. Highlighter option isn't available in MT4 version. You can message in private chat for further changes you need. Here is the source code of a simple Expert Advisor operating based on signals from Supertrend . #property strict input string EA_Setting= "" ; input int magic_number= 1234 ; input double fixed_lo

To get access to MT5 version please click here . This is the exact conversion from TradingView: "[SHK] Schaff Trend Cycle (STC)" by "shayankm". This is a light-load processing indicator. This is a non-repaint indicator. Buffers are available for processing in EAs. All input fields are available. You can message in private chat for further changes you need. Thanks for downloading
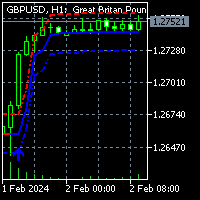
To get access to MT5 version please click here . This is the exact conversion from TradingView: "HalfTrend" by "Everget". This is a light-load processing indicator. This is a non-repaint indicator. Buffers are available for processing in EAs. All input fields are available. You can message in private chat for further changes you need. Thanks for downloading
Symbol Changer This indicator makes it easier to change chart symbol, useful if a trader deals with many pairs.
User Inputs:
Indicator Custom Unique ID : Can make a custom ID for each Indicator when attach more 1 indicator. Show Profit Loss : Optional show Profit and Loss for each pair. Option Horizontal / Vertical button : Button to choose Horizontal or Vertical display. Optional display positions : Show in main Chart area and/or bottom chart. Main Pairs Preset / Own Pair : group pairs for

The True Magic Oscillator indicator is designed for signal trading. This indicator generates trend signals.
It uses many algorithms and indicators to generate this signal. It tries to generate signals from the points with the highest trend potential.
This indicator is a complete trading product. This indicator does not need any additional indicators.
The indicator is never repainted. The point at which the signal is given does not change.
Features and Recommendations Wor
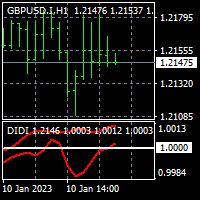
To get access to MT5 version please click here . - This is the exact conversion from TradingView: "Didi Index" by " everget ". - This is a popular version of DIDI index on tradingview. - This is a light-load processing and non-repaint indicator. - Buffer is available for the lines on chart and arrows on chart. - You can message in private chat for further changes you need. Thanks for downloading
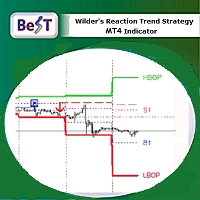
Best _Wilder’s Trend Reaction Strateg y is a Metatrader indicator that is based on the J.W.Wilder’s corresponding work as we can find it at his own legendary book:
“ NEW CONCEPTS IN TECHNICAL TRADING SYSTEMS ”(1978) and on pages 71-86/SECTION VII.
This strategy is both an anti-trend system (named as REACTION_MODE ) and a trend system (named as TREND_MODE ). The REACTION_MODE reverses at each Buy point and most Sell points while the TREND_MODE usually exits the market at a Trailing Stop.
T

Graphing calculator for quick calculation of order grids or averaging strategies. This is an improved English version of the "Grid calculator" program, which shows order volumes by level (lot), martingale ratio (MG), grid step (step), drawdown of each order and the entire grid, breakeven level (Line Breakeven). For the program to perform calculations, it is enough to pull the grid onto the chart by dragging the initial (Level 1) or control (Control line) levels with the mouse. The default param

SF TREND SIGNAL - уникальный индикатор использующий несколько входных данных для определения тенденции, и сигнала для входа в сделку, в ее направлении. Подходит для любой валютной пары, любого таймфрейма, и не меняет свои показания. Индикатор очень прост в настройке, что является хорошим преимуществом для исследований.
Параметры индикатора Основные настройки ( Main Settings ): SlowPeriod - период для расчета тенденции. FastPeriod - период для расчета сигнала. SlowSmooth - сглаживание значен
NO REPAINT ADVANCED CHART PATTERN INDICATOR
By definition, a price ( chart) pattern is a recognizable configuration of price movement that is identified using a series of trendlines and/or curves. When a price pattern signals a change in trend direction, it is known as a reversal pattern; a continuation pattern occurs when the trend continues in its existing direction following a brief pause. Advanced Chart Pattern Tracker is designed to find the MOST ACCURATE patterns. A special script is
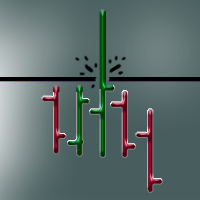
Панель предназначена для быстрого визуального нахождения и отображения ложных пробоев по всем периодам и на любых выбранных валютных парах одновременно . Цвет сигнальных кнопок , указывает на направление возможного движения . По клику на сигнальную кнопку , осуществляется открытие графика с данным паттерном . Отключить не используемые периоды , можно кликом по его заголовку . Кнопка "All" открывает графики всех сигналов по данному периоду . Имеется поиск в истории ( по предыдущим барам ). Прокру

This script automatically calculates and updates ICT's daily IPDA look back time intervals and their respective discount / equilibrium / premium, so you don't have to :) IPDA stands for Interbank Price Delivery Algorithm. Said algorithm appears to be referencing the past 20, 40, and 60 days intervals as points of reference to define ranges and related PD arrays. Intraday traders can find most value in the 20 Day Look Back box, by observing imbalances and points of interest. Longer term traders c
MetaTrader Mağazanın neden ticaret stratejileri ve teknik göstergeler satmak için en iyi platform olduğunu biliyor musunuz? Reklam veya yazılım korumasına gerek yok, ödeme sorunları yok. Her şey MetaTrader Mağazada sağlanmaktadır.
Ticaret fırsatlarını kaçırıyorsunuz:
- Ücretsiz ticaret uygulamaları
- İşlem kopyalama için 8.000'den fazla sinyal
- Finansal piyasaları keşfetmek için ekonomik haberler
Kayıt
Giriş yap
Gizlilik ve Veri Koruma Politikasını ve MQL5.com Kullanım Şartlarını kabul edersiniz
Hesabınız yoksa, lütfen kaydolun
MQL5.com web sitesine giriş yapmak için çerezlerin kullanımına izin vermelisiniz.
Lütfen tarayıcınızda gerekli ayarı etkinleştirin, aksi takdirde giriş yapamazsınız.