Guarda i video tutorial del Market su YouTube
Come acquistare un Robot di Trading o un indicatore
Esegui il tuo EA
hosting virtuale
hosting virtuale
Prova un indicatore/robot di trading prima di acquistarlo
Vuoi guadagnare nel Market?
Come presentare un prodotto per venderlo con successo
Indicatori tecnici a pagamento per MetaTrader 4 - 13

CME Daily Bullettin Open Interest provides the data on the open interest of futures contracts on the CME for your charts. Open interest is a special type of volume, that shows how many contracts are being held by the market participants at each moment of time. This type of information is available only in futures markets. But now, with this indicator, you can also analyze these data when trading the spot markets, such as FOREX. In addition, the indicator provides data on the open interest for th
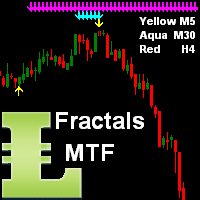
This indicator shows arrows as Support and Resistance from current time frame (Yellow arrows) and 2 higher TF by your choice (TF2 = Aqua arrows, TF3 = Magenta arrows and TF4 = Blue arrows). When all 3 color arrows are appearing in the same place then this is a good time to enter a new position.
Inputs NumOfBars - number of Bars where the indicator will show all arrows; DistanceArrow - you can increase the distance (vertically) between arrows especially on higher TF.

Title : Market Bias Indicator - Oscillator-Based Trading Tool Introduction : Discover the potential of the "Market Bias Indicator," a revolutionary oscillator-based trading tool designed for precise market analysis. If you're in search of a robust alternative to traditional bias indicators, your quest ends here. Market Bias Indicator offers unparalleled accuracy in identifying market sentiment and is your gateway to confident trading decisions. Recommended Trading Pairs : Market Bias Indicator i

The indicator returning pivot point based trendlines with highlighted breakouts . Trendline caculated by pivot point and other clue are ATR, Stdev. The indicator also includes integrated alerts for trendlines breakouts and foward message to Telegram channel or group if you want. Settings · Lookback bar: Default 200 is number of bar caculate when init indicator. · Length: Pivot points period · Slope Calculation Method: Determines how this lope is calcula

"TPA Sessions" indicator is a very important tool to complement "TPA True Price Action" indicator . Did you ever wonder, why many times the price on your chart suddently turns on a position you can`t explain? A position, where apparently no support or resistance level, or a pivot point, or a fibonacci level is to identify? Attention!!! The first run of the TPA Session indicator must be in the open market for the lines to be drawn correctly.
Please visit our blog to study actual trades with

This Indicator uses Center of Gravity (COG) Indicator to find you the best trades.
It is a reversal based Swing Indicator which contains an Arrows Indicator. That you can buy here from Metatrader Market.
Check out this blog post for detailed How to Use Guide and links to free scanner: https://www.mql5.com/en/blogs/post/758262
Scanner needs this arrows indicator in same directory to run
Copy scanner ex4 in same folder as your Arrows Indicator: MQL4/Indicators/Market/ All extra indicators

This strategy is best used for Trend based trading. While market is trending, price still makes smaller ranges. Darvas boxes show breakouts from these small ranges, while still following the original market trend. Detailed Description: https://www.mql5.com/en/blogs/post/747919
Features:
Darvas - Check Darvas Box Breakout
- Check Price Above/Below MA or Darvas Box has crossed MA
- Min, Max Box Height
- Max Distance Between Entry Price and Darvas Box
Other Indicators:
- NRTR Tren

Must be owned and used by Fibonacci traders who like to open position by pending order (limit order). The strategy is that you just have to wait for the automatic custom fibonacci appear then manual place your pending order, stop loss and take profit at the level of Fibonacci. The position will be opened when the price make a successful retest. Fibo Heart Indi come with pop-up alert, email and mobile push notification. Suitable for all instruments and all time frames. Don't miss the trading set

The purpose of the Combo OnOff indicator is combine differerent tecniques and approachs to the market in order to spot signals that occur simultaneosly. A signal is more accurate if it is validate from more indicators as the adaptive expectations can be used to predict prices.The On-Off feature and alarms help to look for the better prices to enter/exit in the markets
Moving Averages are statistics that captures the average change in a data series over time
Bollinger Bands is formed by upp

Presentazione di Market Structure Break Out per MT4 – Il tuo indicatore professionale MSB e di zone intatte Unisciti al Canale Koala Trading Solution nella comunità di mql5 per scoprire le ultime notizie su tutti i prodotti Koala. Il link di adesione è qui sotto: https://www.mql5.com/en/channels/koalatradingsolution
Market Structure Break Out: il tuo modo per avere un'analisi pura sulle onde di mercato
Questo indicatore è progettato per disegnare la struttura di mercato e le onde di movim
L'indicatore tick
è uno strumento molto potente per lo scalping. Ti mostra il movimento su e giù nel mercato.
In questo modo è possibile identificare la direzione molto più velocemente.
L'indicatore è molto facile da installare e può essere utilizzato su tutti gli intervalli di tempo e tutte le coppie forex, bitcoin .....
Basta installare il file nella cartella degli indicatori del terminale MT4, aggiornare o riavviare il terminale e trascinarlo sul grafico che si desidera negoziare.
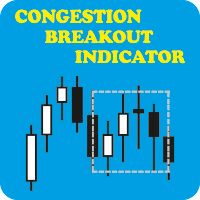
CONGESTION BREAKOUT INDICATOR: When you see a sideways price movement in a meaningless market, what goes through your mind? Is it a danger, an opportunity or completely a vacuum? Let's see if we can avoid the latter and focus on using it to our advantage. The ability to read price action through the display of rectangles on the chart could be the boost you need to achieve your trading goals. What is congestion? Congestion is a market situation where the price is trading around a particular leve

The Elder Impulse System was designed by Alexander Elder and featured in his book. According to Elder, “the system identifies inflection points where a trend speeds up or slows down”. The Impulse System is based on two indicators, a exponential moving average and the MACD-Histogram. The moving average identifies the trend, while the MACD-Histogram measures momentum. As a result, the Impulse System combines trend following and momentum to identify tradable impulses. This unique indicator combina
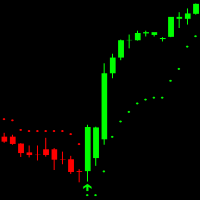
Easy Trend Indicator can be used for all forex pairs, indices and cryptocurrencies. It´s a non rapainting Trend trading indicator and works on all timeframes. GREEN candles show an uptrend and RED candles show a Downtrend. Arrows show when to enter the Market. Indicator has 7 Inputs: Max History Bars = On how many Bars in the Chart the indicator is drawn ATR Period = How many Bars are used for Average True Range calculation ATR Multiplier = Is used for Indicator sensitivity (Higher multiplier =

This indicator draws regular bullish and bearish divergences in real-time onto the charts. The algorithm to detect those divergences is based on my 10+ years experience of detecting divergences visually. The divergences are drawn as green and red rectangles on the charts. You can even do forward testing in the visual mode of the strategy tester.
Parameters Fast EMA Period: The period of the fast EMA of the MACD. Default value is 12.
Slow EMA Period: The period of the slow EMA of the MACD. Def

This indicator is designed to detect the best of all candlestick reversal patterns: Three Line Strike . According to the bestselling author and candlestick guru Thomas Bullkowski, this pattern has a winning percentage between 65% and 84% . This indicator scans for you up to 30 instruments (forex, indices or commodities) on up to 8 timeframes. You can get alerts via MetaTrader 4 and email if a Three Line Strike pattern occurs. Please note: Higher timeframes bring the most reliable signals. This i

Forex Gump is a fully finished semi-automatic trading system. In the form of arrows, signals are displayed on the screen for opening and closing deals. All you need is to follow the instructions of the indicator. When the indicator shows a blue arrow, you need to open a buy order. When the indicator shows a red arrow, you need to open a sell order. Close orders when the indicator draws a yellow cross. In order to get the most effective result, we recommend using the timeframes H1, H4, D1. There

Signal Bands is a sensitive and convenient indicator, which performs deep statistical processing of information. It allows to see on one chart (1) the price trend, (2) the clear price channel and (3) latent signs of trend change. The indicator can be used on charts of any periods, but it is especially useful for scalping due to its high sensitivity to the current market state.
The functions of the indicator : First, the Signal Bands indicator draws channels into which all price fluctuations ex

The indicator Power Strength creates a virtual display that takes data from all Symbols. It extrapolates all the informations in order to get the strength and / or weakness to take a decision on market. This tool works only on the Forex Market and not processing data on indices, metals ... It is graphically very attractive and its simplified information could give excellent input signals. You can use this indicator to find inputs on daily or short-term operations or scalping.
Input Values PANE

WaveTrend Momentum Oscillator is an upgrade to the popular and easy-to-use WaveTrend Oscillator. The WaveTrend Momentum Oscillator adds a momentum component to the original WaveTrend calculation, in order to provide faster and more accurate entry points during trendy market conditions. Do you prefer the original WaveTrend Oscillator? The WaveTrend Momentum Oscillator allows you to switch between momentum and original WT versions. Both provide valuable information depending on the market conditio
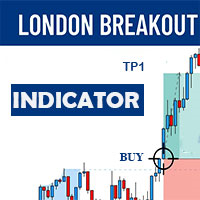
The London Breakout indicator is a technical analysis tool used in the forex market to help traders identify potential breakouts during the opening of the London trading session. This indicator is designed to help traders take advantage of the volatility and momentum that occurs during this time period, which can lead to significant price movements.
The London Breakout indicator works by identifying the range of price movement during the Asian trading session that precedes the London open, an

In statistics, Regression Channel is a approach for modelling the relationship between a scalar response (or dependent variable) and one or more explanatory variables (or independent variables).We Applied relative strength index(rsi) values to develop regression models of various degrees in order to understand relationship between Rsi and price movement. Our goal is range prediction and error reduction of Price divergence , thus we use Rsi Regression

This unique multi-currency strategy simultaneously determines the end of the trend, entry points and the expected take profit levels for each trade. The indicator can determine entry points on any trading period from M1 to D1. For the convenience of users, the indicator renders the entry point (in the form of an arrow), recommended take profit levels (Fast Take Profit, Middle Take Profit, Main Take Profit, Global Take Profit) and the Stop Loss level. The detailed guide on how to use the indicato
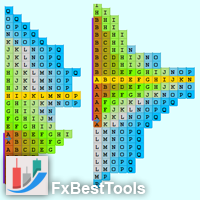
Definition : A Market Profile is an intra-day charting technique (price vertical, time/activity horizontal). Market Profile is best understood as a way to see order in the markets. Market Profile was a way for traders to get a better understanding of what was going on, without having to be on the trading floor. The current indicator is developed based on Easy-to-Use architecture including a wide range of visual settings.
Major Features of Indicator : Various Views of Market Profile The indica

A ready-made trading system based on automatic construction and maintenance of Fibonacci levels for selling and buying for use on any instrument (symbol) and on any period of the chart. Features Detection of trend direction (14 indicators) Construction of horizontal levels, support and resistance lines, channels Selection of a variant for calculating Fibonacci levels (six different methods) Alert system (on screen, E-Mail, Push notifications) Buttons Color scheme switching button. Arrow buttons.

Real Trade commercia su intervalli di tempo inferiori a 1 ora. Fai trading in direzioni rialziste e ribassiste. Scambia con le direzioni di tendenza del tempo più elevate e scambia la prima candela. Usa l'opposto per uscire o usa il rapporto per uscire 1:1 o superiore insieme ai trailing stop. Scambia tendenze reali durante le ore attive e con una direzione di tendenza più alta per i migliori risultati. Indicatore di carico nel tester per studiare i risultati e il potenziale. Usa le frecce scal

The EasyTrend is a seemingly simple but quite powerful trend indicator. Everyone has probably come across indicators or Expert Advisors that contain numerous input parameters that are difficult to understand. Here you will not see dozens of input parameters, the purpose of which is only clear to the developer. Instead, an artificial neural network handles the configuration of the parameters.
Input Parameters The indicator is as simple as possible, so there are only 2 input parameters: Alert -

"The trend is your friend" is one of the best known sayings in investing, because capturing large trendy price movements can be extremely profitable. However, trading with the trend is often easier said than done, because many indicators are based on price reversals not trends. These aren't very effective at identifying trendy periods, or predicting whether trends will continue. We developed the Trendiness Index to help address this problem by indicating the strength and direction of price trend

Advanced Currency Strength Indicator
The Advanced Divergence Currency Strength Indicator. Not only it breaks down all 28 forex currency pairs and calculates the strength of individual currencies across all timeframes , but, You'll be analyzing the WHOLE forex market in 1 window (In just 1 minute) . This indicator is very powerful because it reveals the true movements of the market. It is highly recommended to analyze charts knowing the performance of individual currencies or

L'indicatore mostra i livelli Alto/Basso/Apertura/Chiusura da altri intervalli di tempo (e non standard): Anno, 6 Mesi, 4 Mesi, 3 Mesi, 2 Mesi, Mese, Settimana, Giorno, H3-H6-H8-H12 Ore . Puoi anche impostare lo spostamento per l'apertura delle candele e costruire candele virtuali. I "separatori di periodo" per uno di questi intervalli di tempo sono disponibili sotto forma di linee verticali. Gli avvisi possono essere configurati per i breakout dei livelli attuali o precedenti (breakout della l

Multicurrency and multitimeframe modification of the Commodity Channel Index (CCI) indicator. You can specify any desired currencies and timeframes in the parameters. Also, the panel can send notifications when crossing overbought and oversold levels. By clicking on a cell with a period, this symbol and period will be opened. This is MTF Scanner. The key to hide the dashboard from the chart is "D" by default.
Parameters CCI Period — averaging period.
CCI Applied price — price type.
Clear

DAYTRADING solo per AZIONI (CFD).
Il trading richiede lavoro. Non ci sono scorciatoie o indicatori che ti diranno tutte le entrate e le uscite. Il profitto viene dallo stato d'animo. Gli indicatori sono strumenti da utilizzare insieme alla gestione del denaro e alla psicologia del successo. Trova gli squilibri nel profilo del volume. Squilibri di volume dei prezzi commerciali.
Molti squilibri si verificano in chiusura e apertura e notizie. Guarda gli acquirenti rispetto ai venditori nelle a

1. Compound Drawings (1) Line segment with arrow (2) Continuous line segment (broken line) (3) Parallelogram (4) Polygon (5) Profit and loss ratio measurement tools
2. Backtracking By the Z key in the process of drawing the line Line types that support Z-key backtracking: continuous line segments (broken line) ,channels,parallelograms,polygons, and fibo extensions.
3.Automatic Adsorption (1) Click the "Lock-Button" to switch the automatic adsorption switch before drawing the line (2)
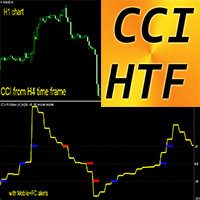
Forex Indicator CCI HTF Oscillator for MT4 Upgrade your trading methods with the professional CCI HTF Oscillator for MT4. H TF means - H igher Time Frame Commodity Channel Index (CCI) measures the difference between the current price and the historical average price Important levels: +/-200, +/-100
It is great to take Sell entries from above +200 zone and Buy entries from below -200
This indicator is excellent for Multi-Time Frame trading systems with Price Action entries

This indicator presents an alternative approach to identify Market Structure. The logic used is derived from learning material created by DaveTeaches (on X)
When quantifying Market Structure, it is common to use fractal highs and lows to identify "significant" swing pivots. When price closes through these pivots, we may identify a Market Structure Shift (MSS) for reversals or a Break of Structure (BOS) for continuations. The main difference with this "protected" logic is in how we determine

Trova lo stoploss ottimaleL'utilizzo delle tecniche di stop loss più diffuse, come gli stop loss fissi o il posizionamento sotto i massimi e i minimi precedenti, è svantaggioso per una serie di motivi:1. I broker conoscono già queste aree e quindi è facile per loro prenderle 2. Non è possibile utilizzare sempre uno stoploss fisso con un mercato, poiché questo può diventare molto ampio o molto sottile in momenti diversi, e si sta prendendo meno dal mercato o ci si espone troppo per essere fermati
L'indicatore Optimal Trailing TP può funzionare sia come strumento di entrata che come strumento di monitoraggio dei profitti. Il suo design unico gli consente di fornire segnali di acquisto e di vendita. Se siete già in posizione, potete ignorare le frecce del segnale. Se non siete in posizione, le frecce possono avvisarvi di un movimento in quella direzione sul timeframe o sulla coppia di valute su cui è impostato l'indicatore. Pertanto, è possibile utilizzare le frecce di segnale per entrare
L'indicatore MTF Optimal Trailing TP funziona esattamente come l'optimal trailing take profit, ma stampa i segnali sotto forma di barre anziché di frecce e stampa contemporaneamente per due diversi timeframe.
Può servire sia come strumento di entrata che come take profit. Noi lo utilizziamo sia come strumento di entrata che di presa di profitto.
Il modo migliore per utilizzarlo è il seguente:
Trovare un movimento su un timeframe più alto utilizzando l'Ultimate Sniper Dashboard.
Andare su
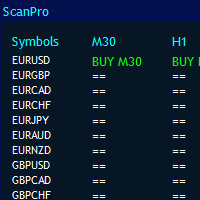
MT4 Universal Panel pro è progettato per tutti gli indicatori e i tempi, inclusi i file ex4.
Può scansionare coppie illimitate in base alla potenza del tuo computer e fino a 10 intervalli di tempo. Le dimensioni del pannello verranno organizzate automaticamente.
puoi chiamare qualsiasi indicatore tramite buffer.
Funziona per tutti gli indicatori predefiniti e personalizzati. Puoi semplicemente usarlo per heikan ashi, rsi, parabolico, renko, frattali, resistenza di supporto, domanda di

Indicatore BRICS
Bentornati sulla nostra pagina!
Acquista presso la freccia bianca. Vendi alla freccia gialla.
È molto semplice.
Non entrerò nei dettagli.
Sono sicuro che hai abbastanza esperienza e conoscenza.
Penso che le immagini allegate mostrino molto chiaramente la potenza di questo indicatore.
Su AUDCHF, GBPUSD, AUDJPY, NZDUSD funziona molto bene.
Può darsi che su altre coppie dia segnali più rari oppure ci sia qualche perdita.
Provalo e basta!
Lo metterò anch'io all'

Bar Strength Divergence Indicator for MT4 BarStrength Indicator is an exclusive indicator to trade Forex, Stocks, Indices, Futures, Commodities and Cryptos.
BarStrength Indicator shows the strength of each candle.
The indicator shows in a separate windows candles relatively to 2 price levels representing resistance and support in the market.
Once candle is near resistance it is highly probable that price movement will change direction and will go down in the next candles.
Once candle is

M1 Scalper System è un sistema di trading manuale di scalping unico. Questo sistema di trading analizza automaticamente il mercato, determina i punti di inversione del prezzo, mostra al trader quando aprire e chiudere gli ordini. Questo sistema mostra tutte le informazioni di cui un trader ha bisogno visivamente sul grafico.
M1 Scalper System - invia un trader al telefono e segnali e-mail! Pertanto, non è necessario sedersi tutto il tempo davanti al PC, in attesa di un segnale. Quando appare u

Questo indicatore si basa sull'esperienza pratica.
Inserite la data/ora del vostro top/bottom.
Calcola il livello più visitato dal top/bottom fino al momento attuale.
Si aggiorna automaticamente a ogni nuova candela. È possibile utilizzare contemporaneamente più indicatori per diversi trend e timeframe.
La lunghezza è sempre tracciata dall'inizio del periodo fino al presente.
Utile strumento PRO.

Unisciti al trading con l'indicatore WolfeWaveBuilder! Questo è uno strumento unico creato appositamente per ottenere le decisioni di investimento più riuscite e redditizie. È ideale per i conti live e beneficia di una strategia di trading accuratamente testata e virtualmente garantita. Non perdere la tua occasione! Inizia a guadagnare facendo trading con l'indicatore WolfeWaveBuilder!
Versione MT5 https://www.mql5.com/ru/market/product/82360
Caratteristiche dell'indicatore
Fornisce

Waddah Explosion Scanner Features : - Waddah Trend, Explosion Increase/Decrease
- Trend Percentage with Threshold
- DeadZone
- Trend Direction Aligned Checks
- Highlight and Alerts
- Multi-Timeframe & Multi-Currency
Check out the blog post for more info: https://www.mql5.com/en/blogs/post/758020
Customizable Threshold: With customizable threshold, you can identify best trading opportunities in volume-based trading. Use Trend Height (x times Explosion) : Trend height in relat

L'indicatore di pattern di candele giapponesi Hikkake è uno strumento specializzato progettato per identificare e rilevare i Pattern di Azione dei Prezzi Hikkake che si stanno formando su un grafico. Questi pattern si basano sul concetto di una falsa rottura da una barra interna, che spesso porta a potenziali opportunità di trading. La principale funzione dell'indicatore è analizzare le ultime cinque candele sul grafico e determinare se esse presentano le caratteristiche del pattern Hikkake. Qua
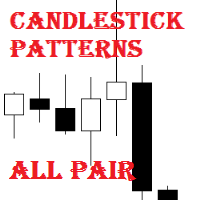
Candlestick Patterns All Pair is a simple and convenient indicator of candlestick pattens. It is able to identify 29 candlestick patterns. It displays the latest patterns for all pairs and timeframes.
The considerable advantages of the indicator It finds and marks 29 candlestick patterns; Displays a table of the last patterns for the 28 major pairs and each timeframe; It has settings for 5 extra pairs; Indicates the classic trade direction; Each candlestick patterns can be disabled in the sett
Military dog s-army will help you identify entry points for the Indian processing. He works for all the peridos. You can open the ADR levels from the settings by double-clicking on the strategy. If you turn off the ADR feature, it will find more transactions.
In particular, in addition to your own strategy, it allows you to pass your processing inputs through a better quality filter.
Do you want the ADR level to average a certain daily volume and signal the trading when the number of points

Extract Candle Power è un indicatore di estrazione del volume in tempo reale che fornisce preziose informazioni sul comportamento di venditori e acquirenti durante ogni candela. Analizzando i dati sul volume, i trader possono prendere decisioni più informate sulle tendenze del mercato e sulle potenziali inversioni, superando le capacità dei tradizionali indicatori della media mobile. Questo potente strumento ti consente di estrarre e analizzare il volume di venditori e acquirenti della candela

"Scalping Signal No Repaint No Lag" è l'unico indicatore sul mercato che, quando trascinato su qualsiasi grafico, carica automaticamente tutti gli indicatori necessari senza la necessità di caricare alcun template o altri indicatori. Configura automaticamente il grafico in modo che appaia esattamente come nell'immagine fornita. Questo indicatore garantisce segnali senza ridisegno né ritardo, rendendolo ideale per strategie di scalping su tutte le coppie di valute e su tutti i timeframe (TF). Fun

Ultimate Consecutive Bar Scanner (Multi Pair And Multi Time Frame) : ---LIMITED TIME OFFER: NEXT 25 CLIENTS ONLY ---46% OFF REGULAR PRICE AND 2 FREE BONUSES ---SEE BELOW FOR FULL DETAILS Unlike the equity markets which tend to trend for years at a time, the forex market is a stationary time series.
Therefore, when prices become severely over extended, it is only a matter of time before they make a retracement.
And eventually a reversal. This is a critical market dynamic that the institution

Ultimate Breakout Scanner (Multi Pair And Multi Time Frame) : ---LIMITED TIME OFFER: NEXT 25 CLIENTS ONLY ---46% OFF REGULAR PRICE AND 2 FREE BONUSES ---SEE BELOW FOR FULL DETAILS Breakout trading is one of the most popular trading approaches used in the institutional trading world.
As it takes advantage of the never ending phenomena of price expansion and contraction (through volatility) .
And this is how institutional traders are able to take advantage of explosive moves in the market .

Ultimate Moving Average Scanner (Multi Pair And Multi Time Frame) : ---LIMITED TIME OFFER: NEXT 25 CLIENTS ONLY ---46% OFF REGULAR PRICE AND 2 FREE BONUSES ---SEE BELOW FOR FULL DETAILS Institutional traders use moving averages more than any other indicator. As moving averages offer a quick
and clear indication of the different phases of a trend. Such as expansion, pullback, consolidation and reversal.
And viewing the market through the same lens as the institutions is a critical part

Ultimate Double Top Scanner (Multi Pair And Multi Time Frame) : ---LIMITED TIME OFFER: NEXT 25 CLIENTS ONLY ---46% OFF REGULAR PRICE AND 2 FREE BONUSES ---SEE BELOW FOR FULL DETAILS Any major price level that holds multiple times, is obviously a level that is being defended by
the large institutions. And a strong double top pattern is a clear indication of institutional interest.
Double top patterns are widely used by institutional traders around the world. As they allow you to manage
Lo Smart Volume Tracker è un indicatore progettato per fornire informazioni dettagliate sul sentiment del mercato presentando visivamente i dati sui volumi di domanda e offerta in una finestra dedicata. Questo strumento intuitivo aiuta i trader a identificare rapidamente dove si concentra l'attività di acquisto e vendita, consentendo loro di prendere decisioni di trading più informate.
Con Smart Volume Tracker, puoi facilmente valutare se il mercato tende verso un trend rialzista o ribassista
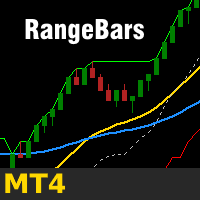
The robust charting solution enables creating custom live range bar charts on the MetaTrader 4 trading platform. You can apply all of the standard and custom indicators and technical studies directly to the range bar charts and you can run EAs directly on these charts as well* (for details see text below the input summary). To create a range bar chart you need to attach the Range Bar indicator to a standard time frame (1 minute is recommended) and use the indicator's settings to generate a live

Indicatore Marley: Trading di Precisione su MT4 Migliora il tuo trading con l'Indicatore Marley, progettato per un'eccezionale accuratezza dei segnali sia su MT4 che su MT5. Questo strumento versatile è ottimizzato per i mercati delle criptovalute e del Forex, offrendo precisione e flessibilità nella tua strategia di trading. Integrazione Perfetta con MT5: Per gli utenti della piattaforma MT5, l'Indicatore Marley è completamente compatibile e accessibile qui. Ottimizzato per i Mercati delle Cr
User Manual For more information pm me SL Currency28 Pair Dashboard is even used by the Banks to make profits. They take a strong currency and pitch against a weak currency This strategy i am made my other indicator SL Currency Strength Meter 28 Pair more improvement We can easily study the financial strength of multi-faceted trading SL Currency28 Pair Dashboard strength meter which creates multiple charts in a single window based on the price action of each currency in relation to
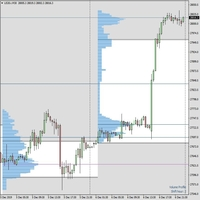
The indicator is fully working. If you want to try it or buy it please get in touch by email first tracktheworld2@gmail.com or via MQL message service. Once you have bought I will send you also a free guide and free resources on how to trade with Market Profile. This indicator is working like in the pictures, 100%. With me you have prime customer service. You are never left alone. I will send you via email the fully working indicator with PDF on how to trade with Market Profile. Fully refu

Ants Lite ATR allows you to enter and manage your trades based on the market volatility, giving you safer entries and better exits. Based on the work by Daryl Guppy.
Features Ability to define the bar the Long and Short calculation starts from. Can be used to generate both entry or exit signals. Customizable ATR period and multiplier. GMMA is a tried and tested indicator with a long pedigree. Volatility based entry and exit signal rather than time based.
How To Use Simply drag the indicator
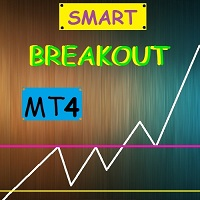
Smart Breakout Indicator determines support and resistance levels and also shows the breakout points of the levels in the form of a histogram.
The program contains two indicators in one: 1-support and resistance lines, 2-histogram indicator based on high price fluctuations. The indicator autonomously calculates the best support and resistance levels and also in the form of a histogram shows the best moments of the breakdown of the lines.
The histogram indicator is based on the action of

Super Trend Filter Indicator Super trend Arrow Consider as a Master Candle , If super trend in Buy signal , then signal candle calculate as master candle and master candle close above the open candle then calculate filter Buy Arrow. If super trend in Sell signal , then signal candle calculate master candle and master candle close below the open candle calculate filter Sell Arrow. 3 Target with Trailing Stop Loss

A huge overhaul and improvement on the highly successful Three Line Strike Finder https://www.mql5.com/en/market/product/60396?source=Site+Profile+Seller This fantastic tool will scan your selected timeframes, and display new three line strike patterns as they appear. No more having to flip through different timeframes to check if a new three line strike pattern has emerged. The supported timeframes are, the current timeframe, 15 minute, 30 minute, 1 hour, 4 hour and Daily, all of which can be

To download MT5 version please click here . This is the exact conversion from TradingView: "B-Xtrender" By "QuantTherapy". - It is an oscillator based on RSI and multiple layers of moving averages. - It is a two in one indicator to calculate overbought and oversold zones for different RSI settings. - This indicator lets you read the buffers for all data on the window. - This is a non-repaint and light processing load indicator. - You can message in private chat for further changes you need.

To get access to MT5 version please click here . - This is a conversion from TradingView: "Hull Suite" By "Insilico". - This is a light-load processing and non-repaint indicator. - You can message in private chat for further changes you need. note: Color filled areas and colored candles are not supported in MT4 version. Here is the source code of a simple Expert Advisor operating based on signals from Hull Suite . #property strict input string EA_Setting= "" ; input int magic_number= 1234 ; inp
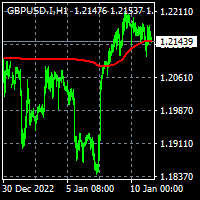
To get access to MT5 version please click here . - This is the exact conversion from TradingView: "Trend Regularity Adaptive Moving Average","TRAMA" By " LuxAlgo ". - This is a light-load processing and non-repaint indicator. - Buffer is available for the main line on chart. - You can message in private chat for further changes you need. Thanks for downloading

To get access to MT5 version please click here . - This is the exact conversion from TradingView: "Stochastic Momentum Index" By "UCSgears". - This is a popular version of stochastic oscillator on tradingview. - This is a light-load processing and non-repaint indicator. - Buffers are available for the lines on chart. - You can message in private chat for further changes you need. Thanks for downloading
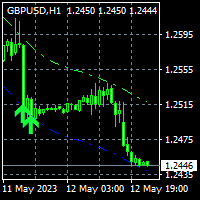
To get access to MT5 version please contact via private message. This is the exact conversion from TradingView:Nadaraya-Watson Envelope" by " LuxAlgo ". This is not a light-load processing indicator. It is a REPAINT indicator. All input options are available. Buffers are available for processing in EAs. You can message in private chat for further changes you need. Thanks.
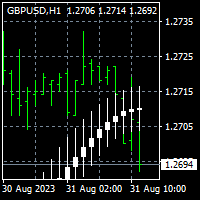
To get access to MT5 version please click here . This is the exact conversion from TradingView: "Smoothed Heiken Ashi Candles v1" by " jackvmk ". This is a light-load processing and non-repaint indicator. All input options are available. Buffers are available for processing in EAs. You can message in private chat for further changes you need. This is not a multi time frame version.
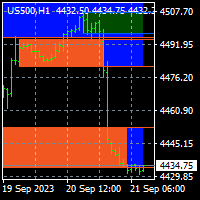
To get access to MT5 version please create personal order. This is the exact conversion from TradingView: Order Blocks & Breaker Blocks [LuxAlgo] This is a light-load processing and repaint indicator. All input options are available. This is not a multi time frame indicator. Buffers are available for processing in EAs. You can message in private chat for further changes you need.
MetaTrader Market - i robot di trading e gli indicatori tecnici per trader sono disponibili nel tuo terminale di trading.
Il sistema di pagamento MQL5.community è disponibile per tutti gli utenti registrati sul sito MQL5.com che effettuano transazioni su MetaTrader Services. Puoi depositare e prelevare denaro usando WebMoney, PayPal o una carta di credito.
Ti stai perdendo delle opportunità di trading:
- App di trading gratuite
- Oltre 8.000 segnali per il copy trading
- Notizie economiche per esplorare i mercati finanziari
Registrazione
Accedi
Se non hai un account, registrati
Consenti l'uso dei cookie per accedere al sito MQL5.com.
Abilita le impostazioni necessarie nel browser, altrimenti non sarà possibile accedere.