YouTube'dan Mağaza ile ilgili eğitici videoları izleyin
Bir ticaret robotu veya gösterge nasıl satın alınır?
Uzman Danışmanınızı
sanal sunucuda çalıştırın
sanal sunucuda çalıştırın
Satın almadan önce göstergeyi/ticaret robotunu test edin
Mağazada kazanç sağlamak ister misiniz?
Satış için bir ürün nasıl sunulur?
MetaTrader 4 için teknik göstergeler - 27

This highly informative indicator applies overbought/oversold levels for more accurate representation of the market situation. All moving average settings are available, including average type and price it is based on. It is also possible to change the appearance of the indicator - line or histogram. Additional parameters enable more fine-tuning, while trading can be inside the channel and along a trend.
Distinctive features Oversold/overbought levels; Does not redraw. Additional parameters fo
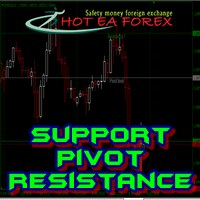
How To Trade
Execute your trades in 3 Easy Steps!
Step 1: Trade Setup Entry Buy = If daily open market Above Line PIVOT or can Price has touched and closed the candle above Resistance1. Entry Sell = If daily open market Under Line PIVOT or can Price has touched and closed the candle above Support1. Step 2: Set Stop Loss Stop loss BUY ----> You can set stop loss on Line Pivot or Support1. Stop loss SELL ----> You can set stop loss on Line Pivot or Resistance1. Step 3: Set Take Profit Take pro
FREE
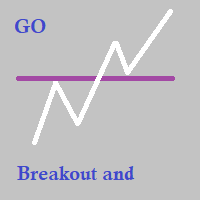
GO Breakout and Retest is probably the best price action indicator you can currently find on the market. Designed for price action traders and not only, the indicator helps you spot retests after breakouts of supply / demand zones.
After purchase, leave a review, a comment or make a screenshot of your purchase and contact me to receive for free the Trade Entry Manager utility !
Please read the full description of the product in order to use the indicator properly !
Feel free to check out

7 yıl sonra, bazı kendi göstergelerimi ve EAlarımı ücretsiz olarak yayınlamaya karar verdim.
Eğer bunları faydalı bulursanız, lütfen 5 yıldızlık bir derecelendirme ile destek gösterin! Geri bildirimleriniz ücretsiz araçların gelmeye devam etmesini sağlıyor! Diğer ücretsiz araçlarımı da buradan görün
_________________________________ Gelişmiş Piyasa Oynaklığı Analizi İçin Bollinger Bant Genişliği Göstergesi MQL4'te ustaca geliştirilen Bollinger Bant Genişliği Göstergesi, forex i
FREE

Are you tired of having many open charts and watching many different currency pairs? MCTSI will monitor the strengths of 56 currency pairs and show you the best pairs to trade, no more guessing which currency is stronger/weaker, no more trading a pair that is not moving positively. This is the BASIC version. MCTSIP is the more advanced version and can be found here: https://www.mql5.com/en/market/product/20994 You may have many charts open trying to determine the best currency pair to trade on
FREE

The Stochastic RSI indicator (StochRSI) is essentially an indicator of an indicator. It is used in technical analysis to provide a stochastic calculation to the RSI indicator. This means that it is a measure of RSI relative to its own high/low range over a user defined period of time. The Stochastic RSI is an oscillator that calculates a value between 0 and 1 which is then plotted as a line. This indicator is primarily used for identifying overbought and oversold conditions.
FREE
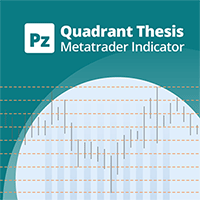
This is a general purpose indicator that displays colored lines at fixed and customizable price intervals, entered as parameters. It offers universal, constant, and familiar price ranges that allow quick and precise price analysis of a currency pair. With default parameters, this indicator implements The Quarters Theory , as described originally by Ilian Yotov . [ Installation Guide | Update Guide | Troubleshooting | FAQ | All Products ] Easy to use No optimization needed Customizable price inte
FREE

The Fisher Transform is a technical indicator created by John F. Ehlers that converts prices into a Gaussian normal distribution. The indicator highlights when prices have moved to an extreme, based on recent prices. This may help in spotting turning points in the price of an asset. It also helps show the trend and isolate the price waves within a trend. The Fisher Transform is a technical indicator that normalizes asset prices, thus making turning points in price clearer. Takeaways Turning poi
FREE
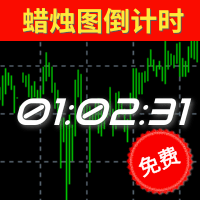
倒计时指标功能介绍 类别
解释
备注
预计结束倒计时 计算当前周期蜡烛图的结束时间(可应用于所有周期),其考虑了蜡烛图可能会因为日常休市而提前结束的情况; 如果该蜡烛图包含多个休市和开市的情况下,以最后的休市或者蜡烛图收盘时间为准。 值得特别注意的是:本指标并没有将平台额外公布的节假日休市、修改休市或者开市时间等因素纳入考虑范围,它仅仅是基于MT4所公开的交易时间做计算,无法100%确保本品种的收盘或者开盘时间无误 ,故使用者需提前明确该品种交易时间情况。
预计开盘倒计时 仅限于状态为"休市中"的提示,根据MT4上公开显示开市时间进行预估大约还有多久时间开盘; 和预计结束倒计时类似,并没有将额外公布的时间纳入考量。由于W1和MN1周期中包含多次的开盘和收盘,所以该两周期无休市提示。
【状态】 颜色 状态 备注 绿色 正常 一切正常 黄色 服务器无报价 服务器实际上传送到MT4并非是毫无中断的,可能是1分钟之内出现多次,甚至是连续较长的时间无报价,取决于您所处的网络延迟、服务器的情况等等。
本品种已有X秒无报价 MT4上并不是所有的品种的报价都是最新的,有可能某
FREE

The Buyside & Sellside Liquidity indicator aims to detect & highlight the first and arguably most important concept within the ICT trading methodology, Liquidity levels. SETTINGS
Liquidity Levels
Detection Length: Lookback period
Margin: Sets margin/sensitivity for a liquidity level detection
Liquidity Zones
Buyside Liquidity Zones: Enables display of the buyside liquidity zones.
Margin: Sets margin/sensitivity for the liquidity zone boundaries.
Color: Color option

Back testing can't; get indicator full performance
Trading the currency markets is a complex business. With so many pairs and multiple timeframes it is almost impossible to monitor them all – but with with the Currency Heatmap you can. The Currency Heatmap indicator delivers the information you need to base your trading decisions on the entire spectrum of currency pairs derived from the 8 major currencies; namely the US dollar, the Euro, the British Pound, the Swiss Franc, the Japanese Yen,

The BB Arrows MTF indicator is based on the Bollinger Bands indicator. Represents input signals in the form of arrows. All signals are generated on the current bar. In 2 modes, Signals are not redrawn (Exception of very sharp jumps)! All signals in MTF mode correspond to signals of the period specified in MTF. It is maximally simplified to use both for trading with only one indicator and for using the indicator as part of your trading systems. A feature of the indicator is that the indicator ti
FREE

Bu kod orijinal olarak LuxAlgo tarafından başka bir programlama dilinden yayınlanmıştır.
Birçok ticaret amacı için kullanılabilecek kabul edilebilir Trend Tahmin yeteneklerine sahiptir. işte kod oluşturucudan bazı açıklamalar:
Bu gösterge, daha önce yayınlanan Nadaraya-Watson yumuşatıcıları üzerine inşa edilmiştir. Burada, fiyat ve zarf uçları arasındaki kesişmelerden entegre uyarılar içeren Çekirdek Düzgünleştirmeye dayalı bir zarf göstergesi oluşturduk. Nadaraya-Watson tahmincisinin aksi

EMA Separation Coefficient reflects the separation between short-term and long-term exponential moving average trend resistance, as well as the direction of the current movement. Pay attention to potential crossover points when the coefficient approaches zero, this may indicate an upcoming breakout or reversal. Wait for confirmation of the trend before entering the trade, and exit when the coefficient forms a max (for calls) or a min (for puts). This is a small tool to help visualize the differe
FREE
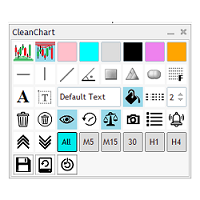
Do you get tired of having a messed up chart with chart objects from various pairs showing up on your current chart? Do you find it boring to have to click multiple clicks to update object colors and styles? Do you want to be able to load a specific set of configurations for your mostly used chart objects? Look no further, CleanChart has it all. 6 customizable Colors User configurable Support and Resistance Colors 10 mostly used chart objects Timeframe visible of any of the objects created Set m
FREE

The purpose of this new version of the MT4 standard indicator provided in your platform is to display in a sub-window multiple timeframes of the same indicator. See the example shown in the picture below. But the display isn’t like a simple MTF indicator. This is the real display of the indicator on its timeframe. Here's the options available in the FFx indicator: Select the timeframes to be displayed (M1 to Monthly) Define the width (number of bars) for each timeframe box Alert pop up/sound/ema
FREE

Trend Sniper Super Indicator is one of the best indicator which can provide you will perfect signals for short term and long term trades. This indicator is suitable for both scalping and swing trading strategies. The indicator is over 85% accurate. It uses terminal Message Alerts, Emails and Push notifications to your mobile device to inform you about the new trading opportunities and it will calculate the take profit and stop loss level for you. All you will need to do is to place a trade. Subs

Trend Power Indicator is an indicator which helps to identify trend direction and its power by using moving averages ZigZag pattern and correlations of tradable instruments. It provides trend power data with user-friendly interface which can be read easily and fast. This indicator by default is configured for trading of Adam Khoo's ( Piranhaprofit ) strategies. It saves mass of time for searching of tradable pairs by his strategies. It indicates when all required moving averages are alignment

This indicator will show yesterday and today high low, very useful to understand the market sentiment. To trade within the range/ break out. Previous day low- can act as support- can used for pull back or break out Previous day high- can act as resistance- can used for pull back or break out The previous day high low breakout strategy refers to the day trading technique that provides traders with multiple opportunities to go either long or short . The main idea is to identify the trend in its m
FREE

Squat bar.
One of the signals of the "Trade Chaos" system of Bill Williams.
It is calculated based on the difference in price changes and tick volume.
Strengthens the signal of the "Bearish/Bullish Divergent Bar (First Wiseman)" if it coincides with it or is nearby.
Tested in comparison with the original program "Investor's Dream".
For more effective development of the system, read and see the materials of Bill Williams.
In the settings you can choose the color and width of bar. (Widt

Never miss a trend change again! This indicator uses various calculation methods based on price action to detect changes in the direction of the trend. It can be used on high timeframes (from H1 to D1) and is most suitable for H4 and Daily timeframe. This indicator is compatible with all broker symbols (forex, indices, CFD, commodities, crypto…). It is also possible to open the indicator on several charts to follow several symbols at the same time. In addition, you don't have to stand by your P
FREE

Using the indicator you can 1 Identify the trend and follow the large and small trends by drawing lines. When the price leaves the corridor of the lines, then with a high probability the price will go to the next line and reverse on it. 2 Long-line - Lay lines along the centers of fractals, the indicator can detect the fractal of the second point (Number bars analysis). Often the price can approach the line even after a week or a month and you can open a reversal trade. If the wave has passed w
FREE

The presented indicator allows you to determine potential entry points into the market and set protective orders at reasonable levels. This product can be useful for both beginners and experienced traders. The indicator is based on calculation methods proven by time and practicing traders.
The indicator is calculated in two stages: At the first stage, linear regression (LR) of the selected price type is determined for a given number of chart periods. At the second stage, the obtained data is p
FREE

The indicator is based on a single Moving Average of a user-defined period. By analyzing the price movement of the price relative to this MA, and also by tracking all updates of the price Highs and Lows over the same period as the MA period, the indicator draws its own picture of the trend, avoiding the ever-breaking MA lines. Therefore, if the trend goes up, the line will also point upwards and will not change its direction even on small retracements, allowing to capture almost the entire trend
FREE

The Breaker Blocks with Signals indicator aims to highlight a complete methodology based on breaker blocks. Breakout signals between the price and breaker blocks are highlighted and premium/discount swing levels are included to provide potential take profit/stop loss levels.
This script also includes alerts for each signal highlighted.
SETTINGS
Breaker Blocks
Length: Sensitivity of the detected swings used to construct breaker blocks. Higher values will return longer te
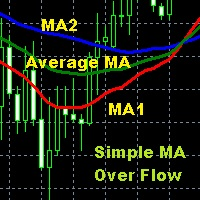
Moving Average is one of the indicators that is widely used in technical analysis which can help to smooth price movements by eliminating some price fluctuations that are less relevant based on past price calculations, so that an average line of price movements is formed within a certain time period. Simple Moving Average Over Flow is an indicator writen by MQL$ language that is given a special additional moving average line based on certain calculations so as to make this moving average better
FREE

LotSize Indicator Discover the appropriate lot size to use in your trades based on the available margin. This indicator provides valuable information for risk management. If the indicator shows a value of 0, it means that your balance or available margin is insufficient for trading. It is important to maintain adequate margin levels for safe trading practices. This indicator is exclusively designed for the MT4 platform, a popular and reliable trading platform in the market. With the LotSize Indi
FREE
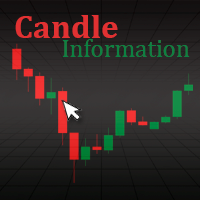
Tool for candle information. It allows to show the user information related to the candle when hovering the mouse over it. It has a simple interface. The user can modify its style by changing the colors in the input parameters.
Show data like: Candle date and time Open price of candle Close price of candle Highest candle price Lowest candle price Candle volume
FREE
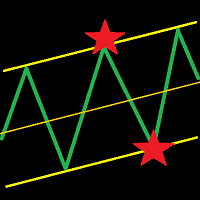
This indicator draws a trend line and a trend tunnel on the chart. You can choose several calculation methods, alerts, notifications, and other settings. It can also draw trendlines from another TimeFrame. You can also use this indicator for your ExpertAdvisor. The current values of the lines are stored in the memory buffer from where the EA can load them. You can trade the price bounce from the upper and lower lines . Settings TimeFrame – trend timeframe Description – show description of line
The Direction Line indicator shows you if the current market is in a up trend or uf ut's in a down trend. The sensitivity of the trend calculation ist customizable. You can adjust it till it fit's your strategy. Even as a beginner is this indicator easy to use and you'll see every trend.
Key Features of Direction Line Real-time trend calculations of all time frames Graphical Interface Identical calculation for all time frames Customizable trend sensivity No repainting
Settings / Inputs
Sen
FREE
Top and Bottom Scalper
BINARY AND FOREX
The signals indicate strong reversal points (Tops/bottoms)- The indicator gives accurate signals on any currency pairs and instruments. It also has a setting for adjusting the frequency of the signals. It is further strengthened and made robust by the support and resistance zones. There are different qualities of zones as per robustness.
Inputs ZONE SETTINGS; BackLimit - default is 10 000. Check the past bars for formations. First Time Fram

Search for an entry with low risk for trading by Lisek Waves Indicator. Using Lisek Waves Indicator can improve your trading performance. In it’s simplest form, this trading tool make it easy to s earch for an entry with low risk and to manage your trade and risk. Lisek Wave analysis is based on the notion that markets follow specific patterns called waves which are the result of a natural rhythm of crowd psychology that exists in all markets. You can avoid the loss from taking trades that are
FREE
Dear Traders, check out my new multi level market liquidity indicator : https://www.mql5.com/en/market/product/73098
Many of you have been trading very good with this indicator, thanks for the support and positive feedbacks ! For more information about market liquidity, a manual on how to use this indicator please send me a message. A lot of information can be found on the net. (search liquidity trading/ inner circle trader)
https://www.youtube.com/watch?v=yUpDZCbNBRI
https://www.youtube.c
Индикатор предназначен для разметки ,фибо уровней и фибо зон.Также есть возможность удаления и редактирования уровней на текущем графике. При установке нескольких индикаторов (FIBO-ZONES)на график,не забывайте менять имя в поле (NAME).В утилите также есть возможность менять цвет зон, толщину линий и стиль линий уровней фибо. При установке индикатора ,зоны выстраиваются автоматически.
FREE

This is an indicator detecting trend direction. It uses the popular Bill Williams Alligator. It shows market state on all timeframes on one chart. As is well known, traders gain the main profit on the Forex market trading by trend, and losses usually occur when the market is flat. So, in order to gain profit a trader should learn to detect trend market and direction of a current trend in a rapid manner. This indicator has been developed for this purpose. MTF Alligator helps to: Profitably trade
FREE

The purpose of this new version of the MT4 standard indicator provided in your platform is to display in a sub-window multiple timeframes of the same indicator. See the example shown in the picture below. But the display isn’t like a simple MTF indicator. This is the real display of the indicator on its timeframe. Here's the options available in the FFx indicator: Select the timeframes to be displayed (M1 to Monthly) Define the width (number of bars) for each timeframe box Alert pop up/sound/ema
FREE
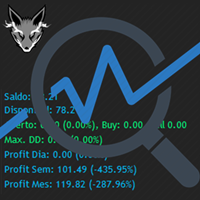
Track your overall trades! Monitor New Fox is an excellent indicator, which displays your current profits, being them monthly, weekly, and daily, that is, all profits obtained when you opened the mt4. Our brand new Monitor New Fox indicator is able to unlock all advanced features of MetaTrader 4. This indicator can graph with simple data key meta trader account data (Balance, Equity, Free Margin, Current Profit/Loss, Profit/Loss total, amount of open position(s) and size, etc.) and all this in a
FREE

Key Price Levels Indicator Indicator that shows the highs and lows for the significant price levels for past periods that could be potentially considered as reaction levels. The indicator displays the following price levels: Yesterday high and low The day before yesterday high and low Two days back high and low Last week high and low Last month high and low Last three month high and low (Quarter) Last year high and low
FREE

Trends are like the "Saint Graal of traders": it can give you an higher win rate, a better risk to reward ration, an easier position management and so on...
But it is really hard to determine the trend with accuracy, avoiding fase signals, and with the right timing, in order to take massive movements. That's why I created the Trend Validator: a new and EASY tool that will make identifying trend and build new strategy a really easier work.
ANATOMY OF THE SOFTWARE
The indicator is composed b
FREE
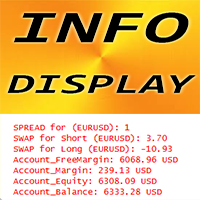
This is Free product you are welcome to use for your needs! Also I very appreciate your positive feedbacks! Thanks a lot! // More great Expert Advisors and Indicators are available here: https://www.mql5.com/en/users/def1380/seller // Also you are welcome to join to profitable , stable and reliable signal https://www.mql5.com/en/signals/1887493 Forex Indicator "INFO Display" for MT4 , Trading Support tool. INFO Display indicator shows current S pread and Swaps of forex pair whe
FREE

Fibonacci retracement is really one of the most reliable technical analysis tools used by traders. The main problem with using these levels in trading is that you need to wait until the end of the impulse movement to calculate the retracement levels, making difficult to take a position for limited retracement (0.236 or 0.382). Fibo Dynamic solves this problem. Once the impulse movement is identified the retracement levels are automatically updated allowing very dynamic trading in trends with onl
FREE
The purpose of this new version of the MT4 standard indicator provided in your platform is to display in a sub-window multiple timeframes of the same indicator. See the example shown in the picture below. But the display isn’t like a simple MTF indicator. This is the real display of the indicator on its timeframe. Here's the options available in the FFx indicator: Select the timeframes to be displayed (M1 to Monthly) Define the width (number of bars) for each timeframe box Alert pop up/sound/ema
FREE
Highly configurable Accumulation and Distribution (AD) indicator. Features: Highly customizable alert functions (at levels, crosses, direction changes via email, push, sound, popup) Multi timeframe ability Color customization (at levels, crosses, direction changes) Linear interpolation and histogram mode options Works on strategy tester in multi timeframe mode (at weekend without ticks also) Adjustable Levels Parameters:
Ad Timeframe: You can set the lower/higher timeframes for Ad. Ad Bar Shi
FREE

7 yıl sonra, kendi indikatörlerimi ve Uzman Danışmanlarımı ücretsiz olarak paylaşmaya karar verdim.
Eğer bunları faydalı bulursanız, lütfen 5-yıldız ile destek gösterin! Geri bildirimleriniz ücretsiz araçların gelmeye devam etmesini sağlar! Daha fazla ücretsiz aracımı ve canlı sinyalimi buradan görebilirsiniz buraya tıklayın
_________________________________ Engulf Dedektörü - Basitleştirilmiş İşlem İndikatörü Forex piyasasında yutan (engulfing) formasyonlarını tespit etmek
FREE

Volatility Limit Trend Indicator (VLT), an original indicator by this developer, is a trend indicator based on setting a fixed volatility limit as a percentage of price. Volatile price is allowed to wander between two channel lines defining the fixed volatility about a central line. The price crossing one of the channel lines defines an exceeding of the allowed volatility, and ushering in one of two situation : either a continuation or a reversal of trend. The first buffer of the indicator (not
FREE

What is the Overlay Chart Indicator? The Overlay Chart indicator is exactly as its name suggests. It is a custom technical indicator which overlays another price chart over the current price chart window. It allows traders to overlay another currency pair over one pair which allows them to compare price movements and the characteristics of price action. It then plots a grid to indicate the price of the overlaid currency pair for better reference. It also plots the open, high, low, and close pric
FREE

This indicator is an interpretation of the values of the classic indicator - RSI. A filter is used to smooth the sharp fluctuations of the indicator values, eliminating the weak changes and focusing the trader's attention on strong fluctuations of values. The indicator is not redrawn on completed bars. For greater efficiency of this indicator, it should be used in conjunction with the indicators that identify the trend direction, as well as support/resistance levels. Signals: Histogram crossing
FREE

This powerful tool helps you to easily access Fibonacci tools at different times and in different markets. This tool has the ability to send signals based on Fibonacci as well as setting alarms to be aware of broken Fibonacci levels. Among the capabilities of this tool are the following:
Identifies market trends Fibonacci auto design If Fibonacci levels are broken, it sends a message Send Fibonacci signal
Manuals: After selecting the target market, run the tool In the input settings accordi
FREE
Highly configurable Osma indicator.
Features: Highly customizable alert functions (at levels, crosses, direction changes via email, push, sound, popup) Multi timeframe ability Color customization (at levels, crosses, direction changes) Linear interpolation and histogram mode options Works on strategy tester in multi timeframe mode (at weekend without ticks also) Adjustable Levels Parameters:
Osma Timeframe: You can set the lower/higher timeframes for Osma. Osma Bar Shift: Y ou can set
FREE
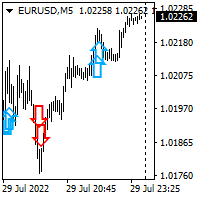
Hello all. This indicator helps you to open a trade, when break out occurred, also you can add to your position and ride it if trend continued. I use it on 1-5 min chart, as you can use short stop loss. Also profit target should be small as well. It is better to enter few small position, so you can book some profit early and ride the rest for bigger gains. Look at the past to have a plan. Enjoy.
FREE
Вилка Нео v5, разрабатывалась для торговой системы "Оракул", но постепенно дополнялась, например - углами Ганна и другими опциями...
Можно создавать графические объекты с заданным цветом, стилем и толщиной, такие как: прямоугольники с заливкой и без, отрезки трендлиний и нестандартный инструмент - "вилка Нео" в виде трезубца, так же есть возможность интерактивно настраивать цветовую палитру прямо с графика, настраивать видимость объектов для разных ТФ, толщину и стили... Панель переключается кл
FREE

Индикатор рисует уровни Фибоначчи с выделенными Ценовыми метками.При установке индикатора на график необходимо создать трендовую линию с именем указанным в поле" Unique name of trend line to place fib on ". По умолчанию имя=" Unique name of trend line to place fib on" = "+" .В индикаторе можно заменить уровни фибоначчи по своему усмотрению.Также меняются цвет,стиль,толщина линий и т. д.
FREE

This Indicator is based on Mr. Dan Valcu ideas.
Bodies of candles(open-close) are the main component used to indicate and assess trend direction, strength, and reversals.
The indicator measures difference between Heikin Ashi close and open.
Measuring the height of candle bodies leads to extreme values that point to trend slowdowns. Thus quantifies Heikin Ashi to get earlier signals.
I used this indicator on Heiken Ashi charts but, it's possible to choose to calculate Body size based on
FREE

Bu ürün, göstergelerden/sinyal araçlarından bilgi alır ve belirli koşullar karşılandığında okları veya bildirimleri görüntüler.
Örneğin, MA25 ve MA50 kesiştiğinde, SAR tersine döndüğünde, MACD artı/eksi değiştirdiğinde veya kapanış fiyatı Bollinger Bantlarını geçtiğinde oklar ve bildirimler gösterilir.
Belirli yapılandırmalar için lütfen örnek ayarlar görüntüsüne bakın.
Ayrıntılı kılavuzlar ve yapılandırma dosyaları için:
https://www.mql5.com/en/blogs/post/755082
Ücretsiz bir s
FREE

Simulator for Risk / Reward ratio calculator We-RiskReward is a MT4 indicator made by the We-Trading team to simulate an order with Risk / Reward calculator.
Horizontal Lines This indicator show you 3 horizontal lines that are: Open line Take Profit line Stop Loss line You can move the lines and you will see R/R and Lots calculation in real time. You can use it to simulate Long and Short positions.
Indicator parameters As input parameters you need to check only the Risk for trade. For e.g. y
FREE

For all those traders interested or currently trading Ichimoku, you will not want to miss this article. Although I am heading out in a few hours with my girlfriend to Harbin Hot Springs, I wanted to write a brief introduction to Ichimoku Number Theory as there has been a lot of questions (and confusion) about Ichimoku settings, time frames, etc. The basis of Ichimoku as known to most is the 5 lines; Tenkan Line Kijun Line Senkou Span A (part of the Kumo) Senkou Span B (other part of the Kum
FREE

Necessary for traders: tools and indicators Waves automatically calculate indicators, channel trend trading Perfect trend-wave automatic calculation channel calculation , MT4 Perfect trend-wave automatic calculation channel calculation , MT5 Local Trading copying Easy And Fast Copy , MT4 Easy And Fast Copy , MT5 Local Trading copying For DEMO Easy And Fast Copy , MT4 DEMO Easy And Fast Copy , MT5 DEMO MACD is called Convergence and Divergence Moving Average, which is developed from the double e
FREE

The indicator is based on identifying engulfing candlestick patterns within the current timeframe. When such patterns are found, it generates buy and sell signals represented by up and down arrows, respectively. However, the user is responsible for determining the prevailing trend. Once the trend is identified, they should trade in line with the corresponding signal that aligns with the trend direction.
FREE

FREE FOR A LIMITED TIME ONLY!!! The Ultimate Indicator For Trading Trend This indicator clearly shows you the strength of the market in one direction or the other, which means that you can trade knowing you are either with or against the market. When used in conjunction with the +3R principles you are sure to have some serious results. The +3R Principles Routine - This is when you trade and how often Rules - This is the rule you follow Risk:Reward - This is the percentage amount of your accoun
FREE

BeST_Chande RAVI (Range Action Verification Index) is an MT4 Indicator that is based on the corresponding indicator developed by Tushar Chande which is mainly based on market momentum while focuses on identifying ranging and trending markets.
By default RAVI is defined by the formula: RAVI = Absolute value (100 x (SMA(7) – SMA(65)). Also by default there is an arbitrary reference level of 3% that means a market is ranging if the RAVI is less than 3%, or trending strongly if it is is greater t
FREE

Indicador "Supply and Demand Channels" para MetaTrader: Potencia tu Trading con Claridad y Precisión El indicador "Supply and Demand Channels" para MetaTrader es una herramienta avanzada diseñada para brindar a los traders una visión nítida y precisa de las zonas clave de oferta y demanda en el mercado. Basado en el principio fundamental de la ley de oferta y demanda, este indicador ofrece una interpretación gráfica única de las fuerzas que impulsan los movimientos de precios. Características De
FREE
IntradaySignals Intraday Signals is a visual and effective semi-automatic trading system, that: generates possible entry points to open BUY and SELL trades; displays recommended Take Profit and Stop Loss; displays current profit on open trade; displays current spread. The profitability of the indicator is shown in the screenshot on the example of the GBPUSD pair Does not redraw and works on opening bar. Time frames - M1-H1. Recommended TimeFrame-M5-M15. Signals are produced based on the used
FREE
BBMA, which stands for Bollinger Bands and Moving Average , is a trading method that is quite popular and widely used not only in the forex market but also in the stock and commodity markets. This strategy is different from another version of BBMA called BBMA Oma Ally, which uses two Moving Averages. In the BBMA strategy, traders use the Bollinger Bands to spot possible changes in direction and the Moving Average to decide when it's a good time to get in on a trade .
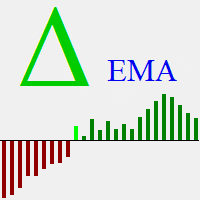
Delta EMA is a momentum indicator based on the changes of closing price from one bar to the next. It displays a histogram of the exponential moving average of those changes, showing magnitude and direction of trend. Positive delta values are displayed as green bars, and negative delta values are displayed as red bars. The transition from negative to positive delta, or from positive to negative delta, indicates trend reversal. Transition bars that exceed a user specified value are displayed in br
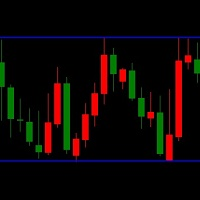
LT Triple Support Resistance Screen Method is a kind of levels indicator that consist of three SR lines. It is built by MQL4 programming language and can be used to MT4 platform. A free version indicator to determine the support and resistance levels easily This indicator works based on the screen method to calculate the most appropriate value for each buffer. A complex algorithm based on long research is applied to this free custom indicator. But this indicator has limited features and simpler
FREE

This indicator is designed for binary options. Based on proprietary divergence of the CCI indicator. A sell signal: A down arrow appears on the chart. A buy signal: An up arrow appears on the chart.
Input parameters History - the number of bars in history for calculation Period CCI - period of the CCI technical indicator Up border - overbought limit for calculation of the divergence Down border - oversold limit for calculation of the divergence Price - price for the indicator calculation Alert
FREE

SKAN This indicator helps you to scan all symbols which are in the Market Watch window and filter out a trend with alerts. It works on five most effective indicators which are used by most of traders for trading: Moving Average Super Trend (ST) Bolinger Band (BB) OPRC BFD It calculates two bars for scanning. When box colour changes to coral or royal blue colour, it indicates you for trend change for long and short entry. And also you will get alert on screen. When it changes to royal blue, it
FREE
Please read before you purchase : - We don't have buyer's detail when purchase was made. In order to get the bonuses, you need to contact me via product comment ( not product review). That way I will contact you back via mql message asking for email. - Please make sure you enable receiving message from non-friend list, otherwise I cannot message you for email. This indicator is not just about Smart Money Concept, with lots of features which I believe could help you understand the concept. Not on

Multi-Asset Forex Scanner
This indicator allows you to scan multiple assets at once, sending you configurable alerts when any asset touches daily pivot levels 1, 2 or 3.
The original code was just modified to send alerts to MT4 Desktop, MT4 Mobile or Email. (Credits for the original code go to Carlos Oliveira)
In order to receive mobile or Email alerts you must configure Notifications and Email sections in the MT4 platform.
In addition to pivots, this indicator also shows ATR, Volume,
FREE
MetaTrader Mağazanın neden ticaret stratejileri ve teknik göstergeler satmak için en iyi platform olduğunu biliyor musunuz? Reklam veya yazılım korumasına gerek yok, ödeme sorunları yok. Her şey MetaTrader Mağazada sağlanmaktadır.
Ticaret fırsatlarını kaçırıyorsunuz:
- Ücretsiz ticaret uygulamaları
- İşlem kopyalama için 8.000'den fazla sinyal
- Finansal piyasaları keşfetmek için ekonomik haberler
Kayıt
Giriş yap
Gizlilik ve Veri Koruma Politikasını ve MQL5.com Kullanım Şartlarını kabul edersiniz
Hesabınız yoksa, lütfen kaydolun
MQL5.com web sitesine giriş yapmak için çerezlerin kullanımına izin vermelisiniz.
Lütfen tarayıcınızda gerekli ayarı etkinleştirin, aksi takdirde giriş yapamazsınız.