YouTube'dan Mağaza ile ilgili eğitici videoları izleyin
Bir alım-satım robotu veya gösterge nasıl satın alınır?
Uzman Danışmanınızı
sanal sunucuda çalıştırın
sanal sunucuda çalıştırın
Satın almadan önce göstergeyi/alım-satım robotunu test edin
Mağazada kazanç sağlamak ister misiniz?
Satış için bir ürün nasıl sunulur?
MetaTrader 4 için teknik göstergeler - 21

Scalper gun - the main weapon for trade in scalping and swing, with visualization and alert of entry points. The indicator works in both trend and non-trend market conditions. Suitable for beginners and experienced traders. SCALPER GUN surpasses popular top indicators of this site in speed, quality of visualization and accuracy of entry !!!
Before buying, download the Scalper gun demo and compare it with similar indicators for scalping in the MT4 tester. Features This is a complete trading sy
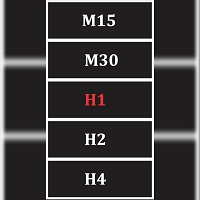
Seamlessly switch between 13 (9 mt4 default and 4 popular custom) time frame with this tool. Real ease of switching between default and custom time frames. Note indicator does not create custom time frame chart data, it only enables you to switch to and from them. Creating a custom time frame can be done using the default mt4 period converter script attached to a lesser default mt4 time frame. Example attach period converter on M1 and set period multiplier to 10 to have a custom M10 chart.
FREE
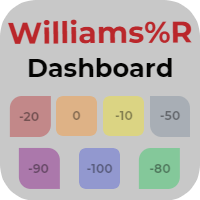
The Williams Dashboard is an information panel which allows you to have a global market vision through a Williams Percent Range. Williams Dashboard analyzes and tracks all the assets you want to invest in. Take advantage of this useful dashboard where you can open in a few seconds the chart and quickly invest in it.
Main Features of Williams Dashboard Graphic panel that allows you to know the situation of many assets. 7 Different Williams Percent Range situations to discover when an asset is ov
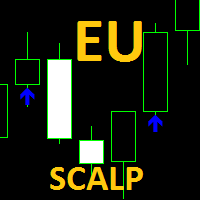
Uyarıları olan ölçeklendirme göstergesi:
AB Saç Derisi göstergesi, iki çalışma setinin bir kombinasyonudur; birincisi, fiyat hareketinin yönüne karşı çalışmak üzere önceden ayarlanmıştır ve ikincisi, fiyat dalgalanmaları veya kırılma olasılığına bağlı olarak fiyat hareketinin yönü üzerinde çalışmaktadır. önemli ticaret seviyeleri.
Varsayılan ayarlar EurUsd çifti M5 Zaman Çerçevesi için optimize edilmiştir, daha fazla ayar ilk yorumdaki "Yorumlar" bölümünde bulunabilir.
Beklenen sonuçları ve
FREE

Supply Demand Zone Pro Indicator works with all products and timeframes. It is using a new calculation method, and now you can select the desired zone on any timeframe! Strongest Zones are already enabled by default This is a great advantage in trading.This indicator has a built in backtester enabled by default, just move the chart.
Supply and Demand ?
Supply is a price zone where sellers outnumbered buyers and drove the price lower. Demand is a price zone where buyers outnumbers sellers and dr

The Nihilist 5.0 Indicator includes Forexalien and Nihilist Easy Trend trading strategies and systems. It is composed of an MTF Dashboard where you can analyze the different input possibilities of each strategy at a glance. It has an alert system with different types of configurable filters. You can also configure which TF you want to be notified on your Metatrader 4 platform and Mobile application
The indicator has the option to view how could be a TP and SL by using ATR or fixed points, even w
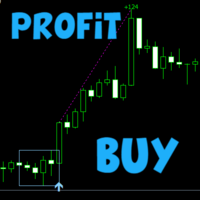
Scalper Box MT4
Fully ready strategy for trading on all markets (Stocks, Futures, Forex and Cryptocurrencies).
Indicator signals are not repaint!!!
How to trade?
Wait for a signal from the indicator Scalper Box MT4 (blue arrow - buy, red arrow - sell).
After the signal we immediately enter the market, SL set behind the formed box.
Using trend filter indicator and template
Recommended timeframe:
M5 - Ideal for Scalping.
M15 - Suitable for Daytrading.
H1 - Suitable for Swing Trading.

Features: Find these engulfing patterns: Simple Engulf Stick Sandwich Engulf Three Line Strike Rising Three Morning Star Doji Scanner is useful to make your strategy better. Don't always go by Win/Loss percentage. Because this tool is not based on past results. Basic Settings: For All Patterns You can set: First:Last Candle Ratio This will make sure that the earlier opposite candle is at least this given ratio in height as compared to the engulfing candle. This is not checked for Three Line Stri
FREE
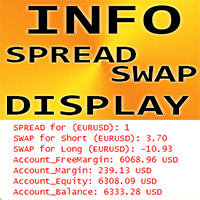
MT4 için Forex Göstergesi "INFO Spread Swap Ekranı", Ticaret Yardımcı Aracı.
- INFO Spread Swap Ekranı göstergesi, eklendiği forex çiftinin mevcut Spread'ini ve Swap'larını gösterir. - Ayrıca hesap Bakiyesini, Sermayeyi ve Marjları gösterir. - Gösterge değerlerini grafiğin herhangi bir köşesinde bulmak mümkündür: 0 - sol üst köşe, 1 - sağ üst, 2 - sol alt, 3 - sağ alt. - Renk ve yazı tipi boyutunu ayarlamak da mümkündür.
// Daha fazla harika Uzman Danışman ve Gösterge burada mevcuttur: https:

The indicator has combined 5 popular strategies. Draws an arrow after confirming a signal for the selected strategy. There are signal alerts. Doesn't redraw its values. I recommend watching my advisor - Night Zen EA
5 strategies. The main line crosses the signal line. The main line crosses the signal line in the oversold (for buy) / overbought (for sell) zones. The main line enters the oversold (for sell) / overbought (for buy) zones . The main line comes out of the oversold (for buy ) / over
FREE

Screener Breakout Congestion: Have you ever missed a trading opportunity because you were not looking at the chart of that market in that specific time frame? Here is this screener to help you identify congestion breakouts in the markets you want to follow in the different time frames required. Once you have identified the markets (forex, indices, CDF) and the different time frames (1M, 5M, 15M, 30M, 1H, 4H, Daily), the screener is represented by several buttons that change colour when the conge
FREE
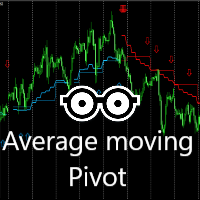
This indicator is very effective for trading everyday. A combination of moving averages and 2X Pivots calculation to produce a very convincing signal everyday. Blue colour signals a buy opportunity. Follow the arrows for possible buy points. The Blue pivots and average line, serves as possible support. Red colour signals a sell opportunity. Follow the arrows for possible sell points. The Red pivots and average line, serves as possible resistance. Best use on the 15 minutes, 30 minutes or 1 hour
FREE
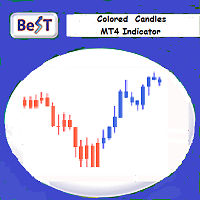
BeST_Colored Candles is an MT4 FREE indicator that can change the color of the Candlesticks based on the MACD, SAR or RSI values and levels. It is a Composite indicator that by selection uses the values each one of these 3 indicators and their critical levels in order to create numerical relationships that when satisfied cause their corresponding candlesticks coloration.
Input parameters
== Basic Settings
-- Please Select Indicator - for selecting which one of the above 3 indicators
FREE

This Dashboard is free to download but is dependent on you owning the Gold Pro MT4 indicator. Get the indicator here: https://www.mql5.com/en/market/product/60430
The Dashboard will show you on a single chart all the timeframes (M1 to Monthly) with their own status for the indicator: Gold Pro MT4
all time frame and all symbol: smart algorithm detects the trend, filters out market noise and gives entry signals!!!
How to understand the status: Dashboard Show "Buy" - Buy Signal Das
FREE
Highly configurable Williams %R indicator. Features: Highly customizable alert functions (at levels, crosses, direction changes via email, push, sound, popup) Multi timeframe ability Color customization (at levels, crosses, direction changes) Linear interpolation and histogram mode options Works on strategy tester in multi timeframe mode (at weekend without ticks also) Adjustable Levels Parameters:
Williams %R Timeframe: You can set the current or a higher timeframes for Williams %R. Williams
FREE

Contact me after payment to send you the User-Manual PDF File. How To Test
You can test the indicator by free version, to get the free version please contact me ( the free version scans charts in W1 and MN1 time-frames ) it's free.
123 Pattern Breakout
Trend is your friend, trade along the trend, but how do we identify trends? Sometimes the simplest methods have the best results. Pattern 123 is based on the breakout important price levels, when the price is trying to break the previous h

MetaTrader için Slope Channel Göstergesi
Her ticaret tarzına uygun bir piyasa trend analizi aracı mı arıyorsunuz? Slope Channel – fiyat hareketlerini ve kilit piyasa seviyelerini belirlemede güvenilir yardımcınız! Slope Channel Nedir? Slope Channel, grafik üzerinde eğimli bir kanal oluşturan ve parametrelerini yerel ekstrem noktalarına dayanarak otomatik olarak hesaplayan yenilikçi bir göstergedir. Bu araç, en uygun kanal seçeneğini vurgular ve değişen piyasa koşullarına hızlı bir şekild
FREE
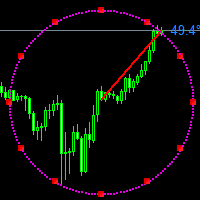
SpeedAngle Göstergesi , MetaTrader 4 (MT4) için geliştirilmiş bir araçtır. Fiyat hareketlerinin açılarını hesaplar, dinamik görsel sinyaller ve özelleştirilebilir uyarılar sunarak, trend dönüşlerini ve momentum değişimlerini hızlı bir şekilde tespit etmenize yardımcı olur. Ana Özellikler Açı Temelli Trend Analizi: Kullanıcı tarafından belirlenen bir süre boyunca açıları hesaplar ve fiyat hareketinin yönünü ve hızını gösterir. Dinamik Görselleştirme: Hesaplanan açılara göre renk değiştiren bir da

Pivot levels is indicator showing 7 pivot levels. It is adjusted for major use, including: all standard time frames
choice of periods to show three popular calculation formulas (typical, median, weighted) 9 level Camarilla pivot
pivot day shift choice of properties for lines and labels choice of showing alerts when crossing pivot lines Parameters: ----------Main parameters----------- Timeframe - time frame for pivot levels
Number of periods to show - displays pivot levels for number of periods
FREE

Wicks UpDown Target GJ
Wicks UpDown Target GJ is specialized in GJ forex pairs.
Choppy movement up and down on the opening range every day. Trading breakouts on London session and New York session is recommended.
Guideline Entry Strategy Idea:
Step 1 - Breakout Forming (Warning! Trade on London Session and New York Session) Step 2 - Breakout Starting (Take Action on your trading plan) Step 3 - Partial Close your order & set breakeven (no-risk) Step 4 - Target complete Step 5 - Don't trade
FREE

The indicator gives buy or sell signals based on the Parabolic SAR indicator, and it also contains strategies with Moving Average. There are alerts and alerts to the mobile terminal and to the mail. Arrows are drawn on the chart after the signal is confirmed. They don't redraw. I recommend watching my advisor - Night Zen EA
To keep up to date with my latest products and ideas, join my telegram channel and subscribe to my profile. The link in my profile contacts - My profile The indicator in
FREE

EZ Risk Reward Ratio is a simple to use MT4 indicator that allows the user to automatically change the Risk Reward Ratio of an open trade simply by dragging the Take Profit or Stop Loss lines to desired positions on any chart. Risk to reward ratio is displayed in whichever corner you choose and can be changed by dragging TP and SL lines.
First, place the EZ Risk Reward Ratio indicator on the MT4 chart. Second, open a trade on the MT4 chart. EZ Risk Reward Ratio works on any currency pair and o
FREE

This indicator helps you to scan symbols which are in the Market Watch window and filter out a trend according to RSI.
The relative strength index (RSI) is a technical indicator used in the analysis of financial markets. It is intended to chart the current and historical strength or weakness of a stock or market based on the closing prices of a recent trading period. The indicator should not be confused with relative strength. The RSI is classified as a momentum oscillator, measuring the veloci
FREE
As every ZigZag Indicator this Indicator Repaints . So use this only combining with other indicators or strategy.
CyberZingFx ZigZag Arrow MT4 Indicator, is one of the best tool for traders looking to identify trend reversals in the markets. This powerful indicator uses the ZigZag method to help you identify key support and resistance levels, making it easier to spot significant changes in price and filter out short-term fluctuations. With CyberZingFx ZigZag Arrow, you can quickly and easily
FREE

Market Calculator is a powerful tool that allows you to easily and quickly calculate the main parameters of a trade: Lot size, StopLoss and TakeProfit, as well as estimate the amount of funds (required Margin) to open a position. The program has a very convenient and intuitive control, because implemented in OS Windows style. There are many interesting and handy features - just watch the video: youtu.be/FG2qqTJTIhE All program data are sorted into sections in the form of tabs: " Lot Calculator "

The XR Gartley Pattern MT4 is an indicator which displays and alerts Gartley pattern detected on the candlestick chart. It also displays potential trade with calculated Take Profit and Stop Loss, Timeframe H1. After purchasing XR Gartley Pattern, you can immediately download this indicator from the MT4-MT5 Market and start using it because all features are set to default, is not necessary to change any parameter. In addition, we have created a private group for customers who have purchased one
FREE

Bu göstergenin benzersizliği, hacim hesaplama algoritmasında yatmaktadır: birikim, günün başlangıcına bakılmaksızın doğrudan seçilen dönem için gerçekleşir. Son çubuklar hesaplamanın dışında tutulabilir, bu durumda mevcut veriler daha önce oluşturulan önemli seviyeler (hacimler) üzerinde daha az etkiye sahip olacaktır. Daha doğru bir hesaplama için varsayılan olarak M1 grafiğindeki veriler kullanılır. Fiyat hacimlerinin dağıtım adımı düzenlenir. Varsayılan olarak, ekranın sağ sınırı, analiz için
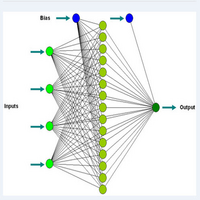
Güncelleme! 100 ve 200 seviyelerine oklar eklendi.
Bu gösterge, uç noktalara erişim için doğrudur ve öncelikle 1 dakikalık zaman dilimleri için satın alma pozisyonları için destekler. Diğer zaman dilimleri kullanılabilir ancak seviyeler farklıdır. Daha iyi bir osilatördür ve farkı görmek için diğerleriyle karşılaştırır.
Nöro ağ kavramlarını kullanarak günlük ticaret. Bu gösterge, satın almak ve satmak için sinyaller üretmek için temel nöro ağ biçimlerini kullanır. Göstergeyi 1 dakikalık grafik

The indicator is designed for displaying the following price levels on the chart: Previous day's high and low. Previous week's high and low. Previous month's high and low. Each of the level types is customizable. In the indicator settings, you set line style, line color, enable or disable separate levels. The version of the exact same indicator but only with sound alerts there - Time Levels with Alerts .
Configurations ----Day------------------------------------------------- DayLevels - enable/
FREE
Bu gösterge, giriş parametreleri çubukları algılama stratejisini kullanarak Breakout'u saptar. Sinyalleri (doğru) doğrulamak için WaitForBarClosed işlevini kullanabilirsiniz, ancak bazen yanlıştan biraz sonra etkinleştirilir. Gösterge ayrı bir pencerede açılır. Tüm zaman dilimleri ve çiftler için uygundur. Mavi çizgi trend yönünü gösterir.
Göstergeyi herhangi bir grafiğe ekleyin Açılan gösterge iletişim kutusundan girişler Sekmesinde istenen girişleri seçin. Onaylamak ve devam etmek için Tamam

Gösterge, ZigZag göstergesine, İşlem Seanslarına, Fraktallara veya Mumlara (standart olmayan zaman dilimleri dahil: Yıl, 6 Ay, 4 Ay, 3 Ay, 2 Ay) (Otomatik Fibo Geri Çekme) dayalı olarak Fibonacci seviyelerini otomatik olarak çizer. Fibonachi hesaplaması için daha yüksek bir zaman dilimini seçebilirsiniz. Mevcut çubuk her kapandığında seviyeler yeniden çizilir. Belirtilen seviyeleri geçerken uyarıları etkinleştirmek mümkündür.
Ayrıca tarihteki seviyeleri de analiz edebilirsiniz. Bunun için "Geç

CPR Pivot Lines It Will Draw Pivot Point R1,R2,R3 S1,S2,S3 Tc Bc Best Part Is That You Can Even Add Values Of High,Low,Close Manually Also To Get Your All Levels On Chart. So If Your Broker Data Of High ,Low ,Close Is Incorrect Then You Don’t Have To Depend On Them Anymore. You Can Even Modify All Lines Style. It Will Show Line In Floating Style And Not Continues Mess.
FREE
Dynamic Trading Dashboard for MT4 This powerful MT4 trading dashboard offers traders a comprehensive view of current and historical trading performance in an intuitive and visually organized format. With its precision-engineered design, the dashboard provides a seamless blend of real-time insights and historical analysis. This trading dashboard is perfect for meticulous traders who seek a precise, all-encompassing tool to manage open and closed positions while gaining insights into past perform
FREE

The purpose of this new version of the MT4 standard indicator provided in your platform is to display in a sub-window multiple timeframes of the same indicator. See the example shown in the picture below. But the display isn’t like a simple MTF indicator. This is the real display of the indicator on its timeframe. Here's the options available in the FFx indicator: Select the timeframes to be displayed (M1 to Monthly) Define the width (number of bars) for each timeframe box Alert pop up/sound/ema
FREE

IceFX Heatmap is a special indicator that shows the places where the price has been staying and ranging over the past few days. These sites will be displayed in a "Heatmap style", with which you can clearly see the main formed bands. The main rates (where the price has "lingered/stayed" much) are indicated in bright colors (in case of black-and-white view) or red color (in case of color view).
Settings Days - the number of days the heat(map) is calculated for. Resolution - resolution rate. 10 =
FREE
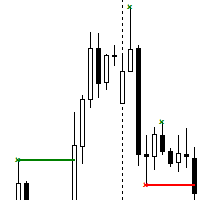
The Contraction/Expansion Breakout Indicator for MetaTrader 4 (MT4) is a powerful tool crafted to identify and signal the breakout of bullish and bearish contraction or expansion formations within financial markets. Utilizing advanced algorithmic calculations, this indicator assists traders in recognizing significant price movements that frequently accompany these formations, providing valuable insights for strategic trading decisions. Key Features: Contraction and Expansion Identification: The
FREE
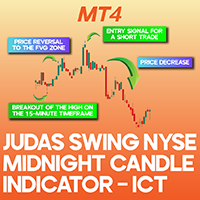
Judas Swing Indicator ICT MT4 The Judas Swing Indicator for MetaTrader 4 is a technical analysis tool designed to detect price reversals. It assists traders in pinpointing ideal trade entries and exits by identifying misleading price movements that often precede significant market shifts. Indicator Overview Category ICT - Smart Money - Liquidity Platform MetaTrader 4 Skill Level Advanced Indicator Type Continuation - Reversal Timeframe 1 Minute - 15 Minutes Trading Style Fast Scalping - Scalping
FREE
Индикатор предназначен для разметки ,фибо уровней и фибо зон.Также есть возможность удаления и редактирования уровней на текущем графике. При установке нескольких индикаторов (FIBO-ZONES)на график,не забывайте менять имя в поле (NAME).В утилите также есть возможность менять цвет зон, толщину линий и стиль линий уровней фибо. При установке индикатора ,зоны выстраиваются автоматически.
FREE

RaysFX Stochastic L'indicatore RaysFX Stochastic è un indicatore personalizzato per la piattaforma MetaTrader 4.
Caratteristiche principali:
-Indicatori separati: L'indicatore viene visualizzato in una finestra separata sotto il grafico principale. -Livelli dell'indicatore: L'indicatore ha due livelli predefiniti, 20 e 80, che possono essere utilizzati come livelli di ipervenduto e ipercomprato. -Buffer dell'indicatore: L'indicatore utilizza quattro buffer per calcolare e memorizzare i suoi
FREE

Lisek Stochastic oscillator indicator with Alarm, Push Notifications and e-mail Notifications. The Stochastic indicator is a momentum indicator that shows you how strong or weak the current trend is. It helps you identify overbought and oversold market conditions within a trend. The Stochastic indicator is lagging indicator, which means it don't predict where price is going, it is only providing data on where price has been !!!
How to trade with Stochastic indicator: Trend following: As long
FREE

Gösterge, dürtü mumlarını arar ve bunları grafikte görüntüler. Bir gölge filtresi içerir. Ayrıca Bollinger Bantlarının koparma seviyelerini de bulur. Ayarlarda çoklu para birimi gösterge tablosunu etkinleştirebilirsiniz. Uyarı, mevcut grafik veya tüm liste arasında seçim yapar. Blog-Link - Retest and Fake Breakout with UPD1
Ticaret modelleri: Trend yeniden testi. Yanlış Kopuş. Diğerleri.
EURUSD, GBPUSD, XAUUSD, ... M15, M30, H1.
Giriş parametreleri.
Temel. Bars Count - göstergenin üzerinde
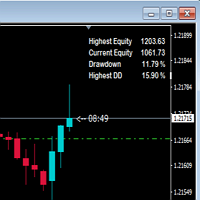
This indicator shows drawdown based on highest equity. Usually drawdown is used to show performance of a trading account especially when someone participate in a trading contest. If drawdown exceed a determined number, the contest account will be disqualified. So, I hope, this indicator will warn us in maintaining the drawdown and the account still be saved.
FREE

İçine Çeken şamdan desenini gösteren bir gösterge. Ayarlarda, yutkunma türünü (gövde, gölge ve kombinasyon) belirtebilirsiniz. Eğilime (2 hareketli ortalama) ve tersine (RSI ve Bollinger Bantları) göre filtrelemek mümkündür. Bu çok popüler bir fiyat hareket modelidir. Çok para birimli gösterge tablosu mevcuttur. Bununla birlikte, grafikler arasında kolayca geçiş yapabilirsiniz.
Ticaret Kalıpları: Trendlere göre tekrar test. Yanlış koparma. Sipariş Bloğu. Başka.
EURUSD, GBPUSD, XAUUSD, ... M15

Çoklu para birimi ve çoklu zaman dilimi göstergesi Inside Bar (IB). Parametrelerde istediğiniz para birimini ve zaman dilimini belirtebilirsiniz. Panel, en son bulunan İç Çubuk (ve Ana Çubuk) formasyonunu, mevcut fiyat pozisyonunu ve Ana ve İç Çubuk seviyelerinin kırılmasını görüntüler. Hücrelerdeki çubukların ve metnin boyutunu ve rengini ayarlayabilirsiniz. Gösterge aynı zamanda seviyeler kırıldığında da bildirim gönderebiliyor. Noktalı bir hücreye tıkladığınızda belirtilen sembol ve nokta aç
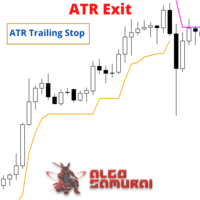
The ATR Exit indicator uses the candle close + ATR value to draw trailing stop lines (orange under buys, magenta over sells) that advance with the trend until the trend changes direction. It uses a multiple of the Average True Range (ATR), subtracting it’s value from the close on buy, adding its value to the close on sell. Moreover, the trailing stop lines are generated to support the order’s trend direction (long or short): In an upward trend, the long trailing stop line (orange line under bu
FREE

This indicator is based on the ADX indicator and indicates the trend very easily.
You can customize the indicator to your needs: ADXPeriod ADXSignal_Level BarWidth CandleWith HeikenAshi
The Adx color candles indicator is fully FREE and compatible with the other part of the system; the Acc arrow >>>> https://www.mql5.com/en/market/product/33770 ENJOY and check out my other indicator: https://www.mql5.com/en/market/product/32111
FREE
The script tries to determine the overall direction of the market, using smoothed Heiken Ashi candles. The coloring system (using bright and dark colors) is an attempt to detect strong market and weak market conditions. There's also an oscillator within the script
These are the features: Alert condition Features: You can now set alerts in the alert dialog for events like trend switch, trend strengthening and weakening; all for both Bullish and Bearish trend.
I also added the code for custom a
FREE

TwoMA Crosses indicator displays arrows based on whether the short term moving average crosses above or below the long term moving average. A moving average doesn't predict price direction. Instead, it defines the current direction. Despite this, investors use moving averages to filter out the noise. Traders and investors tend to use the EMA indicator, especially in a highly volatile market because it’s more sensitive to price changes than the SMA.
Download for FREE TwoMA Crosses EA from the
FREE

ATSCStrategy is a versatile indicator designed for both binary options and forex markets. Empower your trading strategies with this dynamic tool, providing valuable insights for making informed decisions in the fast-paced world of binary options and forex trading.
-Forex Market
-Binary Option Market
-Binary use timeframe 1M - 5M
-Forex use timeframe M30 or high
FREE
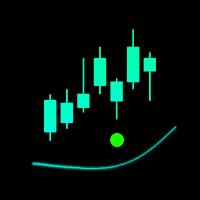
The indicator is designed for fast scalping. The principle of operation of the indicator is based on the direction of the Moving Average.
The period and sensitivity of the Moving Average can be adjusted for yourself in the indicator settings. I recommend watching my advisor - Night Zen EA
Subscribe to my telegram channel, link in my profile contacts. Advantages of the indicator: The free version is full, there are no additional purchases The arrows are not redrawn, the signal comes after co
FREE

This indicator is based on Zigzag. It shows the HH, HL, LL, LH counts. This helps in finding ongoing trends. Or ranges:
Features: Show symbols for: Higher-Highs, Higher-Lows Lower-Lows, Lower-Highs And show counter for each Non-repainting option Customize Color and horizontal/vertical labels Corresponding scanner dashboard: https://www.mql5.com/en/market/product/85346
Symbols Described: HH = Higher-Highs (Current price high is more than previous high) HL = Higher-Lows (Current price low is mo
FREE

The Fisher Transform is a technical indicator created by John F. Ehlers that converts prices into a Gaussian normal distribution. The indicator highlights when prices have moved to an extreme, based on recent prices. This may help in spotting turning points in the price of an asset. It also helps show the trend and isolate the price waves within a trend. The Fisher Transform is a technical indicator that normalizes asset prices, thus making turning points in price clearer. Takeaways Turning poi
FREE
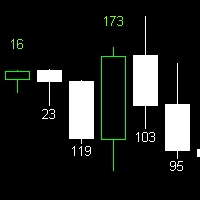
Candle Size Indicator Explore the candle size using this convenient indicator. It works across various timeframes, providing valuable insights for technical analysis. Key Features: Display the size of the candle after configuring the indicator. Compatible with all timeframes. The size of the candle is a significant metric in technical analysis, offering insights into market strength and volatility. This indicator enables clear and accurate visualization of candle sizes on your chart. Utilize thi
FREE

Using multiple timeframes for analysis with Multi Timeframe Average True Range can provide several significant benefits for traders: Comprehensive Market View: By applying Mtf ATR Standard across different timeframes, traders gain a broader perspective on market dynamics. This allows them to identify trends, patterns, and potential reversal points that might be more apparent or consistent across various scales. Enhanced Pattern Recognition: Multiple timeframes help in identifying repeating pat
FREE

The RSI Arrows MTF indicator is based on the RSI indicator. Represents input signals in the form of arrows. It has 6 types of calculation. All signals are generated on the current bar of the selected period.
Signals do not redraw in the first 4 modes! But it is possible to redraw in cases of a sharp change in market movement.
All signals in MTF mode correspond to signals of the period specified in MTF. It is maximally simplified to use both for trading with only one indicator and for using t
FREE
ZonePro Tedarik Talebi, 3 daha yüksek zaman dilimine kadar yeni, test edilmiş, kırılmış, eski ve iç içe geçmiş bölgeleri çizer ve bölgelere dokunulursa, girilirse veya kırılırsa veya ters mum bölgeyi terk ederse Uyarılar gönderir! YENİDEN BOYAMA YOK!
Bölge bilgisi:
Pip boyutu bölge daha yüksek bir zaman diliminde yuvalanmışsa bölgenin test edilip edilmediği ve kaç kez Trend paneli (sol üst):
Size zamanı gösterir Bir sonraki muma kadar süre Genel eğilim Kısa vadeli trend yönü Trendin başl

FIBO DASHBOARD This dashboard lists down multi currency Fibonacci level whenever price hit the level. It draws a Fibonacci Retracement based on daily time frame. It draws arrows, sends pop-up alert and phone notification whenever price crosses Fibonacci levels. This tool is useful for users who trade with Fibonacci. INPUT ON Alert: set to true will pop-up alert whenever arrow appears. ON Push: set to true will send phone notification whenever arrow appears. ON Email:set to true will send email
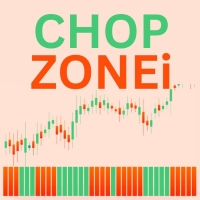
ChopZonei is a custom technical analysis indicator built to help traders identify trend strength and market conditions by calculating the angle of a chosen moving average (MA) over a specified period. The resulting angles are used to classify price action into various "chop zones," which are color-coded based on the direction and magnitude of the angle.
Key Features:
Multi-Timeframe Support: ChopZonei allows the user to calculate the indicator based on a higher timeframe (HTF) while avoiding
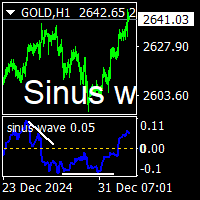
Sinus wave indicator is a extra ordinary oscillator.to find divergency. it works all pairs and all timeframes. suitable for experienced and beginner traders.. indicator works on toward of the prices... while sinus wave go up side that means prices will up. and while sinus wave go down that means prices is going down. it gives divegency when trend reversals. It also gives sell divergency on bear markets there is wave to set default 500. It can be increase depends to charts bars numbers on pictur
Simple alert system which will alert you on your mobile terminal, email and on the chart whenever RSI crosses below the overbought level or above the oversold level. Use this alert system, so you don’t have to watch the chart all day for the RSI levels to break.
INPUTS: 1. RSI Period- (Default is 14). Number of candles the RSI indicator will look back for the calculations. 2. OB Level- (Default is 70). This is the Overbought level or Upper level for the RSI indicator. 3. OS

All about Smart Money Concepts Strategy: Market struture: internal or swing BOS, CHoCH; Orderblock; Liquity equal; Fair Value Gap with Consequent encroachment, Balanced price range; Level with Previous month, week, day level or in day level (PMH, PWH, PDH, HOD); BuySell Stops Liquidity (BSL, SSL); Liquidity Void Long Wicks; Premium and Discount; Candle pattern ... "Smart Money Concepts" ( SMC ) is a fairly new yet widely used term amongst price action traders looking to more accurately navigate
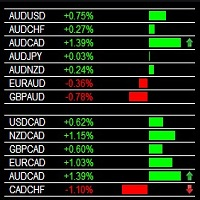
Multi Currency Strength Dashboard Scalper SCALP SIGNALS BASED ON THE ANALYSIS OF THE STRENGTH OF THE CROSS CURRENCY PAIRS- MAKES THE SIGNALS STRONG
Indicator Dashboard- calculates the strength of all markets , currency pairs , commodities . Using a proprietary logic. This data can be used to judge and take decisions whether to buy or sell them. If the particular market is strong means it is bullish , and also the related pair of that market is strong then it will be highly probable that the

ICT Core Content Concepts turned into indicator plus all previous tools known from the Position Smart Indicator . This makes it the Full PSI Private Version ( read more ) restricted up to now but available only after the Mentorship Core Content was made public on YouTube. You will find many price action study tools like: Central Bank Dealing Range - CBDR Asian Range FLOUT Profiles and SD targets on the CBRD, Asian Range and Flout both on the wicks and on the bodies Seek & Destroy Profil

Manh RSICrossingAlert with Alert Indicator is a versatile technical analysis tool that aids traders in identifying market trends and potential entry and exit points. It features a dynamic Manh RSICrossingAlert , adapting to market conditions for a clear visual representation of trend direction. Traders can customize parameters to align with their preferences and risk tolerance. The indicator assists in trend identification, signals potential reversals, serves as a trailing stop mechanism, and p

Enjoy a 50% OFF Christmas holiday sale!
This indicator is unstoppable when combined with our other indicator called Support & Resistance . After purchase, send us a message and you will get it for FREE as a BONUS! Introducing Trend Punch , the revolutionary forex trend indicator that will transform the way you trade! Trend Punch is uniquely designed to provide precise buy and sell arrows during strong market trends, making your trading decisions clearer and more confident. Whether you
The Channel Trade System indicator is an indicator designed to trade with channels. Only by this indicator can be done beautifully by itself. This indicator is composed of moving average and some algorithms.
Features and Suggestions The display has 4 channels. There is one main trend line. The signal line is the thick channel with magenta color. To trade, it is advisable to start with the channel line which is magenta color. A channel calculation setting of 3 to 5 is recommended. the different
Wicks UpDown Target
Choppy movement up and down on the opening range every day. Trading breakouts on London session and New York session is recommended. Wicks UpDown Target is specialized in all forex pairs.
Guideline Entry Strategy Idea:
Step 1 - Breakout Forming (Warning! Trade on London Session and New York Session) Step 2 - Breakout Starting (Take Action on your trading plan) Step 3 - Partial Close your order & set breakeven (no-risk) Step 4 - Target complete Step 5 - Don't trade in Sto
The Advanced Trend Scalper indicator is designed to help both novices and professional traders. The indicator analyses the market and gives you buy and sell signals. It does not use any other indicators, it works only with the market actions. The signal appears right after the candle close and it does not repaint. The efficient algorithm provides a high degree of reliability of such signals. Advanced Trend Scalpe r for the MetaTrader 5 terminal : https://www.mql5.com/en/market/product/3334
Pro Scalping is a comprehensive manual system developed for the most efficient trading at any market conditions on all instruments and time scale.
The system is based on two main blocks:
1. The block of trend determination that calculates dynamic support and resistance. The function of auto-optimization is available for this block.
2. The block of price deviation from its median based on the big set of regressions to get the statistically-valid result. Entry rules For buys:
1. The trend goes

Welcome to Propsense, the best solution for new and veteran traders with a simple FREE strategy! This indicator is a unique and affordable trading tool built on the teachings of a former bank trader. With this tool, you will be able to see inefficient points with ease. As well as this, traders will have an interactive display panel which will show your running and closed P/L in pips AND currency units. It also allows you to set your desired daily target/loss limit! IMPORTANT INFORMATION
Maximi
MetaTrader mağazası, alım-satım robotları ve teknik göstergeler satmak için en iyi yerdir.
MetaTrader platformu için ilgi çekici bir tasarıma ve iyi bir açıklamaya sahip bir uygulama geliştirmeniz yeterlidir. Milyonlarca MetaTrader kullanıcısına sunmak için size ürününüzü Mağazada nasıl yayınlayacağınızı açıklayacağız.
Alım-satım fırsatlarını kaçırıyorsunuz:
- Ücretsiz alım-satım uygulamaları
- İşlem kopyalama için 8.000'den fazla sinyal
- Finansal piyasaları keşfetmek için ekonomik haberler
Kayıt
Giriş yap
Gizlilik ve Veri Koruma Politikasını ve MQL5.com Kullanım Şartlarını kabul edersiniz
Hesabınız yoksa, lütfen kaydolun
MQL5.com web sitesine giriş yapmak için çerezlerin kullanımına izin vermelisiniz.
Lütfen tarayıcınızda gerekli ayarı etkinleştirin, aksi takdirde giriş yapamazsınız.