LiteFinance / Профиль

Онлайн ECN брокер LiteFinance (ex. LiteForex) с 2005 года предоставляет клиентам возможность выхода к глубочайшей ликвидности на валютном, товарном и фондовом рынках. Для торговли через LiteFinance (ex. LiteForex) доступны все основные валютные пары и кросс-курсы, нефть, драгоценные металлы, биржевые индексы, акции корпораций и самый большой набор криптовалютных пар среди брокеров.
Друзья
381
Заявки
Исходящие

LiteFinance
USD/CAD: general review
Current trend
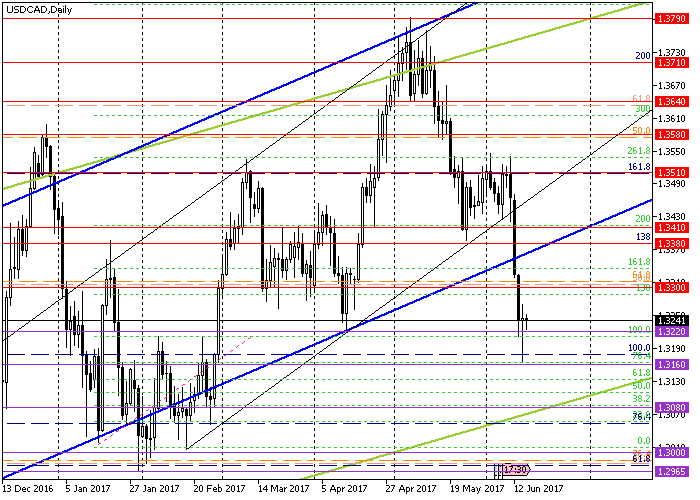
Since the end of the previous week Canadian currency has been actively strengthening against USD due to positive data from the Canadian labor market. Moreover, CAD is supported by the statement of chief deputy chairperson of the Bank of Canada Caroline Wilkins made on Monday, in which the issue of increasing the interest rate was first mentioned. The reaction of the investors was to be expected. At first the pair USD/CAD dropped below the year trend line (blue) and then broke through the level of 1.3300 that is considered an important border between "bullish" and "bearish" tendencies. Yesterday after the decision of FOMC on the interest rate and folow-up press conference USD started to strengthen and the pair USD/CAD to correct.
The data on the unemployment rate (the number of jobless claims is expected to decrease) and industrial activity index by FRB Philadelphia (expected to fall by 14 points) are due at 14:30 (GMT+2). The volume of US industrial output will be published at 15:15 (GMT+2) (the indicator is expected to fall by 0.8%), and the volume of purchases of long-term securities (to decrease by $22.5 bln) —at 22:00 (GMT+2).
The pair is expected to continue consolidation in the next couple of days.
Support and resistance
Support levels: 1.3510, 1.3410, 1.3380, 1.3300.
Resistance levels: 1.3220, 1.3160, 1.3080, 1.3000.
Trading tips
Long positions may be opened at the market price with targets at 1.3300, 1.3380 and stop-loss at 1.3220.
Alternatively sell positions may be opened from the level of 1.3220 with targets at 1.3160, 1.3080 and stop-loss at 1.3280.
The period of implementation is 2 days.
USD/CAD: общий обзор
Текущая динамика
C конца прошлой недели канадская валюта активно укрепляется против доллара США благодаря позитивным данным с рынка труда Канады. Кроме того, «канадца» поддерживает выступление старшего заместителя председателя Банка Канады Каролин Уилкинс в понедельник, в котором впервые за много лет была затронута возможность повышения процентной ставки. Реакция инвесторов была однозначной, и пара USD/CAD сначала упала ниже линии годового тренда (синяя), а потом пробила уровень 1.3300, считающийся важной границей между «бычьей» и «медвежьей» тенденциями. Однако вчера после решения ФРС США по процентной ставке и последующей пресс-конференции американский доллар начал укрепляться, а пара USD/CAD — корректироваться.
Сегодня в 14:30 (GMT+2) выйдут данные по безработице (ожидается снижение числа заявок) и индекс производственной активности от ФРБ Филадельфии (ожидается снижение индекса на 14 пунктов). В 15:15 (GMT+2) будет опубликован объём промышленного производства в США (ожидается падение показателя на 0,8%), а в 22:00 (GMT+2) — объём покупок долгосрочных ценных бумаг (предполагается уменьшение на 22,5 миллиарда долларов США).
В ближайшие два дня предполагается продолжение консолидации пары USD/CAD.
Уровни поддержки и сопротивления
Уровни поддержки: 1.3510, 1.3410, 1.3380, 1.3300.
Уровни сопротивления: 1.3220, 1.3160, 1.3080, 1.3000.
Торговые сценарии
Длинные позиции можно открывать по рыночной цене с целями 1.3300, 1.3380 и стоп-лоссом 1.3220.
Альтернативой является продажа от уровня 1.3220 с целями 1.3160, 1.3080 и стоп-лоссом 1.3280.
Срок реализации составляет 2 дня.
Current trend
Since the end of the previous week Canadian currency has been actively strengthening against USD due to positive data from the Canadian labor market. Moreover, CAD is supported by the statement of chief deputy chairperson of the Bank of Canada Caroline Wilkins made on Monday, in which the issue of increasing the interest rate was first mentioned. The reaction of the investors was to be expected. At first the pair USD/CAD dropped below the year trend line (blue) and then broke through the level of 1.3300 that is considered an important border between "bullish" and "bearish" tendencies. Yesterday after the decision of FOMC on the interest rate and folow-up press conference USD started to strengthen and the pair USD/CAD to correct.
The data on the unemployment rate (the number of jobless claims is expected to decrease) and industrial activity index by FRB Philadelphia (expected to fall by 14 points) are due at 14:30 (GMT+2). The volume of US industrial output will be published at 15:15 (GMT+2) (the indicator is expected to fall by 0.8%), and the volume of purchases of long-term securities (to decrease by $22.5 bln) —at 22:00 (GMT+2).
The pair is expected to continue consolidation in the next couple of days.
Support and resistance
Support levels: 1.3510, 1.3410, 1.3380, 1.3300.
Resistance levels: 1.3220, 1.3160, 1.3080, 1.3000.
Trading tips
Long positions may be opened at the market price with targets at 1.3300, 1.3380 and stop-loss at 1.3220.
Alternatively sell positions may be opened from the level of 1.3220 with targets at 1.3160, 1.3080 and stop-loss at 1.3280.
The period of implementation is 2 days.
USD/CAD: общий обзор
Текущая динамика
C конца прошлой недели канадская валюта активно укрепляется против доллара США благодаря позитивным данным с рынка труда Канады. Кроме того, «канадца» поддерживает выступление старшего заместителя председателя Банка Канады Каролин Уилкинс в понедельник, в котором впервые за много лет была затронута возможность повышения процентной ставки. Реакция инвесторов была однозначной, и пара USD/CAD сначала упала ниже линии годового тренда (синяя), а потом пробила уровень 1.3300, считающийся важной границей между «бычьей» и «медвежьей» тенденциями. Однако вчера после решения ФРС США по процентной ставке и последующей пресс-конференции американский доллар начал укрепляться, а пара USD/CAD — корректироваться.
Сегодня в 14:30 (GMT+2) выйдут данные по безработице (ожидается снижение числа заявок) и индекс производственной активности от ФРБ Филадельфии (ожидается снижение индекса на 14 пунктов). В 15:15 (GMT+2) будет опубликован объём промышленного производства в США (ожидается падение показателя на 0,8%), а в 22:00 (GMT+2) — объём покупок долгосрочных ценных бумаг (предполагается уменьшение на 22,5 миллиарда долларов США).
В ближайшие два дня предполагается продолжение консолидации пары USD/CAD.
Уровни поддержки и сопротивления
Уровни поддержки: 1.3510, 1.3410, 1.3380, 1.3300.
Уровни сопротивления: 1.3220, 1.3160, 1.3080, 1.3000.
Торговые сценарии
Длинные позиции можно открывать по рыночной цене с целями 1.3300, 1.3380 и стоп-лоссом 1.3220.
Альтернативой является продажа от уровня 1.3220 с целями 1.3160, 1.3080 и стоп-лоссом 1.3280.
Срок реализации составляет 2 дня.
LiteFinance
GBP/USD: general review
Current trend
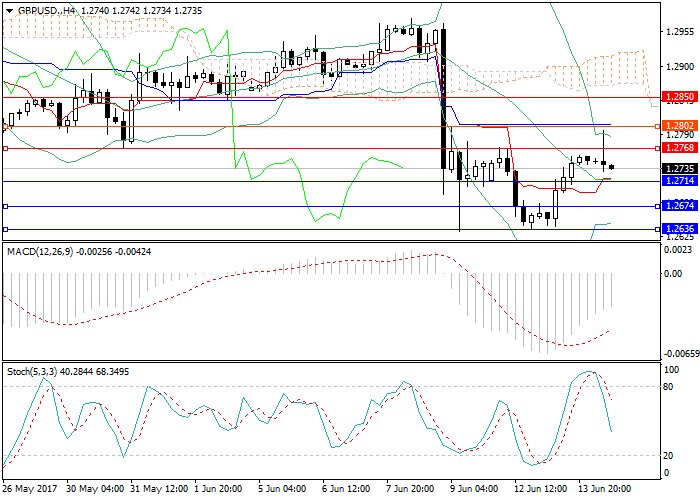
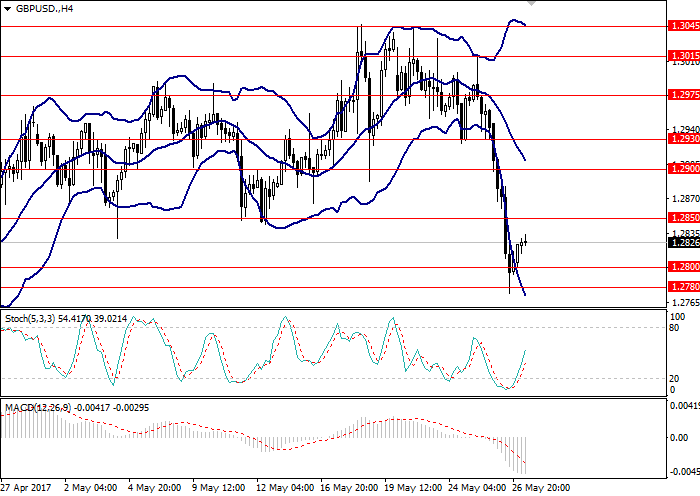
The rate of GBP/USD continues to gradually strengthen and has already reached the level of 1.2800, but failed to consolidate above it.
After the release of mixed statistics pon the UK labor market the rate moved downward. Jobless Claims were better than expected and decreased to 7.3K in May from 22K a month earlier. Average salary was worse than expected: the growth of the indicator slowed down to 2.1% in April against 2.3% a month earlier. Investors reacted to this news with the sales of the British currency.
After the release of statistics from the UK the main macroeconomic event of the day will be the decision of FOMC on the interest rate followed by comments on the fiscal policy. Market participants expect FOMC to increase the interest rate at its meeting by 0.25 percentage points t 1.25%. Thus, the fact of the rate's increase has already been included into the current USD rate.
If the rate is increased, US dollar will receive support in the short term which will lead to the reduction of GBP/USD rate. If FOMC decides not to increase the rate, or if follow-up comments of its head show cautious or pessimistic attitude to the prospects of the US economy (level of unemployment, inflation), investors will start to sell USD which would lead to the growth of GBP/USD rate.
Support and resistance
Technical indicators don't provide a clear signal. Bollinger Bands are directed sidewards indicating lateral movement. MACD histogram is reducing in the negative zone reacting to the recent growth of the rate but does not provide a clear signal. Stochastic is directed downwards indicating the increasing influence of sellers.
Support levels: 1.2714, 1.2674, 1.2636.
Resistance levels: 1.2768, 1.2802, 1.2850.
Trading tips
Sell positions may be opened below 1.2714 with targets at 1.2674-1.2636 at stop-loss at 1.2740.
Buy positions may be opened above the level of 1.2768 with targets at 1.2802, 1.2850 and stop-loss at 1.2745.
GBP/USD: общий обзор
Текущая динамика
Курс GBP/USD продолжает постепенно укрепляться и уже подобрался к уровню сопротивления 1.2800, однако закрепиться выше него так не сумел. После выхода смешанной статистики по рынку труда Великобритании котировки направились вниз. Заявки на пособия по безработице оказались лучше прогнозов и сократились до 7,3 тысяч в мае с 22 тысяч месяцем ранее. Средняя заработная плата оказалась хуже прогнозов: рост показателя замедлился до 2,1% в апреле против 2,3% месяцем ранее. Инвесторы отреагировали на такие данные продажами британской валюты.
После выхода статистики из Великобритании главным макроэкономическим событием дня будет решение ФРС США по процентной ставке и следующие за ним комментарии по денежно-кредитной политике. Участники рынка ожидают, что регулятор поднимет процентную ставку на очередном заседании на 0,25 процентных пункта до уровня 1,25%, что уже во многом заложено в текущем курсе американской валюты.
Если ставка будет повышена, то доллар США получит поддержку в краткосрочной перспективе, что приведет к снижению курса GBP/USD. Если ФРС США все-таки не пойдет на повышение ставки, или последующие за публикацией решения комментарии главы регулятора отразят осторожный или пессимистичный настрой относительно перспектив американской экономики (уровень безработицы, инфляция), то инвесторы начнут продавать доллары, что, в свою очередь, приведет к росту курса GBP/USD.
Уровни поддержки и сопротивления
Технические индикаторы не дают однозначного сигнала. Полосы Боллинджера направлены в сторону, указывая на боковое движение курса. Гистограмма MACD сокращается в отрицательной зоне, отрабатывая недавний рост курса, однако четкого сигнала не дает. Стохастик направлен вниз, указывая на нарастающее влияние продавцов.
Уровни поддержки: 1.2714, 1.2674, 1.2636.
Уровни сопротивления: 1.2768, 1.2802, 1.2850.
Торговые сценарии
Позиции на продажу можно открывать ниже уровня 1.2714 с целями в районе 1.2674-1.2636 и стоп-лоссом на уровне 1.2740.
Позиции на покупку можно открывать выше уровня 1.2768 с целями в районе 1.2802, 1.2850 и стоп-лоссом на уровне 1.2745.
Current trend
The rate of GBP/USD continues to gradually strengthen and has already reached the level of 1.2800, but failed to consolidate above it.
After the release of mixed statistics pon the UK labor market the rate moved downward. Jobless Claims were better than expected and decreased to 7.3K in May from 22K a month earlier. Average salary was worse than expected: the growth of the indicator slowed down to 2.1% in April against 2.3% a month earlier. Investors reacted to this news with the sales of the British currency.
After the release of statistics from the UK the main macroeconomic event of the day will be the decision of FOMC on the interest rate followed by comments on the fiscal policy. Market participants expect FOMC to increase the interest rate at its meeting by 0.25 percentage points t 1.25%. Thus, the fact of the rate's increase has already been included into the current USD rate.
If the rate is increased, US dollar will receive support in the short term which will lead to the reduction of GBP/USD rate. If FOMC decides not to increase the rate, or if follow-up comments of its head show cautious or pessimistic attitude to the prospects of the US economy (level of unemployment, inflation), investors will start to sell USD which would lead to the growth of GBP/USD rate.
Support and resistance
Technical indicators don't provide a clear signal. Bollinger Bands are directed sidewards indicating lateral movement. MACD histogram is reducing in the negative zone reacting to the recent growth of the rate but does not provide a clear signal. Stochastic is directed downwards indicating the increasing influence of sellers.
Support levels: 1.2714, 1.2674, 1.2636.
Resistance levels: 1.2768, 1.2802, 1.2850.
Trading tips
Sell positions may be opened below 1.2714 with targets at 1.2674-1.2636 at stop-loss at 1.2740.
Buy positions may be opened above the level of 1.2768 with targets at 1.2802, 1.2850 and stop-loss at 1.2745.
GBP/USD: общий обзор
Текущая динамика
Курс GBP/USD продолжает постепенно укрепляться и уже подобрался к уровню сопротивления 1.2800, однако закрепиться выше него так не сумел. После выхода смешанной статистики по рынку труда Великобритании котировки направились вниз. Заявки на пособия по безработице оказались лучше прогнозов и сократились до 7,3 тысяч в мае с 22 тысяч месяцем ранее. Средняя заработная плата оказалась хуже прогнозов: рост показателя замедлился до 2,1% в апреле против 2,3% месяцем ранее. Инвесторы отреагировали на такие данные продажами британской валюты.
После выхода статистики из Великобритании главным макроэкономическим событием дня будет решение ФРС США по процентной ставке и следующие за ним комментарии по денежно-кредитной политике. Участники рынка ожидают, что регулятор поднимет процентную ставку на очередном заседании на 0,25 процентных пункта до уровня 1,25%, что уже во многом заложено в текущем курсе американской валюты.
Если ставка будет повышена, то доллар США получит поддержку в краткосрочной перспективе, что приведет к снижению курса GBP/USD. Если ФРС США все-таки не пойдет на повышение ставки, или последующие за публикацией решения комментарии главы регулятора отразят осторожный или пессимистичный настрой относительно перспектив американской экономики (уровень безработицы, инфляция), то инвесторы начнут продавать доллары, что, в свою очередь, приведет к росту курса GBP/USD.
Уровни поддержки и сопротивления
Технические индикаторы не дают однозначного сигнала. Полосы Боллинджера направлены в сторону, указывая на боковое движение курса. Гистограмма MACD сокращается в отрицательной зоне, отрабатывая недавний рост курса, однако четкого сигнала не дает. Стохастик направлен вниз, указывая на нарастающее влияние продавцов.
Уровни поддержки: 1.2714, 1.2674, 1.2636.
Уровни сопротивления: 1.2768, 1.2802, 1.2850.
Торговые сценарии
Позиции на продажу можно открывать ниже уровня 1.2714 с целями в районе 1.2674-1.2636 и стоп-лоссом на уровне 1.2740.
Позиции на покупку можно открывать выше уровня 1.2768 с целями в районе 1.2802, 1.2850 и стоп-лоссом на уровне 1.2745.
LiteFinance
GBP/USD: general review
Current trend
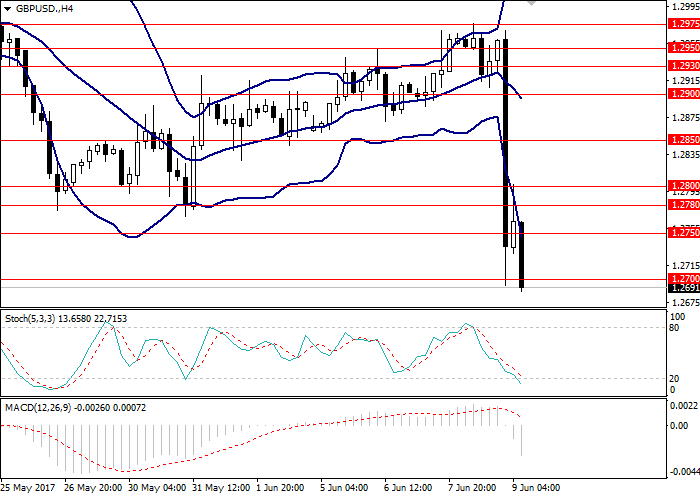
The pound fell by over 200 points against US dollar in view of release of exit polls data. According to them, the possibility that the Concervative Party may lose its absolute majority in the Parliament remained. Prime Minister Theresa May called for an early election hoping to get far bigger advantage, and the results of the election were truly shocking. Thus, according to recent BBC data, the conservatives are expected to get 318 places out of 650, and the Labor Party is to receive 267 places. The Brexit process becomes even more uncertain now which will add risks for the pound in the short and medium term.
The main item of the agenda today is the results of the UK election. After the release of the official data the market is expected to become volatile.
Support and resistance
Support levels: 1.2700.
Resistance levels: 1.2750, 1.2780, 1.2800, 1.2850.
Trading tips
Short positions may be opened from the level of 1.2670 with target at 1.2600 and stop-loss at 1.2700.
Long positions may be opened from the level of 1.2780 with target at 1.2850 and stop-loss at 1.2750.
The period of implementation is 1-2 days.
GBP/USD: общий анализ
Текущая динамика
Фунт потерял более чем на 200 пунктов по отношению к доллару США на фоне публикации данных экзит-полов, согласно которым сохранялась вероятность потери консервативной партией абсолютного большинства в парламенте.
Премьер-министр Тереза Мэй призывала к досрочным выборам в надежде получить куда более весомое большинство, и предварительные результаты выборов оказались поистине шокирующими. Так, по последним данным BBC, ожидается, что консерваторы получат 318 из 650 мест в парламенте, а лейбористская партия набирает 267 мест. Процесс выхода из ЕС теперь также под большим вопросом, что очевидно повысит риск и добавит неопределённость для фунта в краткосрочной и среднесрочной перспективе.
Главной темой в повестке дня сегодня остаются результаты парламентских выборов в Великобритании. С поступлением официальных данных на рынке ожидаются всплески волатильности.
Уровни поддержки и сопротивления
Уровни поддержки: 1.2700.
Уровни сопротивления: 1.2750, 1.2780, 1.2800, 1.2850.
Торговые сценарии
Открывать короткие позиции можно от уровня 1.2670 с целью 1.2600 и стоп-лоссом 1.2700.
Открывать длинные позиции можно от уровня 1.2780 с целью 1.2850 и стоп-лоссом на уровне 1.2750.
Срок реализации составляет 1-2 дня.
Current trend
The pound fell by over 200 points against US dollar in view of release of exit polls data. According to them, the possibility that the Concervative Party may lose its absolute majority in the Parliament remained. Prime Minister Theresa May called for an early election hoping to get far bigger advantage, and the results of the election were truly shocking. Thus, according to recent BBC data, the conservatives are expected to get 318 places out of 650, and the Labor Party is to receive 267 places. The Brexit process becomes even more uncertain now which will add risks for the pound in the short and medium term.
The main item of the agenda today is the results of the UK election. After the release of the official data the market is expected to become volatile.
Support and resistance
Support levels: 1.2700.
Resistance levels: 1.2750, 1.2780, 1.2800, 1.2850.
Trading tips
Short positions may be opened from the level of 1.2670 with target at 1.2600 and stop-loss at 1.2700.
Long positions may be opened from the level of 1.2780 with target at 1.2850 and stop-loss at 1.2750.
The period of implementation is 1-2 days.
GBP/USD: общий анализ
Текущая динамика
Фунт потерял более чем на 200 пунктов по отношению к доллару США на фоне публикации данных экзит-полов, согласно которым сохранялась вероятность потери консервативной партией абсолютного большинства в парламенте.
Премьер-министр Тереза Мэй призывала к досрочным выборам в надежде получить куда более весомое большинство, и предварительные результаты выборов оказались поистине шокирующими. Так, по последним данным BBC, ожидается, что консерваторы получат 318 из 650 мест в парламенте, а лейбористская партия набирает 267 мест. Процесс выхода из ЕС теперь также под большим вопросом, что очевидно повысит риск и добавит неопределённость для фунта в краткосрочной и среднесрочной перспективе.
Главной темой в повестке дня сегодня остаются результаты парламентских выборов в Великобритании. С поступлением официальных данных на рынке ожидаются всплески волатильности.
Уровни поддержки и сопротивления
Уровни поддержки: 1.2700.
Уровни сопротивления: 1.2750, 1.2780, 1.2800, 1.2850.
Торговые сценарии
Открывать короткие позиции можно от уровня 1.2670 с целью 1.2600 и стоп-лоссом 1.2700.
Открывать длинные позиции можно от уровня 1.2780 с целью 1.2850 и стоп-лоссом на уровне 1.2750.
Срок реализации составляет 1-2 дня.
LiteFinance
YM: general review
Current trend
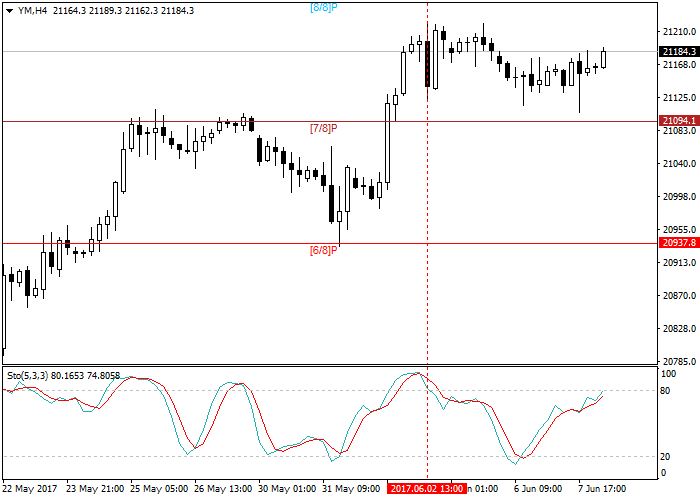
Dow Jones continues to trade near historical maximums: 21223.2 or 8/8 Murrey. Breaking through and consolidation above this level will open it the way to 21250.4. In the near future a vote on the Financial Choice Act project may take place. The purpose of the project is to reduce the level of regulation of the US baning system and reserve requirements for commercial banks. If the project is passed, the market may experience excessive liquidity which in the end may positively influence the stock market.
The second event that may impact stock markets all over the world is the UK parliamentary election. According to the initial data, the majority of places in the Parliament is to be taken by the Conservative Party under the leadership of Theresa May. However due to terrorist attacks the gap between them and other parties (namely the Labor Party) is narrowing.
Initial and secondary jobless claims are also to be publised in the USA. A slight drop by approximately 8 thousand is expected.
Support and resistance
Stochastic is reaching the level of 80 points or the overbought zone and signals about possible correction. Short positions may be opened only in case the lower support level of 7/8 Murrey or 21094.1 is broken through.
Support levels: 21094.1.
Resistance levels: 21223.2.
Trading tips
Short positions may be opened from the level of 21094.1 with targets at 20937.8 and stop-loss at 21223.2.
YM: общий анализ
Текущая динамика
Индекс Dow Jones продолжает торговаться вблизи исторических максимумов: 21223.2 или 8/8 Мюррея. Пробой и закрепление выше данной отметки откроет дорогу к цели 21250.4. Существует вероятность вероятность, что в ближайшее время может состояться голосование по проекту Financial Choice Act, цель которого состоит в сокращении регулирования банковской системы США и уменьшении требований к резервам среди коммерческих банков. Если проект будет принят, то на рынке может появиться избыточная ликвидность, что в конечном итоге может оказать положительное влияние и на фондовый рынок.
Вторым событием, которое может повлиять на фондовые рынки по всему миру, являются парламентские выборы в Великобритании. По предварительным данным, большинство мест в Палате общин достанется консервативной партии под руководством Терезы Мей. Однако в связи с недавними терактами отрыв от других партий (в частности, от лейбористов) сокращается.
В США также будут опубликованы повторные и первичные заявки на пособие по безработице. Ожидается небольшой спад, приблизительно на 8 тысяч.
Уровни поддержки и сопротивления
Стохастик приближается к отметке 80 пунктов или к зоне перекупленности и сигнализирует о возможной коррекции. Открывать короткие позиции можно только при пробое нижнего уровня поддержки 7/8 Мюррея или 21094.1
Уровни поддержки: 21094.1.
Уровни сопротивления: 21223.2.
Торговые сценарии
Открывать короткие позиции можно от уровня 21094.1 с целью 20937.8 и стоп-лоссом в районе 21223.2.
Current trend
Dow Jones continues to trade near historical maximums: 21223.2 or 8/8 Murrey. Breaking through and consolidation above this level will open it the way to 21250.4. In the near future a vote on the Financial Choice Act project may take place. The purpose of the project is to reduce the level of regulation of the US baning system and reserve requirements for commercial banks. If the project is passed, the market may experience excessive liquidity which in the end may positively influence the stock market.
The second event that may impact stock markets all over the world is the UK parliamentary election. According to the initial data, the majority of places in the Parliament is to be taken by the Conservative Party under the leadership of Theresa May. However due to terrorist attacks the gap between them and other parties (namely the Labor Party) is narrowing.
Initial and secondary jobless claims are also to be publised in the USA. A slight drop by approximately 8 thousand is expected.
Support and resistance
Stochastic is reaching the level of 80 points or the overbought zone and signals about possible correction. Short positions may be opened only in case the lower support level of 7/8 Murrey or 21094.1 is broken through.
Support levels: 21094.1.
Resistance levels: 21223.2.
Trading tips
Short positions may be opened from the level of 21094.1 with targets at 20937.8 and stop-loss at 21223.2.
YM: общий анализ
Текущая динамика
Индекс Dow Jones продолжает торговаться вблизи исторических максимумов: 21223.2 или 8/8 Мюррея. Пробой и закрепление выше данной отметки откроет дорогу к цели 21250.4. Существует вероятность вероятность, что в ближайшее время может состояться голосование по проекту Financial Choice Act, цель которого состоит в сокращении регулирования банковской системы США и уменьшении требований к резервам среди коммерческих банков. Если проект будет принят, то на рынке может появиться избыточная ликвидность, что в конечном итоге может оказать положительное влияние и на фондовый рынок.
Вторым событием, которое может повлиять на фондовые рынки по всему миру, являются парламентские выборы в Великобритании. По предварительным данным, большинство мест в Палате общин достанется консервативной партии под руководством Терезы Мей. Однако в связи с недавними терактами отрыв от других партий (в частности, от лейбористов) сокращается.
В США также будут опубликованы повторные и первичные заявки на пособие по безработице. Ожидается небольшой спад, приблизительно на 8 тысяч.
Уровни поддержки и сопротивления
Стохастик приближается к отметке 80 пунктов или к зоне перекупленности и сигнализирует о возможной коррекции. Открывать короткие позиции можно только при пробое нижнего уровня поддержки 7/8 Мюррея или 21094.1
Уровни поддержки: 21094.1.
Уровни сопротивления: 21223.2.
Торговые сценарии
Открывать короткие позиции можно от уровня 21094.1 с целью 20937.8 и стоп-лоссом в районе 21223.2.
LiteFinance
EUR/USD: general review
Current trend
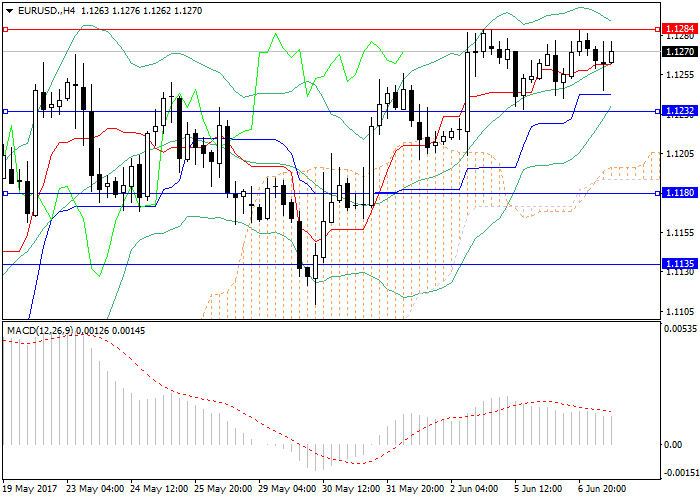
Due to the empty macroecnomic calendar market participants continued to act based on the negative labor market statistics and to sell the US currency. As a result the pair EUR/USD rose to the resistance level of 1.1284. After multiple tests of this level trading moved to the side channel. The traders are waiting for the ECB fiscal policy meeting and the results of parliamentary election in the UK and do not open major positions. If ECB increases its economic forecatrs, the rate of EUR/USD will continue to increase. If the rhetorics of the European regulator appears to be mild, one may expect the rate of EUR/USD to decrease.
Support and resistance
Technical indicators confirm the lateral tendency: Bollinger Bands are directed sidewards; MACD histogram is in the positive zone and moving alon the zero line.
Support levels: 1.1232, 1.1180, 1.1135.
Resistance levels: 1.1284, 1.1324, 1.1381.
Trading tips
Sell positions may be opened below 1.1232 with targets at 1.1180, 1.1135 at stop-loss at 1.1265.
Buy positions may be opened above 1.1284 with targets at 1.1324, 1.1381 and stop-loss at 1.1254.
EUR/USD: общий обзор
Текущая динамика
На фоне пустого макроэкономического календаря участники рынка продолжали отыгрывать негативную статистику по рынку труда и продавали американскую валюту. В результате пара EUR/USD поднялась к уровню сопротивления 1.1284. После неоднократного теста этого уровня торговля перешла в боковой канал.
Участники рынка в ожидании заседания ЕЦБ по денежно-кредитной политике и итогов парламентского голосования в Великобритании не спешат открывать крупные позиции. Если ЕЦБ повысит свой экономический прогноз, то курс EUR/USD возобновит восходящее движение. Если риторика европейского регулятора окажется преимущественно мягкой, то стоит ждать снижения курса EUR/USD.
Уровни поддержки и сопротивления
Технические индикаторы подтверждают боковую тенденцию: полосы Боллинджера направлены вбок; гистограмма MACD находится в положительной зоне и движется вдоль нулевой линии.
Уровни поддержки: 1.1232, 1.1180, 1.1135.
Уровни сопротивления: 1.1284, 1.1324, 1.1381.
Торговые сценарии
Позиции на продажу можно открывать ниже уровня 1.1232 с целями в районе 1.1180, 1.1135 и стоп-лоссом на уровне 1.1265.
Позиции на покупку можно открывать выше уровня 1.1284 с целями в районе 1.1324, 1.1381 и стоп-лоссом на уровне 1.1254.
Current trend
Due to the empty macroecnomic calendar market participants continued to act based on the negative labor market statistics and to sell the US currency. As a result the pair EUR/USD rose to the resistance level of 1.1284. After multiple tests of this level trading moved to the side channel. The traders are waiting for the ECB fiscal policy meeting and the results of parliamentary election in the UK and do not open major positions. If ECB increases its economic forecatrs, the rate of EUR/USD will continue to increase. If the rhetorics of the European regulator appears to be mild, one may expect the rate of EUR/USD to decrease.
Support and resistance
Technical indicators confirm the lateral tendency: Bollinger Bands are directed sidewards; MACD histogram is in the positive zone and moving alon the zero line.
Support levels: 1.1232, 1.1180, 1.1135.
Resistance levels: 1.1284, 1.1324, 1.1381.
Trading tips
Sell positions may be opened below 1.1232 with targets at 1.1180, 1.1135 at stop-loss at 1.1265.
Buy positions may be opened above 1.1284 with targets at 1.1324, 1.1381 and stop-loss at 1.1254.
EUR/USD: общий обзор
Текущая динамика
На фоне пустого макроэкономического календаря участники рынка продолжали отыгрывать негативную статистику по рынку труда и продавали американскую валюту. В результате пара EUR/USD поднялась к уровню сопротивления 1.1284. После неоднократного теста этого уровня торговля перешла в боковой канал.
Участники рынка в ожидании заседания ЕЦБ по денежно-кредитной политике и итогов парламентского голосования в Великобритании не спешат открывать крупные позиции. Если ЕЦБ повысит свой экономический прогноз, то курс EUR/USD возобновит восходящее движение. Если риторика европейского регулятора окажется преимущественно мягкой, то стоит ждать снижения курса EUR/USD.
Уровни поддержки и сопротивления
Технические индикаторы подтверждают боковую тенденцию: полосы Боллинджера направлены вбок; гистограмма MACD находится в положительной зоне и движется вдоль нулевой линии.
Уровни поддержки: 1.1232, 1.1180, 1.1135.
Уровни сопротивления: 1.1284, 1.1324, 1.1381.
Торговые сценарии
Позиции на продажу можно открывать ниже уровня 1.1232 с целями в районе 1.1180, 1.1135 и стоп-лоссом на уровне 1.1265.
Позиции на покупку можно открывать выше уровня 1.1284 с целями в районе 1.1324, 1.1381 и стоп-лоссом на уровне 1.1254.
LiteFinance
NZD/USD: weak US stats push the pair up
Current trend
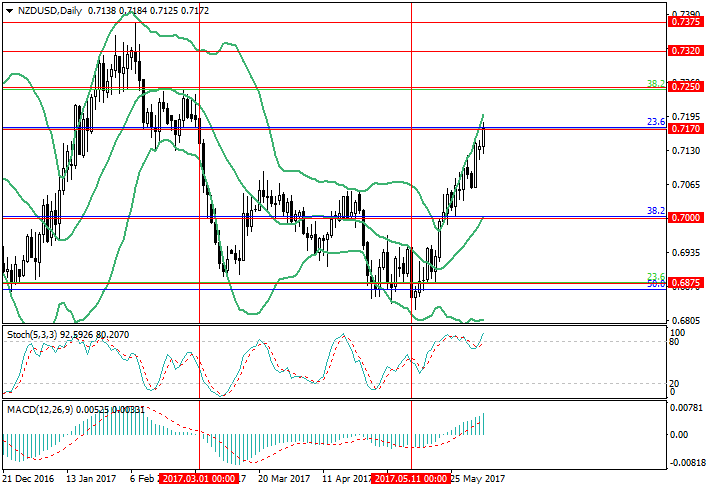
The pair is growing for the fourth week and by now has reached a maximum value in the region of 0.7170. The US currency was seriously weakened by recent negative statistics: the number of new jobs fell to 138 thousand. On Monday, unconvincing data showed the US business activity index in the non-industrial sector, which in March was worse than forecasted and amounted to 56.9 points. The deterioration of US statistics may slow the rate hike. On the other hand, the general support for New Zealand currency is provided by the milk prices: according to the Global Dairy Trade auction, a stable growth of over 3% has been observed for 6 weeks. In addition, the corporate news strengthen “kiwi”: one of the largest dairy producers in Australia Murray Goulburn was forced to close part of the production and cut 360 jobs, which plays into the hands of the New Zealand company Fonterra, which holds about 30% of world exports of dairy products and providing significant income to the budget of New Zealand.
Support and resistance
In technical terms, the price is testing the 0.7170 level (Fibonacci correction of 23.6%) and, in case of break through it can continue to rise to the levels of 0.7250, 0.7320, 0.7375 (annual highs). On the other hand, Stochastic's entry into the overbought zone indicates a possible downward correction to the mid-range of the Bollinger bands and Fibo’s 38.2% – to the 0.7000 level.
Support levels: 0.7000, 0.6875, 0.6800.
Resistance levels: 0.7170, 0.7250, 0.7320, 0.7375.
Trading tips
In this situation, long positions can be opened above the level of 0.7170 with targets of 0.7250 and 0.7320 and stop-loss order at 0.7140. With the rebound of the price from the level of 0.7170, short positions with the target of 0.7000 and stop-loss order 0.7170 will become relevant.
NZD/USD: слабая статистика из США толкает пару вверх
Текущая динамика
Пара растёт уже четвёртую неделю и к настоящему моменту достигла максимального значения в районе 0.7170. Американскую валюту серьёзно ослабила недавняя негативная статистика: показатель количества новых рабочих мест снизился до 138 тысяч. В понедельник неубедительные данные продемонстрировал американский индекс деловой активности в производственном секторе, который в марте оказался хуже прогнозов и составил 56,9 пункта. Ухудшение американской статистики может затормозить повышение процентной ставки. С другой стороны, общую поддержку новозеландской валюте оказывает повышение цен на молоко: по данным аукциона Global Dairy Trade в течение 6 недель наблюдается стабильный рост выше 3%. Кроме того, усиливают позиции «киви» и корпоративные новости: один из крупнейших производителей молочной продукции в Австралии Murray Goulburn продолжает испытывать проблемы и вынужден закрыть часть производства и сократить 360 рабочих мест, что играет на руку новозеландской компании Fonterra, удерживающей около 30% мирового экспорта молочных продуктов и обеспечивающей значительный доход бюджету Новой Зеландии.
Уровни поддержки и сопротивления
В техническом плане цена тестирует отметку 0.7170 (коррекция Фибоначчи 23,6%) и при её пробое может продолжить рост к отметкам 0.7250, 0.7320, 0.7375 (годовые максимумы). С другой стороны, вход Стохастика в зону перекупленности говорит о возможной нисходящей коррекции в район средней линии полос Боллинджера и коррекции 38,2% — к отметке 0.7000.
Уровни поддержки: 0.7000, 0.6875, 0.6800.
Уровни сопротивления: 0.7170, 0.7250, 0.7320, 0.7375.
Торговые сценарии
В сложившейся ситуации длинные позиции можно будет открывать выше отметки 0.7170 с целями 0.7250 и 0.7320 и защитным приказом 0.7140. При отскоке цены от отметки 0.7170 и закреплении её в районе 0.7130 актуальными станут короткие позиции с целью 0.7000 и защитным приказом 0.7170.
Current trend
The pair is growing for the fourth week and by now has reached a maximum value in the region of 0.7170. The US currency was seriously weakened by recent negative statistics: the number of new jobs fell to 138 thousand. On Monday, unconvincing data showed the US business activity index in the non-industrial sector, which in March was worse than forecasted and amounted to 56.9 points. The deterioration of US statistics may slow the rate hike. On the other hand, the general support for New Zealand currency is provided by the milk prices: according to the Global Dairy Trade auction, a stable growth of over 3% has been observed for 6 weeks. In addition, the corporate news strengthen “kiwi”: one of the largest dairy producers in Australia Murray Goulburn was forced to close part of the production and cut 360 jobs, which plays into the hands of the New Zealand company Fonterra, which holds about 30% of world exports of dairy products and providing significant income to the budget of New Zealand.
Support and resistance
In technical terms, the price is testing the 0.7170 level (Fibonacci correction of 23.6%) and, in case of break through it can continue to rise to the levels of 0.7250, 0.7320, 0.7375 (annual highs). On the other hand, Stochastic's entry into the overbought zone indicates a possible downward correction to the mid-range of the Bollinger bands and Fibo’s 38.2% – to the 0.7000 level.
Support levels: 0.7000, 0.6875, 0.6800.
Resistance levels: 0.7170, 0.7250, 0.7320, 0.7375.
Trading tips
In this situation, long positions can be opened above the level of 0.7170 with targets of 0.7250 and 0.7320 and stop-loss order at 0.7140. With the rebound of the price from the level of 0.7170, short positions with the target of 0.7000 and stop-loss order 0.7170 will become relevant.
NZD/USD: слабая статистика из США толкает пару вверх
Текущая динамика
Пара растёт уже четвёртую неделю и к настоящему моменту достигла максимального значения в районе 0.7170. Американскую валюту серьёзно ослабила недавняя негативная статистика: показатель количества новых рабочих мест снизился до 138 тысяч. В понедельник неубедительные данные продемонстрировал американский индекс деловой активности в производственном секторе, который в марте оказался хуже прогнозов и составил 56,9 пункта. Ухудшение американской статистики может затормозить повышение процентной ставки. С другой стороны, общую поддержку новозеландской валюте оказывает повышение цен на молоко: по данным аукциона Global Dairy Trade в течение 6 недель наблюдается стабильный рост выше 3%. Кроме того, усиливают позиции «киви» и корпоративные новости: один из крупнейших производителей молочной продукции в Австралии Murray Goulburn продолжает испытывать проблемы и вынужден закрыть часть производства и сократить 360 рабочих мест, что играет на руку новозеландской компании Fonterra, удерживающей около 30% мирового экспорта молочных продуктов и обеспечивающей значительный доход бюджету Новой Зеландии.
Уровни поддержки и сопротивления
В техническом плане цена тестирует отметку 0.7170 (коррекция Фибоначчи 23,6%) и при её пробое может продолжить рост к отметкам 0.7250, 0.7320, 0.7375 (годовые максимумы). С другой стороны, вход Стохастика в зону перекупленности говорит о возможной нисходящей коррекции в район средней линии полос Боллинджера и коррекции 38,2% — к отметке 0.7000.
Уровни поддержки: 0.7000, 0.6875, 0.6800.
Уровни сопротивления: 0.7170, 0.7250, 0.7320, 0.7375.
Торговые сценарии
В сложившейся ситуации длинные позиции можно будет открывать выше отметки 0.7170 с целями 0.7250 и 0.7320 и защитным приказом 0.7140. При отскоке цены от отметки 0.7170 и закреплении её в районе 0.7130 актуальными станут короткие позиции с целью 0.7000 и защитным приказом 0.7170.
LiteFinance
USD/CAD: general analysis
Current trend
The Canadian dollar fell last week against the US dollar, despite the fact that the data on Canadian GDP came out much better than expected. Nevertheless, the significant fall in oil prices, which reached a three-week low last week, and the strengthening of the US dollar up until Friday weakened the Canadian currency; and the pair USD/CAD was growing.
However, the trend line zone (blue) close to the resistance area of 1.3550 once again showed its strength, and the pair was corrected downwards. The correction of the pair also had a fundamental reason – the Friday data of the US labor market, which turned out to be worse than the forecast.
At the beginning of this week important indicators are going to be released: productivity level in the non-agricultural sector of the USA (14:30 GMT+2), it is expected to grow by 0.4%; the index of business activity and the index of activity in the US services sector (15:45 GMT+2); the index of business activity in the non-manufacturing sector (PMI) of the US at 16:00 (GMT+2) (the forecast promises a decrease in the index by 0.5 points). Tomorrow, at 16:00 (GMT+2), the index of business activity in Canada will be published.
We can hardly expect a rapid return of investor confidence after their disappointment with the US dollar on Friday, therefore, for the next two days we expect the consolidation of the pair.
Support and resistance
Support levels: 1.3450, 1.3400, 1.3315, 1.3260.
Resistance levels: 1.3535, 1.3600, 1.3700, 1.3790.
Trading scenario
Short positions should be opened at the market price with the targets of 1.3400, 1.3315 and stop-loss at 1.3540.
An alternative scenario would be to buy at 1.3535 with targets of 1.3600, 1.3700 and stop-loss at 1.3470.
Implementation time: 1-2 days.
USD/CAD: общий анализ
Текущая динамика
Канадский доллар на прошлой неделе падал против американского, несмотря на то, что данные по ВВП Канады вышли значительно лучше ожиданий. Тем не менее, значительное падение цен на нефть, которая достигла трёхнедельного минимума на прошлой неделе, и укрепление доллара США, происходившее вплоть до пятницы, ослабили канадскую валюту, и пара USD/CAD росла.
Однако зона линии тренда (синяя), в районе сопротивления 1.3550, в очередной раз показала свою силу, и пара скорректировалась вниз. Начало коррекции пары имеет также фундаментальную причину — пятничные данные рынка труда США, оказавшееся хуже прогноза.
Начало текущей недели сопровождается выходом важных показателей: уровень производительности в несельскохозяйственном секторе США (14:30 GMT+2), ожидается его рост на 0,4%; индекс деловой активности и индекс активности в сфере услуг США (15:45 GMT+2); индекс деловой активности в непроизводственном секторе (PMI) США в 16:00 (GMT+2) (прогноз предполагает уменьшение индекса на 0,5 пункта). Завтра, в 16:00 (GMT+2), выйдет индекс деловой активности в Канаде.
Вряд ли стоит ожидать быстрого возвращения уверенности инвесторов, после их разочарования долларом США в пятницу, потому на ближайшие два дня предполагаем продолжение консолидации пары.
Уровни поддержки и сопротивления
Уровни поддержки: 1.3450, 1.3400, 1.3315, 1.3260.
Уровни сопротивления: 1.3535, 1.3600, 1.3700, 1.3790.
Торговые сценарии
Короткие позиции стоит открывать по рыночной цене с целями 1.3400, 1.3315 и стоп-лоссом 1.3560.
Альтернативным сценарием будет покупка на уровне 1.3535 с целями 1.3600, 1.3700 и стоп-лоссом 1.3450.
Срок реализации: 1-2 дня.
LiteFinance
EUR/USD: general review
Current trend
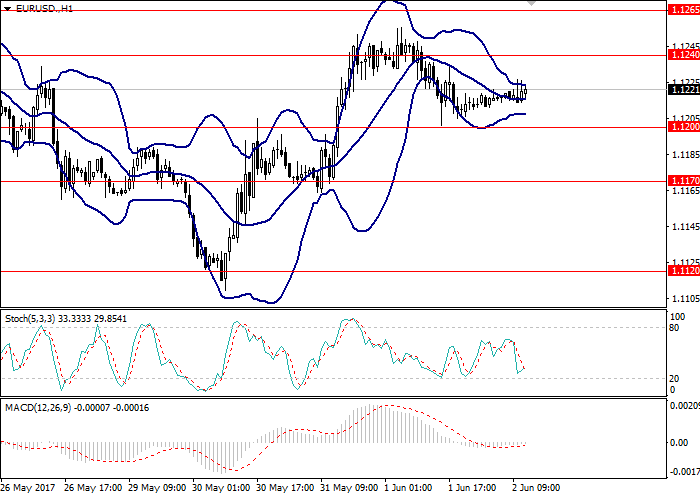
Thursday was volatile for the pair EUR/USD which was caused by yesterday’s releases and the news due today, in particular changes in nonfarm payrolls.
Yesterday after slight growth during the morning trading the pair got cheaper in view of release on an ADP report on the level of employment in the private sector. The indicator that precedes the NFP report showed growth and exceeded expectations strengthening USD and giving sufficient proof that the report on nonfarm payrolls will be positive. Strong NP data in turn will indirectly support the increase of FOMC rates in June.
The growth of initial jobless claims had a negative impact on the US currency and slowed down the fall of the pair. It dropped to1.1200 but failed to break through a strong support level.
Today the market is expected to be highly volatile.
Support and resistance
On the H1 chart the pair is demonstrating lateral movement within a narrow price range formed by the borders of Bollinger Bands. MACD histogram is around the zero mark, and its volumes are minimal.
Support levels: 1.1200, 1.1170, 1.1120.
Resistance levels: 1.1240, 1.1265.
Trading tips
Short positions may be opened from the level of 1.1190 with targets at 1.1120 and stop-loss at 1.1220.
Long positions may be opened from 1.1240 with targets at 1.1290 and top-loss at 1.1210.
The period of implementation is 1-2 days.
EUR/USD: general review
Current trend
Thursday was volatile for the pair EUR/USD which was caused by yesterday’s releases and the news due today, in particular changes in nonfarm payrolls.
Yesterday after slight growth during the morning trading the pair got cheaper in view of release on an ADP report on the level of employment in the private sector. The indicator that precedes the NFP report showed growth and exceeded expectations strengthening USD and giving sufficient proof that the report on nonfarm payrolls will be positive. Strong NP data in turn will indirectly support the increase of FOMC rates in June.
The growth of initial jobless claims had a negative impact on the US currency and slowed down the fall of the pair. It dropped to1.1200 but failed to break through a strong support level.
Today the market is expected to be highly volatile.
Support and resistance
On the H1 chart the pair is demonstrating lateral movement within a narrow price range formed by the borders of Bollinger Bands. MACD histogram is around the zero mark, and its volumes are minimal.
Support levels: 1.1200, 1.1170, 1.1120.
Resistance levels: 1.1240, 1.1265.
Trading tips
Short positions may be opened from the level of 1.1190 with targets at 1.1120 and stop-loss at 1.1220.
Long positions may be opened from 1.1240 with targets at 1.1290 and top-loss at 1.1210.
The period of implementation is 1-2 days.
EUR/USD: general review
Current trend
Thursday was volatile for the pair EUR/USD which was caused by yesterday’s releases and the news due today, in particular changes in nonfarm payrolls.
Yesterday after slight growth during the morning trading the pair got cheaper in view of release on an ADP report on the level of employment in the private sector. The indicator that precedes the NFP report showed growth and exceeded expectations strengthening USD and giving sufficient proof that the report on nonfarm payrolls will be positive. Strong NP data in turn will indirectly support the increase of FOMC rates in June.
The growth of initial jobless claims had a negative impact on the US currency and slowed down the fall of the pair. It dropped to1.1200 but failed to break through a strong support level.
Today the market is expected to be highly volatile.
Support and resistance
On the H1 chart the pair is demonstrating lateral movement within a narrow price range formed by the borders of Bollinger Bands. MACD histogram is around the zero mark, and its volumes are minimal.
Support levels: 1.1200, 1.1170, 1.1120.
Resistance levels: 1.1240, 1.1265.
Trading tips
Short positions may be opened from the level of 1.1190 with targets at 1.1120 and stop-loss at 1.1220.
Long positions may be opened from 1.1240 with targets at 1.1290 and top-loss at 1.1210.
The period of implementation is 1-2 days.
LiteFinance
NZD/USD: general analysis
Current trend
The New Zealand dollar is lowering during the trading session today.
The NZD is weakening due to the poor PRC data publications. According to Caixin, the China Manufacturing PMI lowered below the level of 50 for the first time from June, 2016. In May the index lowered by 0.7 to 49.6 points. The index evaluates the state of the manufacturing industry.
A reading above 50 is perceived as positive for the Chinese economy. A reading below 50 is perceived as negative. The New Zealand economy is responsive to the PRC economical news, as China is its major trading partner.
Today the list of US economical news will be published. The ISM Manufacturing PMI is worth traders’ attention, as it will give an insight of the economy growth rate, and the ISM Prices Paid.
Support and resistance
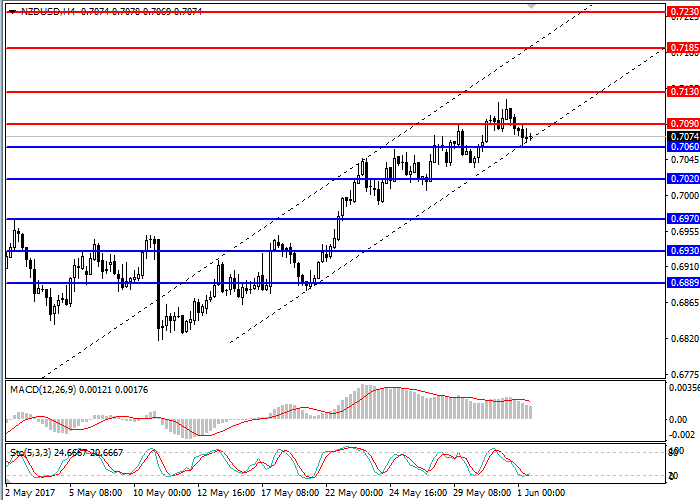
On the 4-hour chart the pair is moving within the upward channel. It is expected to trade near its lower border. MACD is above the zero line, but its volumes are decreasing, Stochastic is pointed downwards. The indicators give a sell signal.
Support levels: 0.7060, 0.7020, 0.6970.
Resistance levels: 0.7090, 0.7130, 0.7185.
Trading scenario
Buy the pair after the price is set above the level of 0.7090 with the target at 0.7130 and 0.7185, stop loss is at 0.7070.
Short positions seem more relevant, open ones below the level of 0.7060 with the target at 0.7020 and 0.6970 and stop loss at 0.7080.
Implementation period: 1-2 days.
NZD/USD: общий обзор
Текущая динамика
На сегодняшних торгах цена на новозеландский доллар снижается на фоне слабых данных из КНР. Согласно данным издания Caixin, индекс деловой активности в промышленном секторе экономики Китая впервые с июня 2016 года упал ниже отметки 50. В мае показатель снизился на 0,7 и составил 49.6 пункта. Индикатор даёт оценку текущей экономической ситуации в отрасли.
Значение выше 50 воспринимается как позитивный сигнал для китайской экономики. Значение ниже 50, напротив, является негативным сигналом. Экономика Новой Зеландии чутко реагирует на экономические новости из КНР, поскольку Китай является её главным торговым партнером.
Сегодня нас ждет блок экономических данных из США. Пристальное внимание стоит обратить на индекс деловой активности в производственном секторе ISM, который даст информацию о темпах развития экономики, а также на индекс постепенного разгона инфляции.
Уровни поддержки и сопротивления
На 4-часовом графике пара продолжает свое движение в рамках восходящего канала. Ожидается, что далее она будет торговаться вблизи нижней его границы. Индикатор MACD находится выше нулевой линии, но его объёмы уменьшаются, линии Стохастика направлены вниз. Индикаторы дают сигнал на продажу.
Уровни поддержки: 0.7060, 0.7020, 0.6970.
Уровни сопротивления: 0.7090, 0.7130, 0.7185.
Торговые сценарии
Покупать пару можно после закрепления цены выше отметки 0.7090 с целями 0.7130 и 0.7185, стоп-лосс на уровне 0.7070.
Более актуальными выглядят короткие позиции, которые можно открывать ниже уровня 0.7060, с целями 0.7020 и 0.6970 и стоп-лоссом на уровне 0.7070.
Срок реализации: 1-2 дня.
Current trend
The New Zealand dollar is lowering during the trading session today.
The NZD is weakening due to the poor PRC data publications. According to Caixin, the China Manufacturing PMI lowered below the level of 50 for the first time from June, 2016. In May the index lowered by 0.7 to 49.6 points. The index evaluates the state of the manufacturing industry.
A reading above 50 is perceived as positive for the Chinese economy. A reading below 50 is perceived as negative. The New Zealand economy is responsive to the PRC economical news, as China is its major trading partner.
Today the list of US economical news will be published. The ISM Manufacturing PMI is worth traders’ attention, as it will give an insight of the economy growth rate, and the ISM Prices Paid.
Support and resistance
On the 4-hour chart the pair is moving within the upward channel. It is expected to trade near its lower border. MACD is above the zero line, but its volumes are decreasing, Stochastic is pointed downwards. The indicators give a sell signal.
Support levels: 0.7060, 0.7020, 0.6970.
Resistance levels: 0.7090, 0.7130, 0.7185.
Trading scenario
Buy the pair after the price is set above the level of 0.7090 with the target at 0.7130 and 0.7185, stop loss is at 0.7070.
Short positions seem more relevant, open ones below the level of 0.7060 with the target at 0.7020 and 0.6970 and stop loss at 0.7080.
Implementation period: 1-2 days.
NZD/USD: общий обзор
Текущая динамика
На сегодняшних торгах цена на новозеландский доллар снижается на фоне слабых данных из КНР. Согласно данным издания Caixin, индекс деловой активности в промышленном секторе экономики Китая впервые с июня 2016 года упал ниже отметки 50. В мае показатель снизился на 0,7 и составил 49.6 пункта. Индикатор даёт оценку текущей экономической ситуации в отрасли.
Значение выше 50 воспринимается как позитивный сигнал для китайской экономики. Значение ниже 50, напротив, является негативным сигналом. Экономика Новой Зеландии чутко реагирует на экономические новости из КНР, поскольку Китай является её главным торговым партнером.
Сегодня нас ждет блок экономических данных из США. Пристальное внимание стоит обратить на индекс деловой активности в производственном секторе ISM, который даст информацию о темпах развития экономики, а также на индекс постепенного разгона инфляции.
Уровни поддержки и сопротивления
На 4-часовом графике пара продолжает свое движение в рамках восходящего канала. Ожидается, что далее она будет торговаться вблизи нижней его границы. Индикатор MACD находится выше нулевой линии, но его объёмы уменьшаются, линии Стохастика направлены вниз. Индикаторы дают сигнал на продажу.
Уровни поддержки: 0.7060, 0.7020, 0.6970.
Уровни сопротивления: 0.7090, 0.7130, 0.7185.
Торговые сценарии
Покупать пару можно после закрепления цены выше отметки 0.7090 с целями 0.7130 и 0.7185, стоп-лосс на уровне 0.7070.
Более актуальными выглядят короткие позиции, которые можно открывать ниже уровня 0.7060, с целями 0.7020 и 0.6970 и стоп-лоссом на уровне 0.7070.
Срок реализации: 1-2 дня.
LiteFinance
USD/CHF: general review
Current trend
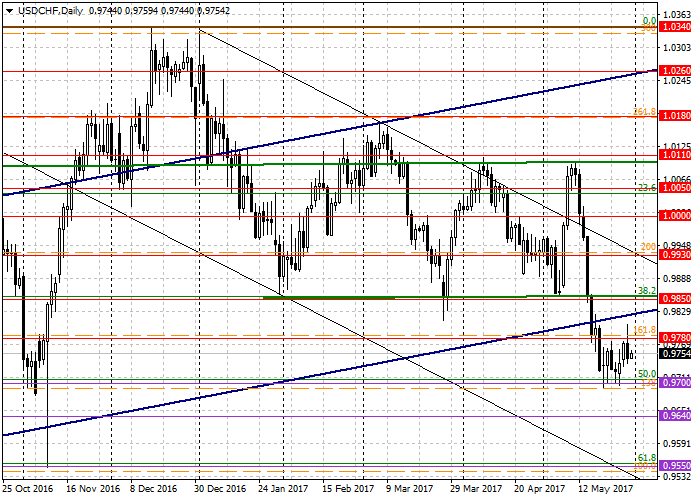
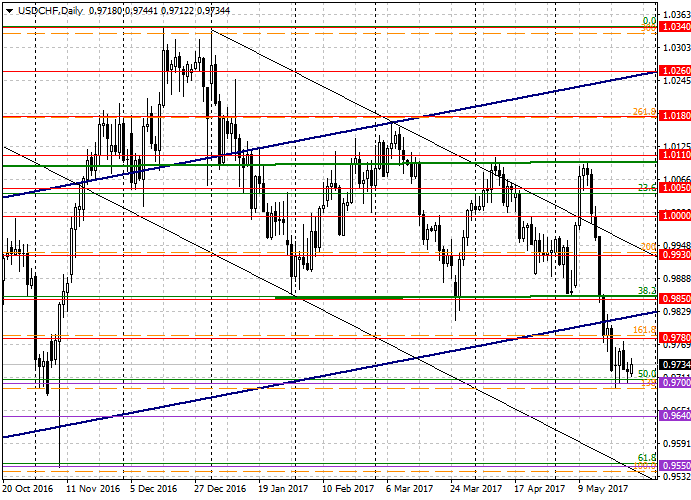
Yesterday the dynamics of the pair USD/CHF was determined by negative values of oth currencies. After Swiss index of leading economic indicators for May appeared to be wore than expected, the pair moved up from the narrow two-weeks flat. But weak data on the consumer confidence index from the USA returned the price of the pair back to the range indicating that it was falsely broken through.
ZEW Indicator of Economic Sentiment is due today in Switzerland at 10:00 (GMT+2).
PMI Chicago will be published at 15:45 (GMT+2). The data on incompleted sales transactions in the US real estate market is due at 16:00 (GMT+2). FOMC Beige Book Economic Review is due at 20:00 (GMT+2).
Support and resistance
Support levels: 0.9700, 0.9640, 0.9550.
Resistance levels: 0.9780, 0.9850, 0.9930, 1.0000.
Trading tips
Short positions may be opened at the market price with targets at 0.9700, 0.9640 and stop-loss at 0.9780.
Alternatively, buy positions may be opened from 0.9780 with targets at 0.9850, 0.9930 and stop-loss at 0.9740.
USD/CHF: общий анализ
Текущая динамика
Вчера динамику пары USD/CHF определяли негативные показатели по обеим валютам. После того, как в Швейцарии индекс ведущих экономических показателей за май оказался значительно хуже прогноза, пара вышла вверх из узкого двухнедельного флэта. Но слабые данные по индексу доверия потребителей из Америки вернули цену пары обратно в диапазон, указав, что прорыв диапазона верх был ложным.
Сегодня в Швейцарии будет опубликован индекс экономических ожиданий ZEW (10:00 GMT+2).
В 15:45 (GMT+2) будет опубликован индекс деловой активности (PMI) в Чикаго. В 16:00 (GMT+2) выйдут данные по незавершенным продажам на рынке недвижимости США. В 20:00 (GMT+2) будет опубликован экономический обзор «Бежевая книга» ФРС США.
Уровни поддержки и сопротивления
Уровни поддержки: 0.9700, 0.9640, 0.9550.
Уровни сопротивления: 0.9780, 0.9850, 0.9930, 1.0000.
Торговые сценарии
Короткие позиции можно открывать по рыночной цене с целями в районе 0.9700, 0.9640 и стоп-лоссом на уровне 0.9780.
Альтернативой может быть покупка от уровня 0.9780 с целями в районе 0.9850, 0.9930 и стоп-лоссом на уровне 0.9740.
Current trend
Yesterday the dynamics of the pair USD/CHF was determined by negative values of oth currencies. After Swiss index of leading economic indicators for May appeared to be wore than expected, the pair moved up from the narrow two-weeks flat. But weak data on the consumer confidence index from the USA returned the price of the pair back to the range indicating that it was falsely broken through.
ZEW Indicator of Economic Sentiment is due today in Switzerland at 10:00 (GMT+2).
PMI Chicago will be published at 15:45 (GMT+2). The data on incompleted sales transactions in the US real estate market is due at 16:00 (GMT+2). FOMC Beige Book Economic Review is due at 20:00 (GMT+2).
Support and resistance
Support levels: 0.9700, 0.9640, 0.9550.
Resistance levels: 0.9780, 0.9850, 0.9930, 1.0000.
Trading tips
Short positions may be opened at the market price with targets at 0.9700, 0.9640 and stop-loss at 0.9780.
Alternatively, buy positions may be opened from 0.9780 with targets at 0.9850, 0.9930 and stop-loss at 0.9740.
USD/CHF: общий анализ
Текущая динамика
Вчера динамику пары USD/CHF определяли негативные показатели по обеим валютам. После того, как в Швейцарии индекс ведущих экономических показателей за май оказался значительно хуже прогноза, пара вышла вверх из узкого двухнедельного флэта. Но слабые данные по индексу доверия потребителей из Америки вернули цену пары обратно в диапазон, указав, что прорыв диапазона верх был ложным.
Сегодня в Швейцарии будет опубликован индекс экономических ожиданий ZEW (10:00 GMT+2).
В 15:45 (GMT+2) будет опубликован индекс деловой активности (PMI) в Чикаго. В 16:00 (GMT+2) выйдут данные по незавершенным продажам на рынке недвижимости США. В 20:00 (GMT+2) будет опубликован экономический обзор «Бежевая книга» ФРС США.
Уровни поддержки и сопротивления
Уровни поддержки: 0.9700, 0.9640, 0.9550.
Уровни сопротивления: 0.9780, 0.9850, 0.9930, 1.0000.
Торговые сценарии
Короткие позиции можно открывать по рыночной цене с целями в районе 0.9700, 0.9640 и стоп-лоссом на уровне 0.9780.
Альтернативой может быть покупка от уровня 0.9780 с целями в районе 0.9850, 0.9930 и стоп-лоссом на уровне 0.9740.
LiteFinance
USD/CAD: general review
Current trend
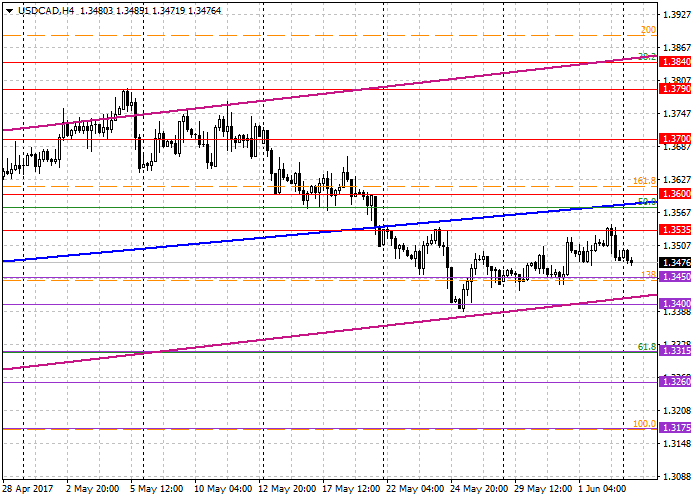
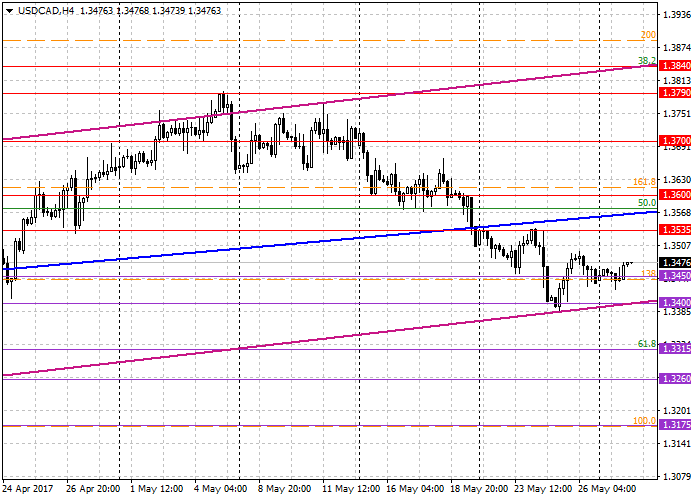
The growth of Canadian dollar strengthened after the decision of the Bank of Canada on the interet rate made last week. As a result the pair reached its six-weeks minimum from which upward correction (purple trend line) started. Right now the movement of the pair is hindered by a stronger trend line — the blue one. The price is likely to meet it between the levels of 1.3535 and 1.3600.
Today the dynamics of the pair may be influenced by the important data from Canada and the USA. The data on the Canadian trading balance and raw materials prices index are due at 14:30 (GMT+2). The information on personal income and expenditure will be published in the USA at the same time.
The most likely scenario for today is the continuation of the pair's growth.
Support and resistance
Support levels: 1.3450, 1.3400, 1.3315, 1.3260.
Resistance levels: 1.3535, 1.3600, 1.3700, 1.3790.
Trading tips
Long positions may be opened at the market price with targets at 1.3535, 1.3600 and stop-loss at 1.3430.
Alternatively, sell positions may be opened from the level of 1.3426 with targets at 1.3400, 1.3315 and stop-loss at 1.3456.
The period of implementation is 1-2 days.
USD/CAD: общий обзор
Текущая динамика
Рост канадского доллара против американского усилился после решения Банка Канады по процентной ставке на прошлой неделе. В результате пара достигла шестинедельного минимума, от которого началась восходящая коррекция (фиолетовая линия тренда). Теперь на пути роста пары находится более сильная линия тренда — синяя. Встреча цены с этой линией, предположительно, произойдёт в зоне между уровнями 1.3535 и 1.3600.
Сегодня на динамику пары могут повлиять важные данные из Канады и США. В 14:30 (GMT+2) выйдут данные по торговому балансу Канады и по индексу цен на сырьё. В это же время в США будут опубликованы данные по доходам и расходам.
Наиболее вероятным сценарием на сегодня выглядит продолжение укрепления торгового инструмента.
Уровни поддержки и сопротивления
Уровни поддержки: 1.3450, 1.3400, 1.3315, 1.3260.
Уровни сопротивления: 1.3535, 1.3600, 1.3700, 1.3790.
Торговые сценарии
Длинные позиции можно открывать по рыночной цене с целями в районе 1.3535, 1.3600 и стоп-лоссом на уровне 1.3430.
Альтернативой является продажа от уровня 1.3426 с целями в районе 1.3400, 1.3315 и стоп-лоссом на уровне 1.3456.
Срок реализации составляет 1-2 дня.
Current trend
The growth of Canadian dollar strengthened after the decision of the Bank of Canada on the interet rate made last week. As a result the pair reached its six-weeks minimum from which upward correction (purple trend line) started. Right now the movement of the pair is hindered by a stronger trend line — the blue one. The price is likely to meet it between the levels of 1.3535 and 1.3600.
Today the dynamics of the pair may be influenced by the important data from Canada and the USA. The data on the Canadian trading balance and raw materials prices index are due at 14:30 (GMT+2). The information on personal income and expenditure will be published in the USA at the same time.
The most likely scenario for today is the continuation of the pair's growth.
Support and resistance
Support levels: 1.3450, 1.3400, 1.3315, 1.3260.
Resistance levels: 1.3535, 1.3600, 1.3700, 1.3790.
Trading tips
Long positions may be opened at the market price with targets at 1.3535, 1.3600 and stop-loss at 1.3430.
Alternatively, sell positions may be opened from the level of 1.3426 with targets at 1.3400, 1.3315 and stop-loss at 1.3456.
The period of implementation is 1-2 days.
USD/CAD: общий обзор
Текущая динамика
Рост канадского доллара против американского усилился после решения Банка Канады по процентной ставке на прошлой неделе. В результате пара достигла шестинедельного минимума, от которого началась восходящая коррекция (фиолетовая линия тренда). Теперь на пути роста пары находится более сильная линия тренда — синяя. Встреча цены с этой линией, предположительно, произойдёт в зоне между уровнями 1.3535 и 1.3600.
Сегодня на динамику пары могут повлиять важные данные из Канады и США. В 14:30 (GMT+2) выйдут данные по торговому балансу Канады и по индексу цен на сырьё. В это же время в США будут опубликованы данные по доходам и расходам.
Наиболее вероятным сценарием на сегодня выглядит продолжение укрепления торгового инструмента.
Уровни поддержки и сопротивления
Уровни поддержки: 1.3450, 1.3400, 1.3315, 1.3260.
Уровни сопротивления: 1.3535, 1.3600, 1.3700, 1.3790.
Торговые сценарии
Длинные позиции можно открывать по рыночной цене с целями в районе 1.3535, 1.3600 и стоп-лоссом на уровне 1.3430.
Альтернативой является продажа от уровня 1.3426 с целями в районе 1.3400, 1.3315 и стоп-лоссом на уровне 1.3456.
Срок реализации составляет 1-2 дня.
LiteFinance
GBP/USD: general review
Current trend
The rate of the pound rapidly fell against USD in the end of the previous week dropping by 230 points. The pair closed trading at the level of 1.2808 which is the lowest closing price in the previous four weeks. The fall of GBP was caused by the polls taken in view of the upcoming UK election. The positions of the conservative wavered after Manchester events.
Last week the price failed to overcome an important level of 1.3030 which would have given the "bulls" an additional impulse. Today is a holiday in the UK and USA, therefore no activity in the market should be expected due to low liquidity. This should keep the pair GBP/USD within the narrow range and in the consolidation regime.
In the USA FOMC statement on the interest rate was more cautios than expected. The regulator pointed out that the increase of interest rates will depend on the information received by it. Therefore the release of the data on the nonfarm payrolls schedulled in the end of the week shall determine yet another direction for USD. The pound, in turn, may be under pressure in view of the news about another referendum in Scotland on its exit from the UK in case of the victory of the dominant party at the election on June 8.
Support and resistance
Support levels: 1.2830, 1.2800.
Resistance levels: 1.2850, 1.2900, 1.2930, 1.2975, 1.3015, 1.3045.
Trading tips
Short positions may be opened from the level of 1.2790 with target at 1.2700 and stop-loss at 1.2820.
Long positions may be opened from the level of 1.2850 with targets at 1.2900 and stop-loss at1.2820.
The period of implementation is 2-5 days.
GBP/USD: общий обзор
Текущая динамика
Курс фунта резко упал по отношению к доллару США в конце прошлой недели, снизившись на 230 пунктов. Пара закончила торги на отметке 1.2808 – самое низкое значение цены закрытия за последние четыре недели. Фунт упал в ответ на последние опросы общественного мнения в преддверии выборов в Великобритании. Позиции консерваторов существенно пошатнулись после событий в Манчестере.
На прошлой неделе цене не удалось преодолеть важный уровень 1.3030, что придало бы дополнительный импульс «быкам». Сегодня в Великобритании и в США выходной день, поэтому не стоит ожидать высокой активности на рынке в связи с низкой ликвидностью, что должно удержать пару GBP/USD в узком диапазоне и в режиме консолидации.
В США заявление ФРС по процентной ставке было более осторожным, чем ожидалось. Регулятор дал понять, что повышение ставок будет зависеть от поступающих данных, поэтому выход информации по количеству новых рабочих мест, созданных вне сельскохозяйственного сектора, запланированный на конец недели, определит следующее направление для доллара. Фунт, между тем, может оказаться под давлением в свете появившихся новостей о возможном повторном референдуме в Шотландии о выходе из Соединённого Королевства в случае победы правящей партии на выборах 8 июня.
Уровни поддержки и сопротивления
Уровни поддержки: 1.2830, 1.2800.
Уровни сопротивления: 1.2850, 1.2900, 1.2930, 1.2975, 1.3015, 1.3045.
Торговые сценарии
Открывать короткие позиции можно от уровня 1.2790 с целью 1.2700 и стоп-лоссом 1.2820.
Открывать длинные позиции можно от уровня 1.2850 с целью 1.2900 и стоп-лоссом на уровне 1.2820.
Срок реализации составляет 2-5 дней.
LiteFinance
USD/CHF: general review
Current trend
This week the pair USD/CHF was trading in the side corridor between the strong support level of 0.9700 and resistance level of 0.9780. Yesterday US dollar grew in view of positive data on the number of initial jobless claims (the indicator was lower than expected and made up 234K). Negative weekly data for CHF include April trading balance (that fell to 1.968 mln) and the volume of industrial output for Q1 2017 (that reduced to 4.6%). Nevertheless, CHF was stable against te growing USD. Having tested the level of 0.9700 once again, the pair failed to break through it.
Today additional volatility to the pair may be given by the US GDP data for Q1 2017 (that is to increase by 0.9%) and statistics on the volume of demand for durable goods (in April the indicator may fall by 1.2%). Generally the data is not overally positive for USD, but the pair is unlikely to enter serious correction. It may remain within the horizontal range.
Support and resistance
Support levels: 0.9700, 0.9640, 0.9550.
Resistance levels: 0.9780, 0.9850, 0.9930, 1.0000.
Trading tips
Long positions may be opened at the market price with target at 0.9780 and stop-loss at 0.9640.
Alternatively, one may open sell positions at the level of 0.9780 with target at 0.9700 and stop-loss at 0.9860.
USD/CHF: общий обзор
Текущая динамика
На текущей неделе пара USD/CHF торговалась в боковом коридоре между сильным уровнем поддержки 0.9700 и сопротивления - 0.9780. Вчера доллар США вырос на фоне позитивных для него данных по числу первичных заявок на пособия по безработице (показатель оказался ниже прогнозов и составил 234 тысяч). Из негативных для франка данных недели нужно отметить апрельское сальдо торгового баланса (показатель снизился до 1,968 миллиона) и объём промышленных заказов за 1 квартал текущего года (показатель снизился на 4,6%). Тем не менее, валюта Швейцарии устояла против растущего доллара, а пара USD/CHF, протестировав в очередной раз уровень 0.9700, не смогла его преодолеть.
Сегодня, волатильности торговому инструменту могут добавить данные по ВВП США за первый квартал текущего года (ожидается рост показателя 0,9%) и статистика по объёму заказов на товары длительно пользования (в апреле показатель может снизиться на 1,2%). В целом, данные не слишком позитивны для доллара, однако вряд ли пара серьёзно скорректируется. Вероятнее всего, она останется в рамках горизонтального диапазона.
Уровни поддержки и сопротивления
Уровни поддержки: 0.9700, 0.9640, 0.9550.
Уровни сопротивления: 0.9780, 0.9850, 0.9930, 1.0000.
Торговые сценарии
Длинные позиции можно открывать по рыночной цене с целью 0.9780 и стоп-лоссом 0.9640.
Альтернативой может быть продажа от уровня 0.9780 с целью 0.9700 и стоп-лоссом 0.9860.
LiteFinance
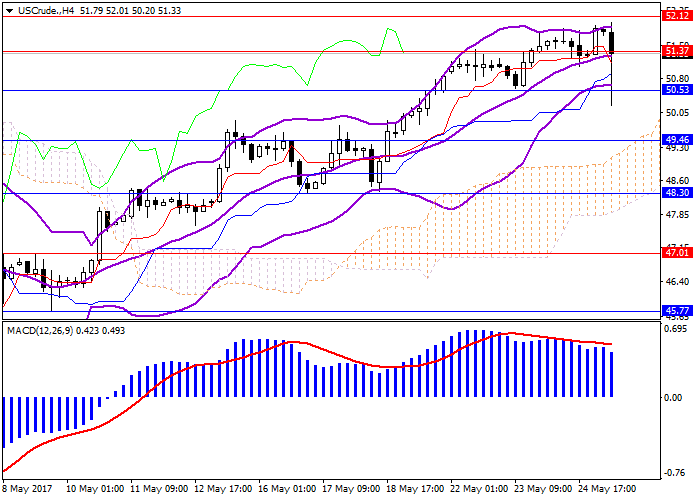
WTI Crude Oil: general analysis
Current trend
After the fall yesterday the oil tried to grow today. The price has reached the level of 52.00, but then has rapidly lowered to the area of the level of 50.20 due to the commentaries of one of the OPEC representatives, who said that there is no necessity in greater oil production limitation. At the moment the OPEC meeting is held in Vienna, and the results of it will be published today. It is expected, that the parties will come to the agreement, which prolong the world oil production limitation for some more time. The basic variant of the prolongation period is 9 months, but the prolongation by 1 year is not excluded. There is no clear information yet, and the market can react impulsively on the OPEC representatives’ commentaries.
If all the parties come to the agreement of the prolongation by 9 month or more, WTI price will be supported and continue to grow. If not all the parties enter the Agreement or aren’t ready to fulfill the current conditions of the oil production limitation, the lowering of the price is expected.
It’s inappropriate to rely on the technical indicators’ readings at the moment, as the price dynamics depends on the OPEC decision in the nearest future.
Support and resistance
Support levels: 50.53, 49.46, 48.30.
Resistance levels: 52.12, 53.20, 54.00
Trading scenario
Open short positions below the level of 50.53 with the target at around 49.46 and stop loss at 50.70.
Open long positions above the level of 52.12 with the target at around 53.20 and stop loss at 51.80.
WTI Crude Oil: общий обзор
Текущая динамика
После снижения в среду, сегодня нефть предприняла попытку роста. Цена достигала отметки 52.00, однако резко опустилась в район отметки 50.20. Так рынок отреагировал на слова одного из представителей ОПЕК о том, что нет необходимости в более серьезном сокращении добычи нефти.
В настоящее время в Вене проходит заседание ОПЕК, итоги встречи которого станут известны сегодня в течение дня. Прогнозируется, что стороны придут к соглашению, продлевающему сокращение мирового уровня добычи нефти ещё на определенный период. Базовый вариант продления соглашения — 9 месяцев, однако не исключено, что срок может быть продлен до года. Пока никакой конкретной информации нет, и рынок может импульсивно реагировать на слова представителей ОПЕК.
Если все стороны договорятся продлить соглашение на 9 месяцев и более, то курс WTI может получить поддержку и продолжить рост. Если к соглашению присоединятся не все стороны или не все стороны окажутся готовыми поддерживать в полной мере условия по текущим квотам на добычу нефти, то стоит ожидать возобновление снижения курса.
Ориентироваться на показания технических индикаторов в данный момент нецелесообразно, так как движение цены в ближайшей перспективе будет зависеть от окончательного решения ОПЕК.
Уровни поддержки и сопротивления
Уровни поддержки: 50.53, 49.46, 48.30.
Уровни сопротивления: 52.12, 53.20, 54.00.
Торговые сценарии
Позиции на продажу открывать ниже уровня 50.53 с целью в районе 49.46 и стоп-лоссом на уровне 50.70.
Позиции на покупку открывать выше уровня 52.12 с целью в районе 53.20 и стоп-лоссом на уровне 51.80.
LiteFinance
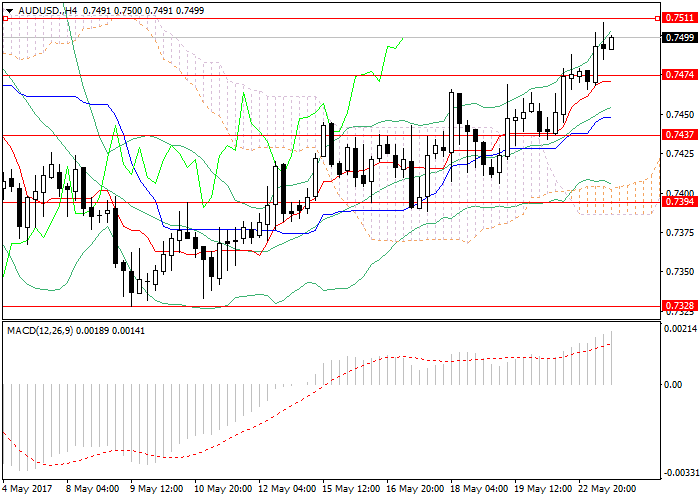
AUD/USD: general analysis
Current trend
Due to the absence of the macroeconomical statistics the investor continue to react to the negative political factors from the USA and sell the US dollar, which led to the growth of the AUD/USD pair. During the last day the pair strengthened by 0.55% and reached the area of 0.7493.
Technical indicators reflect that the buyers are still strong in the market. Bollinger Bands are diverging, confirming the upward trend. MACD histogram is in the positive zone; its volumes are rapidly growing and forming a buy signal. The breakout of the level 0.7511 will let the price to grow further and reach the level of 0.7555. If the pair cannot consolidate above the level of 0.7511, the correction to the area of middle line of Bollinger Bands (0.7450) will be expected.
Support and resistance
Support levels: 0.7474, 0.7437, 0.7394.
Resistance levels: 0.7511, 0.7555, 0.7587.
Trading scenario
Open long positions above the level of 0.7511 with the target around 0.7555, 0.7587 and stop loss at 0.7485.
Open short positions below the level of 0.7474 with the target around 0.7437, 0.7394 and stop loss at 0.7500.
AUD/USD: общий обзор
Текущая динамика
На фоне отсутствия макроэкономической статистики участники рынка продолжают отыгрывать негативные политические факторы из США и продают американские доллары, результатом чего стал рост курса AUD/USD. За последние сутки пара прибавила 0,55% и поднялась в район 0.7493.
Показания технических индикаторов говорят о том, что покупатели на рынке все ещё сильны. Полосы Боллинджера расходятся, подтверждая восходящую тенденцию. Гистограмма MACD находится в положительной зоне, объёмы её стремительно растут и формируют сигнал на покупку. Пробой уровня 0.7511 будет сигналом к продолжению роста и откроет паре путь к уровню 0.7555. Если попытки закрепиться выше уровня 0.7511 останутся безуспешными, то в таком случае стоит ждать коррекции курса в район средней полосы Боллинджера (0.7450).
Уровни поддержки и сопротивления
Уровни поддержки: 0.7474, 0.7437, 0.7394.
Уровни сопротивления: 0.7511, 0.7555, 0.7587.
Торговые сценарии
Позиции на покупку открывать выше уровня 0.7511 с целями в районе 0.7555, 0.7587 и стоп-лоссом на уровне 0.7485.
Позиции на продажу открывать ниже уровня 0.7474 с целями в районе 0.7437, 0.7394 и стоп-лоссом на уровне 0.7500.
LiteFinance
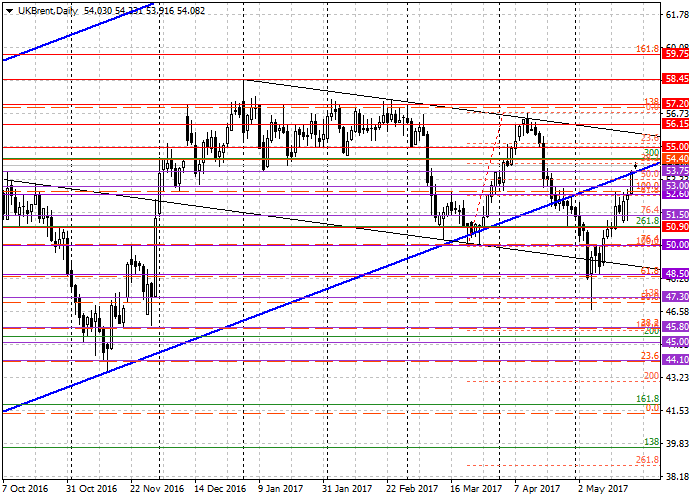
Brent Crude Oil: general analysis
Current trend
Last week oil prices reached the 4 weeks maximum around 53.50-54.00 USD per barrel. The price was supported by the lowering of the USD, which is weakening due to the USA Administration crisis. The lowering of the US oil recourses also made a positive impact on the price. In addition, the commentaries of the OPEC members leave no doubt that the oil production limitation agreement will be prolonged.
The main upcoming issue in the oil market is the OPEC meeting in Vienna on May, 25. Most likely, the result of the meeting is already taken into account by the investors, and after the publication of the results of the OPEC meeting the traders will fix the profit partially, which will lead to the lowering of the price.
Support and resistance
Technical picture reflects that the price crossed very significant resistance zone — the lower border of the channel D1 (blue), which has been the price growth trend line for the year and a half. Further reaction of the price in this zone will determine the movement dynamics in the nearest future.
Support levels: 53.75, 53.00, 52.60, 51.50.
Resistance levels: 54.40, 55.00, 56.15, 57.20.
Trading scenario
Open long positions at the current price with the target at 54.40, 55.00 and stop loss at 53.70.
Sell at the level of 53.00 with the target at 52.60, 51.50 and stop loss at 53.40.
Implementation period: 2-3 days.
Brent Crude Oil: общий анализ
Текущая динамика
На прошлой неделе нефть достигла четырёхнедельного максимума в зоне 53.50-54.00 доллара за баррель. Цены поддержал падающий на фоне кризиса американской администрации доллар США. Снижение запасов нефтепродуктов в США также оказало положительное влияние на котировки. Кроме того, в преддверии венского заседания ОПЕК комментарии картеля не оставляют сомнений в продлении соглашения о сокращении добычи.
Главным ожидаемым событием на нефтяном рынке является заседание ОПЕК, которое состоится 25 мая в Вене. Скорее всего, решение этого заседания уже учтено рынком, и после публикации итогов встречи ОПЕК часть прибыли будет зафиксирована инвесторами, что приведет к снижению курса.
Уровни поддержки и сопротивления
Техническая картина показывает, что цена преодолела очень серьёзную зону сопротивления — нижнюю границу канала D1 (синий), которая полтора года служит линией тренда роста цены. Дальнейшая реакция цены в этой зоне определит динамику движения на ближайшую перспективу.
Уровни поддержки: 53.75, 53.00, 52.60, 51.50.
Уровни сопротивления: 54.40, 55.00, 56.15, 57.20.
Торговые сценарии
Открывать длинные позиции по рыночной цене с целями 54.40, 55.00 и стоп-лоссом 53.70.
Продавать от уровня 53.00 с целями 52.60, 51.50 и стоп-лоссом на уровне 53.40.
Срок реализации: 2-3 дня.
LiteFinance

EUR/USD: general review
Current trend
On Thursday USD stabilized after a fall in the beginning of the week caused by political turmoil in the USA. The US currency was supported by a strong unemployment report. The number of initial jobless claims dropped from 236K to 232K while the experts expected it to grow to 240K. Moreover, manufacturing PMI in Philadelphia suddenly drew from 22.0 to 38.8 points against the negative forecast of 19.9 points.
Currently the possibility of further fall of USD is high as political instability in Washington puts complex pressures on USD. Along with this Trump's impeachment is often mentioned in the media, and macroeconomic statistics becomes secondary.
Today in the second half of the day the market will be waiting for a statement by FOMC representative James Bullard dedicated to the fiscal policy. The comments of the official may have a considerable impact on the dynamics of the pair as the doubts about the growth of interest rates grow every day. Later on the European Commission will publish the data on consumer sentiment index in May. The expected growth of the indicator will strengthen the pair.
Support and resistance
On D1 chart the pair is trading in the upper part of Bollinger Bands. The indicator is directed downwards while the price range remains unchanged which is a ground for the continuation of the current trend. MACD histogram is in the positive zone with its volumes growing and keeping the sell signal. Stochastic is about to leave the overbought zone.
Support levels: 1.1065, 1.1015, 1.0951, 1.0853, 1.0765.
Resistance levels: 1.1132, 1.1183, 1.1246, 1.1310.
Trading tips
Long positions should be opened at the current price with targets at 1.1245 and stop-loss at 1.1038. The period of implementation is 1-2 days.
Short positions could be opened at the level of 1.1036 with target at 1.0945 and stop-loss at 1.1100. The period of implementation is 1-3 days.
EUR/USD: общий обзор
Текущая динамика
В четверг доллар стабилизировался после падения в начале недели, спровоцированного политическими волнениями в США. Поддержку американской валюте оказала публикация сильного отчёта по безработице. Так, число первичных заявок на пособия по безработице сократилось с 236 до 232 тысяч, тогда как эксперты прогнозировали рост числа первичных обращений до 240 тысяч. Кроме того, индекс деловой активности в производственном секторе Филадельфии неожиданно вырос с 22,0 до 38,8 пунктов, несмотря на негативный прогноз в 19,9 пункта.
В настоящее время высока вероятность дальнейшего падения американской валюты, так как нестабильная политическая обстановка в Вашингтоне оказывает всестороннее давление на доллар США. Вместе с тем, тема импичмента Трампа всё чаще упоминается в СМИ, при этом макроэкономическая статистика отошла на второй план.
Сегодня во второй половине дня состоится выступление представителя ФРС Джеймса Булларда, посвящённое денежно-кредитной политике. Комментарий чиновника способен оказать сильное влияние на динамику пары, так как сомнения относительно повышения процентных ставок в июне нарастают с каждым днём. Немногим позднее Европейская комиссия опубликует данные индекса уровня доверия потребителей за май. Прогнозируемый рост показателя укрепит пару.
Уровни поддержки и сопротивления
На дневном графике инструмент торгуется в верхней части полос Боллинджера. Индикатор направлен вверх, в то время как ценовой диапазон остаётся неизменным, что служит основанием для продолжения текущего тренда. Гистограмма MACD находится в положительной зоне, объёмы её продолжают расти, удерживая сигнал на покупку. Стохастик готовится покинуть область перекупленности.
Уровни поддержки: 1.1065, 1.1015, 1.0951, 1.0853, 1.0765.
Уровни сопротивления: 1.1132, 1.1183, 1.1246, 1.1310.
Торговые сценарии
Длинные позиции следует открывать по текущей цене с целью 1.1245 и стоп-лоссом на уровне 1.1038. Срок реализации составляет 1-2 дня.
Короткие позиции следует открывать от уровня 1.1036 с целью 1.0945 и стоп-лоссом на уровне 1.1100. Срок реализации составляет 1-3 дня.
LiteFinance
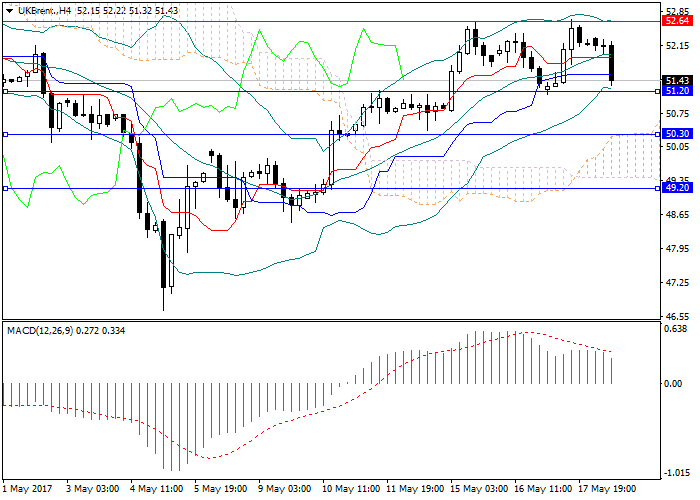
Brent Crude Oil: general analysis
Current trend
On Wednesday the Brent Crude Oil price grew, reacting to the API Crude Oil Stocks change that showed the USA resources lowering. The EIA Crude Oil Stocks change, which was published in the Wednesday evening, showed the lowering by 1.753 million barrel in a week. As a result the Brent Crude Oil grew by 1.81% and reached the area of the level of 52.64. The price tried to consolidate above the level for some times, but didn’t succeed, so the price was corrected downwards. It’s hard to increase the price above the level, taking into consideration the global oil surplus problems. After the slight growth of the last days the price entered the downward correction.
The traders are waiting for the further OPEC signals upon the stabilization of the world oil production level. The nearest OPEC meeting is on May, 25 in Vienna.
Support and resistance
Technical indicators reflect the growing influence of the sellers. Bollinger Bands are pointed downwards. MACD histogram is in the positive zone; however its volumes are decreasing confirming the downward trend.
Support levels: 51.20, 50.30, 49.20.
Resistance levels: 52.64, 53.67, 54.44.
Trading scenario
Open short positions below the level of 51.20 with the target at around 50.30 and stop loss at 51.45.
Open long positions above the level of 52.64 with the target at around 53.67 and stop loss at 52.30.
LiteFinance
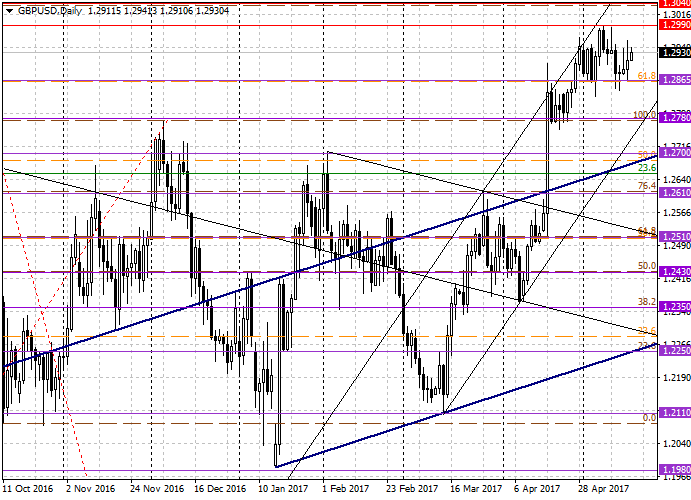
GBP/USD: general review
Current trend
On Tuesday GBP experienced volatility after the release of the data on the consumer price index. In March the indicator made 2.7% which considerably exceeds the target level of 2.0%. Investors worried that due to reduced income of households high inflation may lead to the fall of internal demand, that is why the pair went done but soon restored its lost positions. Today's releases included positive data on the unemployment rate (that dropped to 4.6% in March) and the average salary (the indicator with bonuses increased by 2.4%).
Generally, the pair is consolidating between the levels of 1.2865 and 1.2990. No considerable difficulties in the British economy caused by Brexit have been observed yet, and GBP is not weakening. On the other hand, the investors worry that FOMC intends to increase the interest rate, and President Trump states USD is too strong.
Among Wednesday news one may pay attention to the statement by the member of the Monetary Policy Committee of the Bank of England Haldane that could shed some light on further actions of the British regulator.
The growth of the pair is a forecast for the next two days.
Support and resistance
Support levels: 1.2700, 1.2780, 1.2865.
Resistance levels: 1.2990, 1.3040, 1.3110, 1.3200.
Trading tips
Long positions may be opened at the market price with targets at 1.2990, 1.3040 and stop-loss at 1.2900.
Alternatively, sell positions may be opened from the level of 1.2865 with target at 1.2780 and stop-loss at 1.2950.
GBP/USD: общий обзор
Текущая динамика
Во вторник британский фунт испытывал волатильность после выхода данных по индексу потребительских цен. В марте показатель составил 2,7%, что серьезно превышает целевой уровень 2,0%. Инвесторы опасались, что в условиях снижения доходов домашних хозяйств высокая инфляция может привести к снижению внутреннего спроса, поэтому пара пошла вниз, но вскоре восстановила утраченные позиции. Сегодня вышли позитивные данные по безработице (которая в марте снизилась до 4,6%) и средней заработной плате (показатель с учетом премий вырос на 2,4%).
В целом, пара консолидируется в зоне между уровнями 1.2865 и 1.2990. Серьёзных осложнений в экономике Великобритании, связанных с выходом из ЕС, пока не наступило, и фунт не спешит снижаться. С другой стороны, инвесторы озабочены тем, что ФРС намерен повысить процентную ставку, а Президент Трамп заявляет, что доллар слишком силён.
Из новостей среды стоит отметить выступление члена Комитета по денежной политике Банка Англии Халдейна, который может пролить свет на дальнейшие действия британского регулятора.
В ближайшие два дня предполагается рост пары.
Уровни поддержки и сопротивления
Уровни поддержки: 1.2700, 1.2780, 1.2865.
Уровни сопротивления: 1.2990, 1.3040, 1.3110, 1.3200.
Торговые сценарии
Длинные позиции можно открывать по рыночной цене с целями 1.2990, 1.3040 и стоп-лоссом 1.2900.
Альтернативой является продажа от уровня 1.2865 с целью 1.2780 и стоп-лоссом 1.2950.
LiteFinance
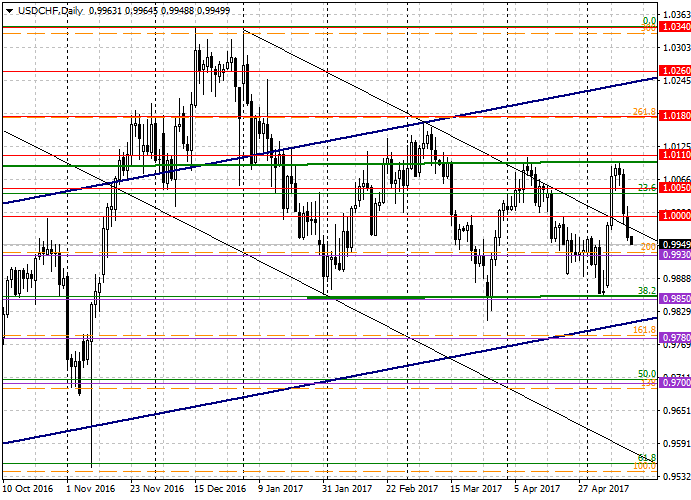
USD/CHF: general review
Current trend
Since the middle of the previous week the pair has been in the downward correction. Both recent data from the USA (retail sales and CPI) and Switzerland (CPI and manufacturers price index) were quite weak. However, the investors worried more about the fate of the US currency which pushes the pair down. Additional interest of the market to USD is explained by the expectations of June FOMC meeting and its interest rate decision. In these terms any signs of slowdown in the US economy put considerable pressure on USD, as the market worries about postponing the interest rate increase.
Today no important statistics from Switzerland is expected. From the USA the market is waiting for the data on the number of new construction permits and houses under construction in April. The most important release will be the volume of industrial output in the USA: the indicator is expected to fall from 0.5% to 0.4% which may cause further decrease of the pair.
Support and resistance
Technically, the pair has been moving in almost horizontal range between the borders of green channel D1 and the middle line for four months. The balance line of the channel is the level of parity with USD (1.0000).
Support levels: 0.9930, 0.9850, 0.9780, 0.9700.
Resistance levels: 1.0000, 1.0050, 1.0110, 1.0180.
Trading tips
Short positions may be opened at the market price with target at 0.9850 and stop-loss at 0.9950.
Alternatively, buy positions may be opened from the level of 1.0000 with targets at 1.0050, 1.0110 and stop-loss at 0.9960.
The period of implementation is 2-3 days.
USD/CHF: общий обзор
Текущая динамика
С середины прошлой недели пара находится в нисходящей коррекции. Последние данные как по США (розничные продажи и индекс потребительских цен), так и по Швейцарии (индекс потребительских цен, индекс цен производителей) вышли довольно слабыми, однако тревога инвесторов за судьбу американской валюты оказалась сильнее, что и толкает пару вниз. Повышенный интерес рынка к доллару объясняется ожиданием июньского заседания ФРС и его решения по процентной ставке. В этих условиях любые признаки замедления американской экономики вызывают значительное давление на доллар, потому что рынок начинает опасаться отсрочки нового повышения процентной ставки.
Сегодня значимой статистики по Швейцарии не ожидается, а в США будут опубликованы данные по количеству разрешений на строительство новых домов и количеству закладок новых домов в апреле. Наиболее интересным для участников рынка будет апрельский показатель объёма промышленного производства в США: ожидается снижение с 0,5% до 0,4%, что может вызвать дальнейший спад пары.
Уровни поддержки и сопротивления
Технически, в течении четырёх месяцев наблюдается движение цены в почти горизонтальном диапазоне между границами зелёного канала D1 и средней линией, линией баланса которого является уровень паритета с долларом США — 1.0000.
Уровни поддержки: 0.9930, 0.9850, 0.9780, 0.9700.
Уровни сопротивления: 1.0000, 1.0050, 1.0110, 1.0180.
Торговые сценарии
Короткие позиции можно открывать по рыночной цене с целью 0.9850 и стоп-лоссом 0.9950.
Альтернативой может быть покупка от уровня 1.0000 с целями 1.0050, 1.0110 и стоп-лоссом 0.9960.
Срок реализации составляет 2-3 дня.
: