LiteFinance / Профиль

Онлайн ECN брокер LiteFinance (ex. LiteForex) с 2005 года предоставляет клиентам возможность выхода к глубочайшей ликвидности на валютном, товарном и фондовом рынках. Для торговли через LiteFinance (ex. LiteForex) доступны все основные валютные пары и кросс-курсы, нефть, драгоценные металлы, биржевые индексы, акции корпораций и самый большой набор криптовалютных пар среди брокеров.
Друзья
381
Заявки
Исходящие

LiteFinance
Euro feels dirty
ECB is doing its best to save the euro-area economy, but Germany creates obstacles
How fast the Forex situation is changing! Just a week ago, the balance of power in the EUR/USD was clear. After the drop in the safe-haven demand amid the gradual reopening of the economies and the recovery of the global GDP, the euro should have started rising versus the US dollar. The dollar would be pressed down by the over-expanded Fed’s balance sheet and the U.S. increasing public debt. However, after there was announced the ruling of Germany’s constitutional court and geopolitical risks increased, everything has turned upside down.
BofA Merill Lynch sees the EUR/USD at 1.02 in late 2020 amid weak global economic outlook and limited power of the ECB in managing the monetary stimulus. Société Générale notes that the dispute between the two European supreme courts during the pandemic results in the market uncertainty, which is a rather negative factor. Citi warns about higher risks of the euro-area breakup, coming from not the peripheral countries but the nucleus, as the ECB may ignore the ruling of the Constitutional court, challenging Germany’s government.
According to the Financial Times source familiar with the inside information, the Governing council won’t directly respond to the German court. One of the ECB council members said that it would justify the QE in five minutes, but the ECB didn’t have to do it. It looks as if the ECB should report to any court at the first request when it decides to hike the rates, for example. Another official said that the German government and parliament should be the defendants, and the Governing Council would continue doing everything necessary.
The decision of the German court looks ridiculous. What could justify bond purchases better than the assistance to the countries suffered from the pandemic? The ECB might blur the line between the monetary and the fiscal policies, but this is because the euro-area governments, first of all, Germany, wouldn’t spend money. The ECB is doing a hard job and is criticized at the same time.
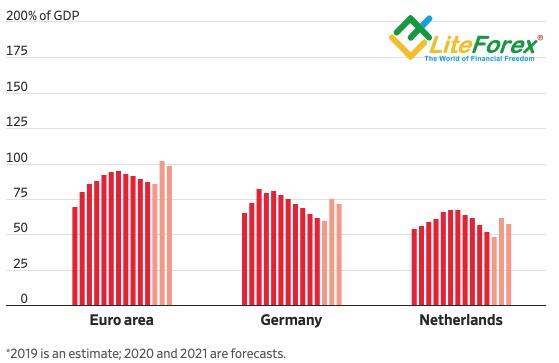
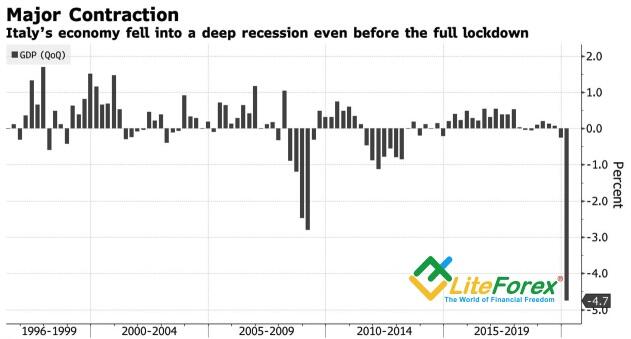
The currency bloc may break up, and the situation is worsened by the EC forecasts. The European Commission says the euro-area GDP will contract by 7.7% in 2020, it should recover by just 6.3% in 2021. Italy’s public debt will increase from 135% to 159% of GDP, Greece’s debt will exceed 200% of GDP. However, German and the Netherlands will perform quite well.
The EUR/USD is also pressed down by Donald Trump. The U.S. President gave Beijing two weeks to make sure whether China would meet its commitments to increase U.S. goods purchases by $200 billion over two years, including $77 billion in 2020. Taking into account the problems of the Chinese economy amid the pandemic, and a decline in the imports from the U.S. in the January-March period, the U.S. could well impose new tariffs soon. The pair’s drop below the support at 1.077-1.0775 could become critical.
Dynamics of public debts of GDP
ECB is doing its best to save the euro-area economy, but Germany creates obstacles
How fast the Forex situation is changing! Just a week ago, the balance of power in the EUR/USD was clear. After the drop in the safe-haven demand amid the gradual reopening of the economies and the recovery of the global GDP, the euro should have started rising versus the US dollar. The dollar would be pressed down by the over-expanded Fed’s balance sheet and the U.S. increasing public debt. However, after there was announced the ruling of Germany’s constitutional court and geopolitical risks increased, everything has turned upside down.
BofA Merill Lynch sees the EUR/USD at 1.02 in late 2020 amid weak global economic outlook and limited power of the ECB in managing the monetary stimulus. Société Générale notes that the dispute between the two European supreme courts during the pandemic results in the market uncertainty, which is a rather negative factor. Citi warns about higher risks of the euro-area breakup, coming from not the peripheral countries but the nucleus, as the ECB may ignore the ruling of the Constitutional court, challenging Germany’s government.
According to the Financial Times source familiar with the inside information, the Governing council won’t directly respond to the German court. One of the ECB council members said that it would justify the QE in five minutes, but the ECB didn’t have to do it. It looks as if the ECB should report to any court at the first request when it decides to hike the rates, for example. Another official said that the German government and parliament should be the defendants, and the Governing Council would continue doing everything necessary.
The decision of the German court looks ridiculous. What could justify bond purchases better than the assistance to the countries suffered from the pandemic? The ECB might blur the line between the monetary and the fiscal policies, but this is because the euro-area governments, first of all, Germany, wouldn’t spend money. The ECB is doing a hard job and is criticized at the same time.
The currency bloc may break up, and the situation is worsened by the EC forecasts. The European Commission says the euro-area GDP will contract by 7.7% in 2020, it should recover by just 6.3% in 2021. Italy’s public debt will increase from 135% to 159% of GDP, Greece’s debt will exceed 200% of GDP. However, German and the Netherlands will perform quite well.
The EUR/USD is also pressed down by Donald Trump. The U.S. President gave Beijing two weeks to make sure whether China would meet its commitments to increase U.S. goods purchases by $200 billion over two years, including $77 billion in 2020. Taking into account the problems of the Chinese economy amid the pandemic, and a decline in the imports from the U.S. in the January-March period, the U.S. could well impose new tariffs soon. The pair’s drop below the support at 1.077-1.0775 could become critical.
Dynamics of public debts of GDP
LiteFinance
Euro holds the ECB back
The decision of the German top court sends the EUR/USD down
You can’t break a broom if do not damage its rods first. The long-awaited decision of Germany’s constitutional court on the legacy of the European QE has become a shock for financial markets. It has undermined the ECB independence and increased the EU break-up. The first broken rod has become Italy. Italy’s bond yield jumped as much as 17 basis points, widening the gap with their German counterparts to 250 basis points. Italian Finance Minister Roberto Gualtieri had to calm down the markets saying that the German court’s decision won’t stop ECB asset purchases.
The German constitutional court says that the ECB €2.7-trillion QE program, which started in 2015, is not direct financial assistance to the governments. However, it warns that the Bundesbank will stop buying government bonds if the ECB doesn’t fix the flaws in the QE program within three months. It seems that, when the ECB starts normalizing its monetary policy, it will also have to explain to the judges all negative effects of the interest rate hikes for the borrowers, the unemployed, and the governments, whose borrowing costs are to increase. Is it independence?
Another shock for the markets has been the news that the German top court has ruled that the decision of the European court on the QE legacy taken two years ago is beyond its legal powers. The German constitutional court, for the first time, has declared the ruling of the European court to be illegal. This undermines the EU uniform legal order, one of the most important achievements of the entire currency bloc. While the ECB is taking every measure to avert the euro-area fragmentation, Germany seems to be indulging the euro-area break-up.
The decision of the German Constitutional Court came at a difficult time, especially for the countries most affected by the pandemic. Being deep into the recession, Italy has already passed an initial set of stimulus measures for its economy worth €25 billion and is willing to acquire another package worth at least €55 billion. To fund the stimulus package, there will be used the resources raised in the debt market, and, if the ECB doesn’t buy the local bonds, borrowing costs will be increasing, which will set back the process of the GDP recovery.
While the Fed, the US administration and the Congress are taking every measure to support the U.S. economy, Germany’s judges limit the ECB power, threaten its independence and increase the risks of the euro-area fragmentation. In addition, the leaders of the euro-area governments fail to find a compromise on the fiscal stimulus. So, the EUR/USD drop looks natural. Especially since the drop in the ISM services PMI to the lowest level since 2009 and the contraction of the US foreign trade in April increase the demand for the US dollar as a safe-haven asset.
Limiting the ECB power, the German constitutional court sets a new barrier to the recovery of the euro-area GDP. The European economy will be weak for a long time. So, it is relevant to hold down the EUR/USD shorts entered at level 1.0965.
LiteFinance
Aussie smells the problems
A new round of trade wars may break the plans of the AUD/USD bulls
Has the idea of a faster recovery of China’s economy than that of the USA and Europe, suggesting one should bet on the currencies of the counties having close trade links with China, failed? In late March-early April, I strongly recommended buying the Australian dollar despite the opinion of the majority that suggested a gloomy outlook for the Australian economy and a further easing of the RBA’s ultra-easy monetary policy. Since then, the AUD/USD pair has risen by more than 6 figures. However, Trump’s attacks against China have broken the plans of the AUD buyers.
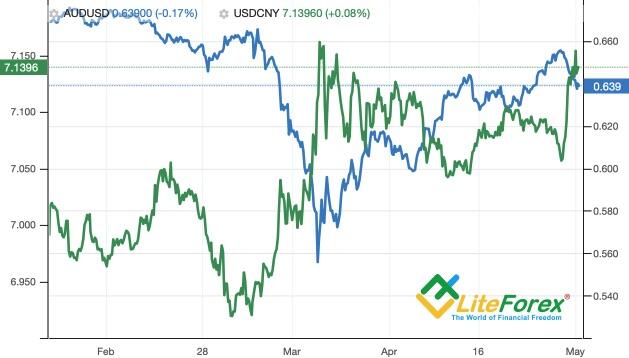
The US president obviously wants to win the upcoming presidential election in November, however, the recession and the crash in the stock market create strong barriers. If the S&P 500 trend has reversed up amid joint efforts of the Fed and the US administration, the V-shaped recovery of the US GDP could hardly be expected. Trump urgently needed to find someone to put the blame on, and he targeted China. The escalation of the US-China trade war will not only weigh on the global trade that is already rather weak, but it will also press down China’s economy and the yuan, which China’s government is struggling to stabilize now. The yuan’s drop amid the possibility of new import tariffs imposed by the USA send the AUD/USD down.
Yes, the Aussie looks vulnerable form the fundamental point of view. According to Bloomberg, there should be three consecutive quarters of declining gross domestic product, with Australia’s economy contracting by 9% from the fourth quarter of 2019, before a gradual recovery begins in the fourth quarter of 2020 (6% in 2020). It shouldn’t reach pre-outbreak levels of activity until the second half of 2022. Since December 2019, the number of unemployed Australians increased by 800,000 to 1.3 million-1.6 million. This is likely to result in the unemployment rate increase from 5.2% to 11% in the next few months. Such a level of unemployment was recorded during the last economic recession in the early 1990s.
However, the same situation is in most countries fighting with the coronavirus outbreak, and Australia’s fiscal stimulus (about 16% of GDP) is one of the biggest in the world, which suggests the economy’s rebound. The RBA didn’t take such aggressive measures as the Fed, which had launched the unlimited QE. It targeted the yield curve, like the Bank of Japan, which allowed it to stop buying out assets in the sixth week (the total purchase volume is just about AU$50 billion).
To sum up all the above, the hopes for the V-shaped recovery of China's economy, a huge fiscal stimulus, and a modest expansion of the RBA’s balance sheet pushed the AUD/USD up to its seven-week highs. However, the potential escalation of the US-China trade war changed the balance of power in the currency pair. If Donald Trump follows through the threats and starts actions, the AUD/USD should be falling deeper if the support at 0.635 is broken out. Otherwise, if the threat is not fulfilled, my forecast suggesting the Aussie’s growth to $0.675 and $0.69 should come true.
A new round of trade wars may break the plans of the AUD/USD bulls
Has the idea of a faster recovery of China’s economy than that of the USA and Europe, suggesting one should bet on the currencies of the counties having close trade links with China, failed? In late March-early April, I strongly recommended buying the Australian dollar despite the opinion of the majority that suggested a gloomy outlook for the Australian economy and a further easing of the RBA’s ultra-easy monetary policy. Since then, the AUD/USD pair has risen by more than 6 figures. However, Trump’s attacks against China have broken the plans of the AUD buyers.
The US president obviously wants to win the upcoming presidential election in November, however, the recession and the crash in the stock market create strong barriers. If the S&P 500 trend has reversed up amid joint efforts of the Fed and the US administration, the V-shaped recovery of the US GDP could hardly be expected. Trump urgently needed to find someone to put the blame on, and he targeted China. The escalation of the US-China trade war will not only weigh on the global trade that is already rather weak, but it will also press down China’s economy and the yuan, which China’s government is struggling to stabilize now. The yuan’s drop amid the possibility of new import tariffs imposed by the USA send the AUD/USD down.
Yes, the Aussie looks vulnerable form the fundamental point of view. According to Bloomberg, there should be three consecutive quarters of declining gross domestic product, with Australia’s economy contracting by 9% from the fourth quarter of 2019, before a gradual recovery begins in the fourth quarter of 2020 (6% in 2020). It shouldn’t reach pre-outbreak levels of activity until the second half of 2022. Since December 2019, the number of unemployed Australians increased by 800,000 to 1.3 million-1.6 million. This is likely to result in the unemployment rate increase from 5.2% to 11% in the next few months. Such a level of unemployment was recorded during the last economic recession in the early 1990s.
However, the same situation is in most countries fighting with the coronavirus outbreak, and Australia’s fiscal stimulus (about 16% of GDP) is one of the biggest in the world, which suggests the economy’s rebound. The RBA didn’t take such aggressive measures as the Fed, which had launched the unlimited QE. It targeted the yield curve, like the Bank of Japan, which allowed it to stop buying out assets in the sixth week (the total purchase volume is just about AU$50 billion).
To sum up all the above, the hopes for the V-shaped recovery of China's economy, a huge fiscal stimulus, and a modest expansion of the RBA’s balance sheet pushed the AUD/USD up to its seven-week highs. However, the potential escalation of the US-China trade war changed the balance of power in the currency pair. If Donald Trump follows through the threats and starts actions, the AUD/USD should be falling deeper if the support at 0.635 is broken out. Otherwise, if the threat is not fulfilled, my forecast suggesting the Aussie’s growth to $0.675 and $0.69 should come true.
LiteFinance
Dollar fooled the markets
The Fed managed to hide its pessimism behind the willingness to take active, aggressive measures
Try, try, and try again. Jerome Powell, at the press conference following the April FOMC meeting, did his best to keep the illusion of stability he had created. Federal Reserve Chairman noted that the central bank will take active, aggressive measures to shield the U.S. economy from the coronavirus, and patiently hold the interest rates around zero until the regulator is sure that the U.S. economy is heading for the high targets in the employment and price stability. In order to hold the S&P 500 bears back, the central bank has abandoned its principle of being independent of politics. The Fed’s didn’t use to call on the Congress for an increase in the fiscal stimulus, now it does, suggesting that the central bank needs help.
As the stock indexes have been up, the Fed seems to have reassured the markets, despite the change in its tone. In March, Jerome Powell spoke about a V-shaped rebound of the US economy. In April, he emphasized several times that there is hardly any hope for a quick rebound of the US GDP in the second half of 2020. The Fed is getting ready for a long struggle with the pandemic. During the next year or so, there will continue the uncertainty about the victory over the pandemic, the depth, and length of the economic downturn, the scale of the global shocks, and the recovery of the consumption and the domestic demand. In fact, even China, which has almost brought the COVID-19 under control, is giving away shopping vouchers to get people to go out and spend money again.
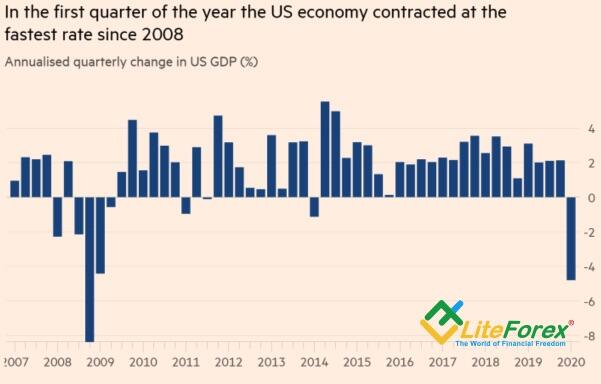
The downturn is deep. The US GDP lost 4.8% Q-o-Q, consumer expenditures featured the worst drop since 1980, the business investments were the lowest over 11 years. This looks incredible. In early March, the US economy was operating normally, and there were no signs that the longest economic expansion would end.
The worst is yet to come in the second quarter. According to Markit’s economic activity data, the US GDP should decline at a 37% annual rate, which will be the biggest drop since 1947.
In my opinion, Jerome Powell managed to clam down the markets and distract them form the change in the Fed’s stance. The US economy is likely to be U-shaped, so the 30% rally of the S&P 500 up form the March lows looks too strong.
Investors now switch their attention from the Fed to the ECB. After Fitch downgraded Italy’s credit rating, investors expect the Governing Council to take aggressive measures. When the euro-area governments fail to find a compromise on the fiscal stimulus, the ECB is likely to take the responsibility. If the European Central Bank doesn’t boost the QE pace in April, it may at least give a clue on such a step in the future.
The euro options market doesn’t expect any strong moves, and it seems to be right. The EUR/USD is stuck in the trading range of 1.08-1.09. Will Christine Lagarde make it be trending?
P.S. Did you like my article? Share it in social networks: it will be the best “thank you" :)
Ask me questions and comment below. I’ll be glad to answer your questions and give necessary explanations.
The Fed managed to hide its pessimism behind the willingness to take active, aggressive measures
Try, try, and try again. Jerome Powell, at the press conference following the April FOMC meeting, did his best to keep the illusion of stability he had created. Federal Reserve Chairman noted that the central bank will take active, aggressive measures to shield the U.S. economy from the coronavirus, and patiently hold the interest rates around zero until the regulator is sure that the U.S. economy is heading for the high targets in the employment and price stability. In order to hold the S&P 500 bears back, the central bank has abandoned its principle of being independent of politics. The Fed’s didn’t use to call on the Congress for an increase in the fiscal stimulus, now it does, suggesting that the central bank needs help.
As the stock indexes have been up, the Fed seems to have reassured the markets, despite the change in its tone. In March, Jerome Powell spoke about a V-shaped rebound of the US economy. In April, he emphasized several times that there is hardly any hope for a quick rebound of the US GDP in the second half of 2020. The Fed is getting ready for a long struggle with the pandemic. During the next year or so, there will continue the uncertainty about the victory over the pandemic, the depth, and length of the economic downturn, the scale of the global shocks, and the recovery of the consumption and the domestic demand. In fact, even China, which has almost brought the COVID-19 under control, is giving away shopping vouchers to get people to go out and spend money again.
The downturn is deep. The US GDP lost 4.8% Q-o-Q, consumer expenditures featured the worst drop since 1980, the business investments were the lowest over 11 years. This looks incredible. In early March, the US economy was operating normally, and there were no signs that the longest economic expansion would end.
The worst is yet to come in the second quarter. According to Markit’s economic activity data, the US GDP should decline at a 37% annual rate, which will be the biggest drop since 1947.
In my opinion, Jerome Powell managed to clam down the markets and distract them form the change in the Fed’s stance. The US economy is likely to be U-shaped, so the 30% rally of the S&P 500 up form the March lows looks too strong.
Investors now switch their attention from the Fed to the ECB. After Fitch downgraded Italy’s credit rating, investors expect the Governing Council to take aggressive measures. When the euro-area governments fail to find a compromise on the fiscal stimulus, the ECB is likely to take the responsibility. If the European Central Bank doesn’t boost the QE pace in April, it may at least give a clue on such a step in the future.
The euro options market doesn’t expect any strong moves, and it seems to be right. The EUR/USD is stuck in the trading range of 1.08-1.09. Will Christine Lagarde make it be trending?
P.S. Did you like my article? Share it in social networks: it will be the best “thank you" :)
Ask me questions and comment below. I’ll be glad to answer your questions and give necessary explanations.
LiteFinance
Fed and hall of mirrors
Investment ideas based on interaction between Fed and markets
According to economic theory, monetary policy is the key driver of asset price changes. Monetary expansion results in a decrease of the bond market’s rates. Capital raising costs drop, profitability grows. Positive corporate reports raise stock quotes. On the contrary, monetary restriction worsens companies’ financial results because of higher borrowing costs. In the real world, it often happens that it’s Fed that follows stock indexes and not the contrary. In 2004, former Fed Chair Ben Bernanke called the interaction between S&P 500 and the Central bank “hall of mirrors”.
Should prisoners be allowed to take control over a prison? The stock market must follow the Fed. Otherwise, the “don’t play against the Fed” principle would make no sense. Still, the markets work the best when market participants are under healthy fear of loss. People’s wisdom remains something to consider while FOMC officials are ordinary people who make mistakes. It is believed that stock indexes reflect the state of national economies. If so, the Fed’s officials tend to observe their signals and compare them with their own views.
If their views are different from the market’s opinion, the Committee has two ways to go, each of which implies problems. Adjusting monetary policy to S&P 500’s signals increases a risk of macroeconomic instability in future. Playing against the market increases economic turbulence.
The Fed has tried both ways. Jerome Powell and his colleagues dropped the federal funds rate by 150 base points in March 2020 in response to the fastest ever stock market decline. Also, they declared that treasuries and mortgage-backed securities would be bought in unlimited amounts.
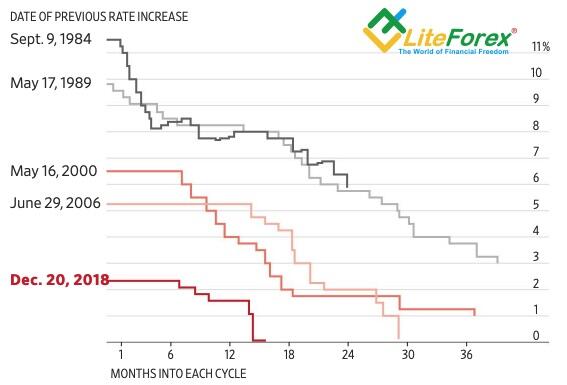
In December 2018, the Fed chairman said the current rate was far from being neutral. It resulted in a large stock market sell-off. The right communication saved the situation at the beginning of 2019: Powell corrected himself and emphasized the FOMC’s intention to take a pause. That allowed S&P 500 to claw back losses.
Ben Bernanke would mention the need to communicate with markets too. It was his way of solving disagreements between market signals and FOMC views. Communication is fundamental to the concept of “hall of mirrors” and allows for drawing a parallel with a psychological pathology, when a patient feels a vigorous desire to talk to his/her own reflection.
The Fed’s and financial markets’ views often coincided as well. Jerome Powell gave up the idea of further normalization of monetary policy in 2019, because the yield curve pointed to an upcoming recession. Back then, it was hard to imagine something that could harm the USA’s solid economy. The answer is now obvious: coronavirus.
What is the best way of profiting from the hall of mirrors? Finding mistakes in the Fed’s statements. For example, Powell asserted in early spring that the States would see a V-shape recovery. Together with a large monetary stimulus, that assertion allowed S&P 500 to grow 28% from the levels of March’s trough. Today, this assertion looks questionable while a change in the Fed’s views could lead to taking profits on US stocks.
Investment ideas based on interaction between Fed and markets
According to economic theory, monetary policy is the key driver of asset price changes. Monetary expansion results in a decrease of the bond market’s rates. Capital raising costs drop, profitability grows. Positive corporate reports raise stock quotes. On the contrary, monetary restriction worsens companies’ financial results because of higher borrowing costs. In the real world, it often happens that it’s Fed that follows stock indexes and not the contrary. In 2004, former Fed Chair Ben Bernanke called the interaction between S&P 500 and the Central bank “hall of mirrors”.
Should prisoners be allowed to take control over a prison? The stock market must follow the Fed. Otherwise, the “don’t play against the Fed” principle would make no sense. Still, the markets work the best when market participants are under healthy fear of loss. People’s wisdom remains something to consider while FOMC officials are ordinary people who make mistakes. It is believed that stock indexes reflect the state of national economies. If so, the Fed’s officials tend to observe their signals and compare them with their own views.
If their views are different from the market’s opinion, the Committee has two ways to go, each of which implies problems. Adjusting monetary policy to S&P 500’s signals increases a risk of macroeconomic instability in future. Playing against the market increases economic turbulence.
The Fed has tried both ways. Jerome Powell and his colleagues dropped the federal funds rate by 150 base points in March 2020 in response to the fastest ever stock market decline. Also, they declared that treasuries and mortgage-backed securities would be bought in unlimited amounts.
In December 2018, the Fed chairman said the current rate was far from being neutral. It resulted in a large stock market sell-off. The right communication saved the situation at the beginning of 2019: Powell corrected himself and emphasized the FOMC’s intention to take a pause. That allowed S&P 500 to claw back losses.
Ben Bernanke would mention the need to communicate with markets too. It was his way of solving disagreements between market signals and FOMC views. Communication is fundamental to the concept of “hall of mirrors” and allows for drawing a parallel with a psychological pathology, when a patient feels a vigorous desire to talk to his/her own reflection.
The Fed’s and financial markets’ views often coincided as well. Jerome Powell gave up the idea of further normalization of monetary policy in 2019, because the yield curve pointed to an upcoming recession. Back then, it was hard to imagine something that could harm the USA’s solid economy. The answer is now obvious: coronavirus.
What is the best way of profiting from the hall of mirrors? Finding mistakes in the Fed’s statements. For example, Powell asserted in early spring that the States would see a V-shape recovery. Together with a large monetary stimulus, that assertion allowed S&P 500 to grow 28% from the levels of March’s trough. Today, this assertion looks questionable while a change in the Fed’s views could lead to taking profits on US stocks.
LiteFinance
Pound set fire to fleet
When all the major currencies are exposed to the risks, the market is dwelling on the global risk appetite
The pound’s strength looks surprising. The domestic data are extremely poor, the Brexit matter hasn’t been settled down, Boris Johnson’s government is not willing to extend the transitions period, and the coronavirus fallout can damage the UK economy more than the previous global financial crisis. The BoE forecasts the UK GDP should drop by 35% in the second quarter. Nonetheless, despite all the negative factors, the GBP/USD rose up from the bottom of the consolidation range 1.22-1.26 and is now driving up to its top.
Bad news for the sterling started form the inflation report, the UK inflation rate was down from 1.7% to 1.5% amid a substantial decline in the domestic demand due to the pandemic, and it is likely to be moving down from its 2% target. The far, the worse. The UK composite PMI was down to a record low (12.6) in March, the retail sales featured the worst crash ever (-5.1% M-o-M). The GFK’s UK consumer confidence held at its lowest since 2009 this month after tumbling in late March. As a result, the UK economic surprise index is falling, however, the GBP/USD bulls are going ahead.
Earlier, the pound’s buyers hoped that the UK and the EU will reach a compromise on Brexit, or the transitions period will be at least extended. In April, there are hardly any hopes for the better. According to, Michael Gove, Cabinet Office minister, “whenever a deadline was extended, the light at the end of the tunnel was replaced by more tunnel”. The longer is the transition period, the more money will the UK contribute to the EU’s budget, and it will need to follow the EU rules, which are likely to be rejected in sovereignty.
Therefore, despite the horrible domestic data and swampy political environment in the UK, the sterling continues rising. The pound’s strength seems even more surprising if you look at the speculative positions on the pound. Over six consecutive weeks, hedge funds were exiting longs on the GBP, the market turned bearish on the British currency for the first time since December 2019.
What's the matter? Could the GBP/USD crash in March be so deep, that the bad news has been priced? I think it makes some sense. However, this is not the only reason for the pound’s resilience. When the economic situation is almost equally grim across the globe, markets are more fixated on swings in sentiment and risk appetite. Many investors think that the Brexit is a tiny reason compared to the coronavirus and recession, so they buy the sterling expecting the economies to reopen soon in the USA and UK, which should support the S&P 500 and press down the U.S. dollar.
Nonetheless, weak domestic data and continuous political uncertainty are the factors that limit the GBP/USD rally. Therefore, I still stick to my previous forecast suggesting the pair’s middle-term consolidation in the range of 1.22-1.26.
When all the major currencies are exposed to the risks, the market is dwelling on the global risk appetite
The pound’s strength looks surprising. The domestic data are extremely poor, the Brexit matter hasn’t been settled down, Boris Johnson’s government is not willing to extend the transitions period, and the coronavirus fallout can damage the UK economy more than the previous global financial crisis. The BoE forecasts the UK GDP should drop by 35% in the second quarter. Nonetheless, despite all the negative factors, the GBP/USD rose up from the bottom of the consolidation range 1.22-1.26 and is now driving up to its top.
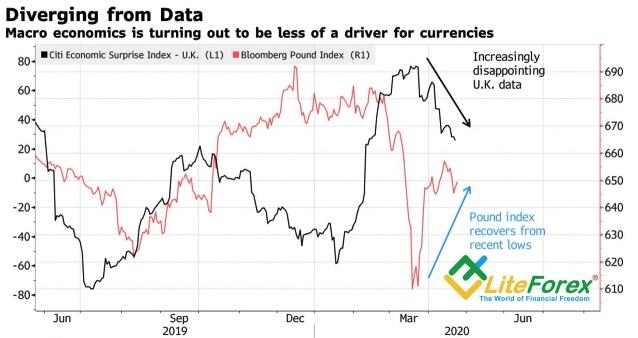
Bad news for the sterling started form the inflation report, the UK inflation rate was down from 1.7% to 1.5% amid a substantial decline in the domestic demand due to the pandemic, and it is likely to be moving down from its 2% target. The far, the worse. The UK composite PMI was down to a record low (12.6) in March, the retail sales featured the worst crash ever (-5.1% M-o-M). The GFK’s UK consumer confidence held at its lowest since 2009 this month after tumbling in late March. As a result, the UK economic surprise index is falling, however, the GBP/USD bulls are going ahead.
Earlier, the pound’s buyers hoped that the UK and the EU will reach a compromise on Brexit, or the transitions period will be at least extended. In April, there are hardly any hopes for the better. According to, Michael Gove, Cabinet Office minister, “whenever a deadline was extended, the light at the end of the tunnel was replaced by more tunnel”. The longer is the transition period, the more money will the UK contribute to the EU’s budget, and it will need to follow the EU rules, which are likely to be rejected in sovereignty.
Therefore, despite the horrible domestic data and swampy political environment in the UK, the sterling continues rising. The pound’s strength seems even more surprising if you look at the speculative positions on the pound. Over six consecutive weeks, hedge funds were exiting longs on the GBP, the market turned bearish on the British currency for the first time since December 2019.
What's the matter? Could the GBP/USD crash in March be so deep, that the bad news has been priced? I think it makes some sense. However, this is not the only reason for the pound’s resilience. When the economic situation is almost equally grim across the globe, markets are more fixated on swings in sentiment and risk appetite. Many investors think that the Brexit is a tiny reason compared to the coronavirus and recession, so they buy the sterling expecting the economies to reopen soon in the USA and UK, which should support the S&P 500 and press down the U.S. dollar.
Nonetheless, weak domestic data and continuous political uncertainty are the factors that limit the GBP/USD rally. Therefore, I still stick to my previous forecast suggesting the pair’s middle-term consolidation in the range of 1.22-1.26.
LiteFinance
Forex on M2 highway
Peculiarities of M2 pattern’s formation and use
It is believed that Forex quotes move within price channels. The price channels are plotted through extremums. If the formation of extremums is accompanied with MACD divergence, traders may get prepared for an upcoming trend reversal. A series of conditions must be observed for buying what is cheap or selling what is expensive. One of the patterns that use a combination of price channels, extremums and divergence is M2.
The pattern works best on the H1 time frame. The obligatory conditions for M2’s formation in a bearish market are:
1. Two decreasing minimums, with the second one located below the previous one;
2. The minimums must form on different trading days;
3. The previous trend must be at least 2 times bigger that the pattern itself.
If the conditions are observed, we can plot a price channel using the two minimums and a corrective maximum. MACD divergence and the channel’s width serve as confirming signals. It is desirable that the channel should be larger than the previous trend.
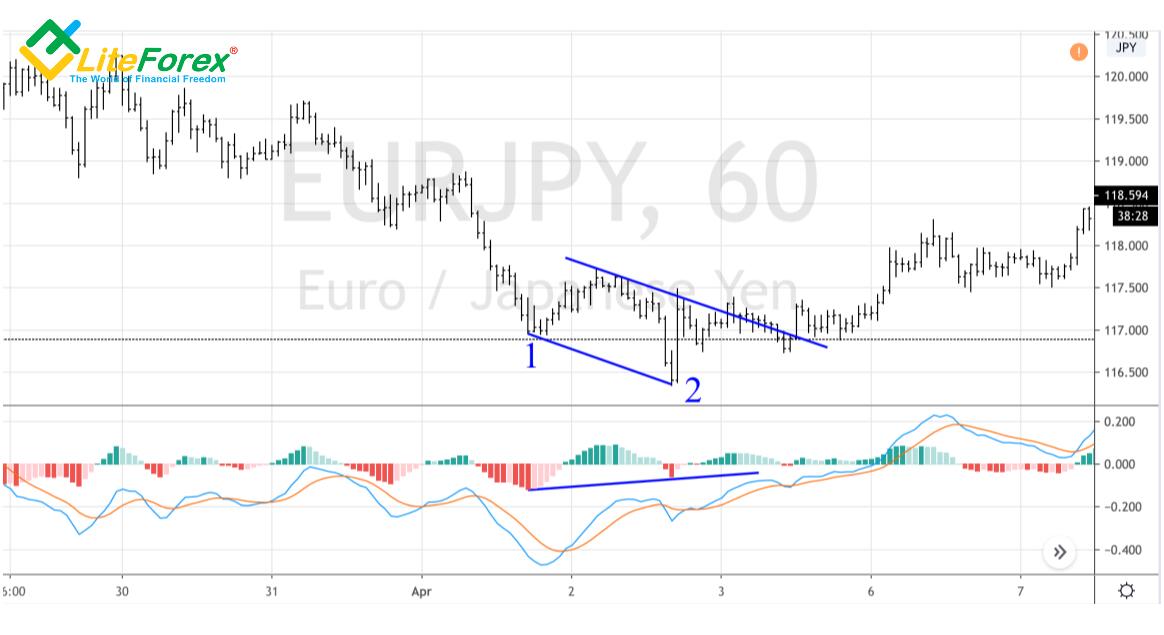
M2 pattern in EUR/JPY chart
LiteForex: M2: efficient Forex pattern
To buy EUR/JPY, pay attention to the bars closed above the upper limit of the key trading channel and to the retest of diagonal support with subsequent growth of quotes. A stop order should be placed at the level of the lower second minimum with a few points in reserve.
Opening a position based on M2 pattern
LiteForex: M2: efficient Forex pattern
To exit a long position, the authors suggest using Fibonacci channels and a position management method, according to which a trader should fix a part of profits upon reaching a new target level. It’s usually 20-40% of a trade’s volume, that’s why the M2 pattern is often called “20-40”. In fact, new extremums and reversal patterns constantly appear in the market. They help determine correctly the moment when a target is reached.
Setting targets based on M2 pattern
LiteForex: M2: efficient Forex pattern
As for our EUR/JPY example, on the H1 time frame there appeared signals to sell. They point to the end of the corrective movement and to the upcoming recovery of a downtrend. Is it possible to neglect the third obligatory condition that says the volume of a short-term trend should be at least 2 times bigger than the value of M2 pattern? It’s a trader who needs to make such a decision. And I think we may neglect that condition considering the sellers’ mass comeback.
When it comes to short positions, a stop loss is placed at the level of the last extremum too. In this case, I mean the level of the highest maximum with a few points in reserve. Price targets are set according to Fib channels. As the quotes of EUR/JPY move south, a trader fixes a part of profits.
Selling EUR/JPY based on M2 pattern
LiteForex: M2: efficient Forex pattern
In my opinion, the M2 pattern is efficient, but it’s rather a variety of the Anti-Turtles pattern. It was used by Larry Williams, Linda Raschke (Turtle soup, “Turtle soup+1”), Victor Sperandeo (2B trading system “Bottom/top”) and other successful traders.
Let’s pay tribute to the authors of M2 pattern: working with price channels is good for swing trading. What’s more, the more entry points we have the higher chance that the pattern will be efficient for us. We are all different and finding a strategy that suits us is sometimes harder than learning to profit from it.
Peculiarities of M2 pattern’s formation and use
It is believed that Forex quotes move within price channels. The price channels are plotted through extremums. If the formation of extremums is accompanied with MACD divergence, traders may get prepared for an upcoming trend reversal. A series of conditions must be observed for buying what is cheap or selling what is expensive. One of the patterns that use a combination of price channels, extremums and divergence is M2.
The pattern works best on the H1 time frame. The obligatory conditions for M2’s formation in a bearish market are:
1. Two decreasing minimums, with the second one located below the previous one;
2. The minimums must form on different trading days;
3. The previous trend must be at least 2 times bigger that the pattern itself.
If the conditions are observed, we can plot a price channel using the two minimums and a corrective maximum. MACD divergence and the channel’s width serve as confirming signals. It is desirable that the channel should be larger than the previous trend.
M2 pattern in EUR/JPY chart
LiteForex: M2: efficient Forex pattern
To buy EUR/JPY, pay attention to the bars closed above the upper limit of the key trading channel and to the retest of diagonal support with subsequent growth of quotes. A stop order should be placed at the level of the lower second minimum with a few points in reserve.
Opening a position based on M2 pattern
LiteForex: M2: efficient Forex pattern
To exit a long position, the authors suggest using Fibonacci channels and a position management method, according to which a trader should fix a part of profits upon reaching a new target level. It’s usually 20-40% of a trade’s volume, that’s why the M2 pattern is often called “20-40”. In fact, new extremums and reversal patterns constantly appear in the market. They help determine correctly the moment when a target is reached.
Setting targets based on M2 pattern
LiteForex: M2: efficient Forex pattern
As for our EUR/JPY example, on the H1 time frame there appeared signals to sell. They point to the end of the corrective movement and to the upcoming recovery of a downtrend. Is it possible to neglect the third obligatory condition that says the volume of a short-term trend should be at least 2 times bigger than the value of M2 pattern? It’s a trader who needs to make such a decision. And I think we may neglect that condition considering the sellers’ mass comeback.
When it comes to short positions, a stop loss is placed at the level of the last extremum too. In this case, I mean the level of the highest maximum with a few points in reserve. Price targets are set according to Fib channels. As the quotes of EUR/JPY move south, a trader fixes a part of profits.
Selling EUR/JPY based on M2 pattern
LiteForex: M2: efficient Forex pattern
In my opinion, the M2 pattern is efficient, but it’s rather a variety of the Anti-Turtles pattern. It was used by Larry Williams, Linda Raschke (Turtle soup, “Turtle soup+1”), Victor Sperandeo (2B trading system “Bottom/top”) and other successful traders.
Let’s pay tribute to the authors of M2 pattern: working with price channels is good for swing trading. What’s more, the more entry points we have the higher chance that the pattern will be efficient for us. We are all different and finding a strategy that suits us is sometimes harder than learning to profit from it.
LiteFinance
Oil got into trouble
One can get into history or trouble. Oil is in trouble
These are extraordinary times we live in! If in the 20th century, someone had said that the central banks’ interest rates and oil prices could fall into the negative area, he or she would have been laughed at. At the end of the second decade of the 21st century, financial markets are used to negative borrowing costs, and now the WTI spot rate is negative, - $37 per barrel! Of course, technical factors have played a part, but the drop in the USCrude into the negative is natural form a fundamental point of view either. There is so much oil, and nobody wants it anymore.
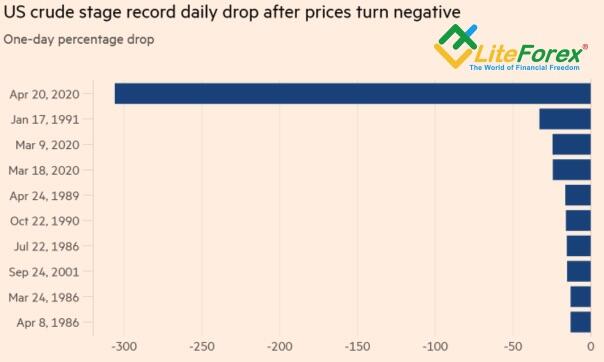
Trade session on April 20 will get into history. The oil crash has never been so sharp. The WTI price is below zero for the first time in history. Traders, who hold the oil futures at the time of their expiration, have two ways out. They can either physically deliver the asset or fulfill the contract obligations through a reverse transaction. Having no storage to hoard oil, most holders of contracts for May have selected the second way, which resulted in mass sales.
Daily changes in WTI rates
Source: Financial Times.
Oil negative prices revealed the state of the modern oil market in the era of the pandemic, the most important commodity in the world is losing its value, as excess supply results in the filling of reservoirs, pipelines, and tankers. There is less and less storage for oil, which should result in the oil production cut. According to the US Energy Information Administration. Crude stockpiles at Cushing have jumped 48% to almost 55 million barrels since the end of February. The hub has a working storage capacity of 76 million barrels, and it will be completely full by May if the current production pace is kept.
UnlikeWTI, Brent is a seaborne crude allowing traders to easily ship it to areas of higher demand. However, the fact that there are fewer and fewer places to store it, increases the number of floating tankers full of oil and presses oil prices down.
Obviously, the OPEC + agreement to cut global crude output by 9.7 barrels per day hasn’t satisfied the market. If the USA, Russia, and Saudi Arabia can’t stabilize the oil market, the market will force to do it. First of all, through a cut of the US crude oil production. In the week through April 17, according to Baker Hughes data, the number of active oil rigs in the US has dropped the most since 2015, the value has decreased by more than a third over the past month. It must be followed by curtailed US supply. Besides, following the price drop, Saudi Arabia is willing to immediately fulfill the obligations under the OPEC + agreement to cut global oil production. Saudi Arabian Oil Co. has said it will cut output from 12.3 million barrels per day to 8.5 million barrels a day. Donald Trump will consider reducing oil imports from Saudi Arabia, as “We certainly have plenty of oil,” said the US president.
Crude oil rigs and crude oil production in the USA
LiteForex: USCrude forecast for 21.04.2020
Source: Trading Economics
The super-contango existing in the oil market signals that, in the medium-term and long-term outlook, both Brent and WTI will tend toward a V-shaped recovery. On the one hand, along with the global economic rebound, the demand for oil will also be rising. On the other hand, crude oil production will be cut in the USA and other G20 countries. This gives a good chance to sell the USD/CAD, USD/NOK, and USD/RUB on the rise. We only need to live through a short-term shock.
One can get into history or trouble. Oil is in trouble
These are extraordinary times we live in! If in the 20th century, someone had said that the central banks’ interest rates and oil prices could fall into the negative area, he or she would have been laughed at. At the end of the second decade of the 21st century, financial markets are used to negative borrowing costs, and now the WTI spot rate is negative, - $37 per barrel! Of course, technical factors have played a part, but the drop in the USCrude into the negative is natural form a fundamental point of view either. There is so much oil, and nobody wants it anymore.
Trade session on April 20 will get into history. The oil crash has never been so sharp. The WTI price is below zero for the first time in history. Traders, who hold the oil futures at the time of their expiration, have two ways out. They can either physically deliver the asset or fulfill the contract obligations through a reverse transaction. Having no storage to hoard oil, most holders of contracts for May have selected the second way, which resulted in mass sales.
Daily changes in WTI rates
Source: Financial Times.
Oil negative prices revealed the state of the modern oil market in the era of the pandemic, the most important commodity in the world is losing its value, as excess supply results in the filling of reservoirs, pipelines, and tankers. There is less and less storage for oil, which should result in the oil production cut. According to the US Energy Information Administration. Crude stockpiles at Cushing have jumped 48% to almost 55 million barrels since the end of February. The hub has a working storage capacity of 76 million barrels, and it will be completely full by May if the current production pace is kept.
UnlikeWTI, Brent is a seaborne crude allowing traders to easily ship it to areas of higher demand. However, the fact that there are fewer and fewer places to store it, increases the number of floating tankers full of oil and presses oil prices down.
Obviously, the OPEC + agreement to cut global crude output by 9.7 barrels per day hasn’t satisfied the market. If the USA, Russia, and Saudi Arabia can’t stabilize the oil market, the market will force to do it. First of all, through a cut of the US crude oil production. In the week through April 17, according to Baker Hughes data, the number of active oil rigs in the US has dropped the most since 2015, the value has decreased by more than a third over the past month. It must be followed by curtailed US supply. Besides, following the price drop, Saudi Arabia is willing to immediately fulfill the obligations under the OPEC + agreement to cut global oil production. Saudi Arabian Oil Co. has said it will cut output from 12.3 million barrels per day to 8.5 million barrels a day. Donald Trump will consider reducing oil imports from Saudi Arabia, as “We certainly have plenty of oil,” said the US president.
Crude oil rigs and crude oil production in the USA
LiteForex: USCrude forecast for 21.04.2020
Source: Trading Economics
The super-contango existing in the oil market signals that, in the medium-term and long-term outlook, both Brent and WTI will tend toward a V-shaped recovery. On the one hand, along with the global economic rebound, the demand for oil will also be rising. On the other hand, crude oil production will be cut in the USA and other G20 countries. This gives a good chance to sell the USD/CAD, USD/NOK, and USD/RUB on the rise. We only need to live through a short-term shock.
LiteFinance

Dollar changed the tone
Donald Trump remembers the benefits of a strong currency
In April, investors see a new reality, the stock indexes are rising despite the US horrible macrostatistics and corporate reporting. For the first time since early February, the S&P 500 has been growing for two consecutive trading weeks, the Dow Jones Industrial Average performed the best 2-week rally since 1938, and the Nasdaq reduced losses from the beginning of the year to 3.6%. The desire to buy something at a cheap price, increase the proportion of the technology companies’ shares in the portfolios and the trust in the Federal Reserve are stronger than the recession and the difficult epidemiological situation.
Do not go against the Fed. This rule seems to have been forgotten in March when the central bank cut the interest rates abruptly and announced its willingness to buy an unlimited amount of Treasuries and mortgage-backed securities. Markets have remembered this rule in April. Black Rock, which manages $6.5 trillion, is going to buy those foreign assets that will be acquired by the central banks of the countries of origin of these assets. According to most investors, it makes no sense to struggle with the Fed, and, due to a huge monetary stimulus, corporate profits will rebound in 2021.
Dynamics of S&P 500
LiteForex: EURUSD forecast for 20.04.2020
Source: Bloomberg
If the US stocks were rising earlier due to the combination of stimulating measures and hopes that the coronavirus outbreak will be brought under control, then the bull stock markets in the week through April 17 resulted from the growing confidence in a soon reopening of the US economy. Many believe in a V-shaped recovery of the US GDP and are trying to be proactive in buying stocks.
However, Federal Reserve Bank of New York President John Williams said Friday that even a swift resolution to the coronavirus pandemic is unlikely to bring a fast recovery to the U.S. economy. “It is going to take longer to get us back to where we want to be”, he said. Furthermore, some support programs, including the $350-billion small-businesses aid program, have almost been exhausted, and the Congress may oppose boosting the package of stimulating measures.
I should note that, despite the growth of the S&P 500, investors, unlike earlier, are not willing to sell the greenback. It isn’t now determined by stock indexes, as the other major currencies are weak. For example, the EUR/USD bulls were frightened by the French president, Emmanuel Macron, who says that the European Union may splinter if it fails to share the crisis costs; the coronavirus indicated the euro’s flaws. Some analysts say the €1.5-trillion monetary and fiscal stimulusmay not be enough. The ECB may increase QE volume.
The greenback was supported by Donald Trump’s speech. Earlier, the US president used to enumerate the disadvantages of a too-strong dollar and suggested it should be weakened. Now, he remembers the benefits of the strong local currency. According to the US president, strong US currency encourages foreign investors to invest in US assets. And the USA, having low, close to zero, borrowing costs, should get use out of it. “The dollar is very strong,” he said at a press conference on Friday. “And the dollars – solid dollars are generally very good.” An abrupt change in Trump’s tone increases the chance that the EUR/USD bears can break out the support at 1.081
LiteFinance
Brent Crude Oil: общий анализ
Текущая динамика
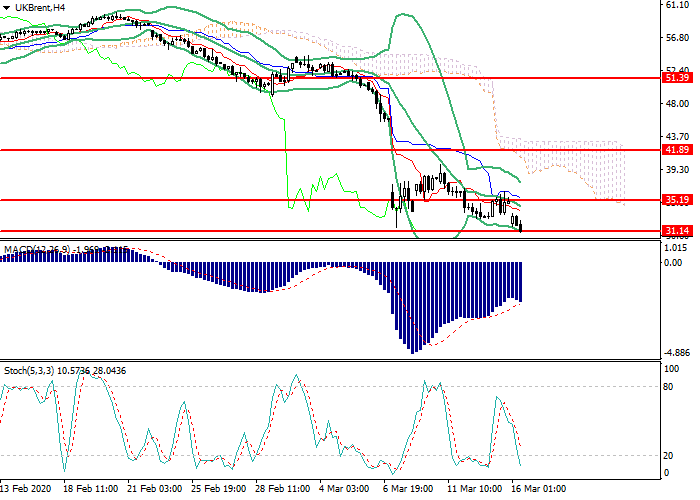
В последний раз цена нефти марки Brent торговалась на текущем уровне в январе 2016 года. Снижение спроса на фоне распространения коронавируса и ценовая война продолжают оказывать сильное давление на рынок углеводородов.
Экстренное снижение ключевой ставки ФРС пока не стало мерой для получения большего контроля над ситуацией. Американский регулятор пытается ограничить глобальное падение экономической активности из-за распространения коронавируса. В ближайшее время ФРС начнёт реализовывать политику количественного смягчения и дополнительные антикризисные меры для поддержания экономики. В любом случае, экономическая активность не будет восстанавливаться, пока динамика распространения вируса не начнёт снижаться, и поэтому с большой долей вероятности нефть продолжит падение.
В пятницу президент США Дональд Трамп заявил о намерении воспользоваться низкой ценой на нефть и скупить крупный объём сырья для пополнения стратегических запасов. Стоит отметить сложную ситуацию для американских компаний, добывающих сланцевую нефть: при текущей цене на «чёрное золото» они не смогут выжить без помощи государства.
Уровни поддержки и сопротивления
На четырёхчасовом графике инструмент тестирует нижнюю границу полос Боллинджера, которая выступает ключевым уровнем сопротивления. Индикатор направлен вниз, а ценовой диапазон ограничен, что указывает на нисходящую коррекцию. Гистограмма MACD удерживает сильный сигнал на продажу. Стохастик вошёл в область перепроданности, сильный сигнал на покупку ожидается в течение 1-2 дней.
Уровни сопротивления: 35.19, 41.90, 51.39.
Уровни поддержки: 31.14, 29.46, 26.74.
Торговые сценарии
Открывать короткие позиции следует от текущего уровня с целью 26.90 и стоп-лоссом 33.00.
Длинные позиции можно открывать выше отметки 35.50 с целью 41.90 и стоп-лоссом 33.25.
Срок реализации: 1-3 дня.
Текущая динамика
В последний раз цена нефти марки Brent торговалась на текущем уровне в январе 2016 года. Снижение спроса на фоне распространения коронавируса и ценовая война продолжают оказывать сильное давление на рынок углеводородов.
Экстренное снижение ключевой ставки ФРС пока не стало мерой для получения большего контроля над ситуацией. Американский регулятор пытается ограничить глобальное падение экономической активности из-за распространения коронавируса. В ближайшее время ФРС начнёт реализовывать политику количественного смягчения и дополнительные антикризисные меры для поддержания экономики. В любом случае, экономическая активность не будет восстанавливаться, пока динамика распространения вируса не начнёт снижаться, и поэтому с большой долей вероятности нефть продолжит падение.
В пятницу президент США Дональд Трамп заявил о намерении воспользоваться низкой ценой на нефть и скупить крупный объём сырья для пополнения стратегических запасов. Стоит отметить сложную ситуацию для американских компаний, добывающих сланцевую нефть: при текущей цене на «чёрное золото» они не смогут выжить без помощи государства.
Уровни поддержки и сопротивления
На четырёхчасовом графике инструмент тестирует нижнюю границу полос Боллинджера, которая выступает ключевым уровнем сопротивления. Индикатор направлен вниз, а ценовой диапазон ограничен, что указывает на нисходящую коррекцию. Гистограмма MACD удерживает сильный сигнал на продажу. Стохастик вошёл в область перепроданности, сильный сигнал на покупку ожидается в течение 1-2 дней.
Уровни сопротивления: 35.19, 41.90, 51.39.
Уровни поддержки: 31.14, 29.46, 26.74.
Торговые сценарии
Открывать короткие позиции следует от текущего уровня с целью 26.90 и стоп-лоссом 33.00.
Длинные позиции можно открывать выше отметки 35.50 с целью 41.90 и стоп-лоссом 33.25.
Срок реализации: 1-3 дня.
LiteFinance
NZD/USD: технический анализ
NZD/USD, D1
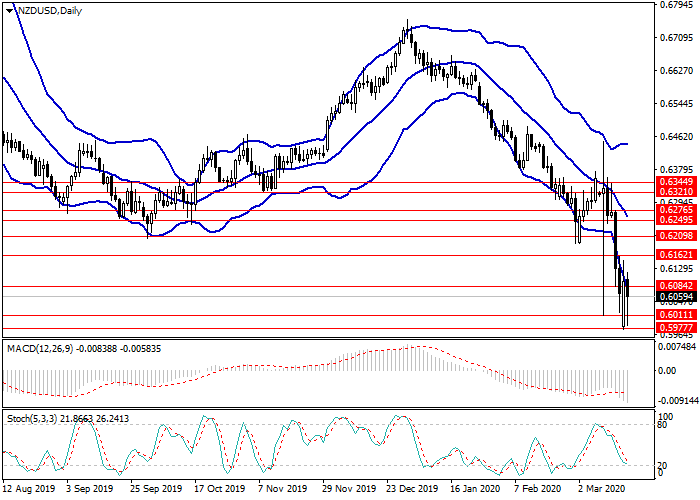
На дневном графике сохраняется нисходящий тренд. Инструмент тестирует на пробой нижнюю границу полос Боллинджера, облако индикатора расширено, что говорит о вероятном сохранении нисходящей динамики в среднесрочной перспективе. Гистограмма MACD находится в отрицательной области, сохраняя устойчивый сигнал к открытию коротких позиций. Стохастик находится в нейтральной зоне, на границе с зоной перепроданности, линии осциллятора направлены вниз, сохраняется сигнал к открытию ордеров на продажу.
Ключевые уровни
Уровни сопротивления: 0.6084, 0.6121, 0.6209, 0.6249.
Уровни поддержки: 0.6011, 0.5977, 0.5950.
Торговые сценарии
Короткие позиции можно открывать от уровня 0.6000 с целью 0.5950 и стоп-лоссом на уровне 0.6030.
Длинные позиции можно открывать от уровня 0.6085 с целью 0.6150. Стоп-лосс на уровне 0.6050.
Срок реализации: 1–3 дня.
NZD/USD, D1
На дневном графике сохраняется нисходящий тренд. Инструмент тестирует на пробой нижнюю границу полос Боллинджера, облако индикатора расширено, что говорит о вероятном сохранении нисходящей динамики в среднесрочной перспективе. Гистограмма MACD находится в отрицательной области, сохраняя устойчивый сигнал к открытию коротких позиций. Стохастик находится в нейтральной зоне, на границе с зоной перепроданности, линии осциллятора направлены вниз, сохраняется сигнал к открытию ордеров на продажу.
Ключевые уровни
Уровни сопротивления: 0.6084, 0.6121, 0.6209, 0.6249.
Уровни поддержки: 0.6011, 0.5977, 0.5950.
Торговые сценарии
Короткие позиции можно открывать от уровня 0.6000 с целью 0.5950 и стоп-лоссом на уровне 0.6030.
Длинные позиции можно открывать от уровня 0.6085 с целью 0.6150. Стоп-лосс на уровне 0.6050.
Срок реализации: 1–3 дня.
LiteFinance
EUR/USD: general review
Current trend
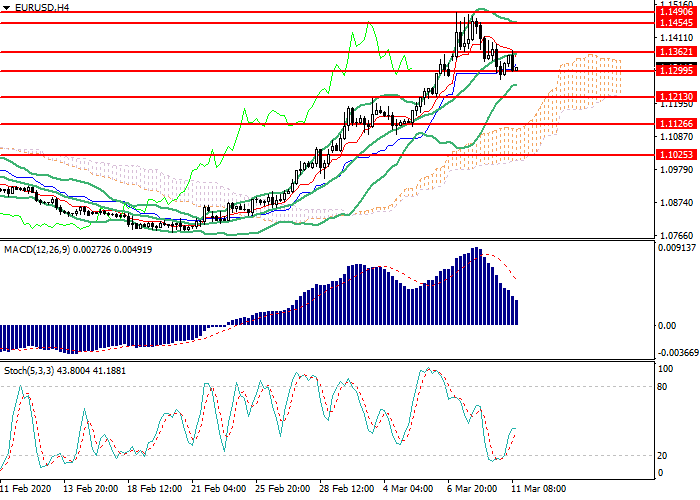
Yesterday, the instrument lost about 160 points, despite the restoration of Eurozone GDP.
Previously, the pair was supported by the expectation of the Fed rate reduction as a means of combating the negative effects of coronavirus. The ECB cannot implement such measures, and the expansion of the quantitative easing program remains the only tool. In addition, the spread of the virus in Europe is larger than in the USA, and the Eurozone economy struggles more. Yesterday, US President Donald Trump announced his intention to reduce taxes for working citizens until December 31. The bill still needs to be approved by Congress, but investors see that Washington has more resources to support the economy than the EU. Therefore, market participants significantly reduced the volume of long positions in anticipation of the ECB meeting, thereby exerting additional pressure.
Today at 14:30 (GMT+2), the US CPI will be published. Data may exceed the neutral forecast, strengthening USD. EU industrial output is due tomorrow at 12:00 (GMT+2). Other important events for the pair are the ECB meeting on monetary policy (tomorrow at 14:45 (GMT+2)), and the press conference at 15:30 (GMT+2).
Support and resistance
On the H4 chart, the instrument is testing a strong support level of 1.1300. Bollinger Bands are reversing downwards, and the price range remains unchanged indicating the formation of the downtrend. MACD histogram is decreasing in the positive zone, a weak buy signal is still relevant. Stochastic shows a correction in the equilibrium zone.
Resistance levels: 1.1362, 1.1454, 1.1490.
Support levels: 1.1300, 1.1213, 1.1126, 1.1025.
Trading tips
Short positions may be opened from the current level with the target at 1.1195 and stop-loss at 1.1365.
Long positions may be opened above 1.1365 with the target at 1.1460 and stop-loss at 1.1320.
Implementation time: 1-2 days.
EUR/USD: общий анализ
Текущая динамика
Вчера инструмент потерял порядка 160 пунктов, несмотря на восстановление темпов роста ВВП еврозоны.
Раньше пару поддерживало ожидание сокращения ставки ФРС как средства борьбы против негативного воздействия коронавируса. ЕЦБ не имеет возможности для реализации соответствующих мер, и единственным инструментом остаётся расширение программы количественного смягчения. Кроме того, в Европе распространение вируса имеет большие масштабы, чем в США, и экономика еврозоны находится в более тяжёлом положении. Вчера президент США Дональд Трамп заявил о намерении сократить налоги для работающих граждан до 31 декабря. Законопроект ещё необходимо провести через Конгресс, однако инвесторы видят, что Вашингтон имеет больше средств для поддержания экономики, чем ЕС. Поэтому участники рынка существенно сократили количество длинных позиций в преддверии заседания ЕЦБ, чем оказали дополнительное давление на инструмент.
Сегодня в 14:30 (GMT+2) ожидается публикация американского индекса потребительских цен. Учитывая рост продаж в розничных сетях, данные могут превзойти нейтральный прогноз, укрепив USD. Завтра в 12:00 (GMT+2) выйдут данные по промышленному производству в ЕС. Также важными событиями для пары являются заседание ЕЦБ по монетарной политике, запланированное на завтра в 14:45 (GMT+2), и последующая пресс-конференция в 15:30 GMT+2).
Уровни поддержки и сопротивления
На четырёхчасовом графике инструмент тестирует сильный уровень поддержки 1.1300. Полосы Боллинджера разворачиваются вниз, а ценовой диапазон остаётся неизменным, что указывает на формирование нисходящего тренда. Гистограмма MACD снижается в положительной зоне, слабый сигнал на покупку всё ещё актуален. Стохастик демонстрирует коррекцию в области равновесия.
Уровни сопротивления: 1.1362, 1.1454, 1.1490.
Уровни поддержки: 1.1300, 1.1213, 1.1126, 1.1025.
Торговые сценарии
Короткие позиции следует открывать от текущего уровня с целью 1.1195 и стоп-лоссом 1.1365.
Открывать длинные позиции можно выше отметки 1.1365 с целью 1.1460 и стоп-лоссом 1.1320.
Срок реализации: 1-2 дня.
Current trend
Yesterday, the instrument lost about 160 points, despite the restoration of Eurozone GDP.
Previously, the pair was supported by the expectation of the Fed rate reduction as a means of combating the negative effects of coronavirus. The ECB cannot implement such measures, and the expansion of the quantitative easing program remains the only tool. In addition, the spread of the virus in Europe is larger than in the USA, and the Eurozone economy struggles more. Yesterday, US President Donald Trump announced his intention to reduce taxes for working citizens until December 31. The bill still needs to be approved by Congress, but investors see that Washington has more resources to support the economy than the EU. Therefore, market participants significantly reduced the volume of long positions in anticipation of the ECB meeting, thereby exerting additional pressure.
Today at 14:30 (GMT+2), the US CPI will be published. Data may exceed the neutral forecast, strengthening USD. EU industrial output is due tomorrow at 12:00 (GMT+2). Other important events for the pair are the ECB meeting on monetary policy (tomorrow at 14:45 (GMT+2)), and the press conference at 15:30 (GMT+2).
Support and resistance
On the H4 chart, the instrument is testing a strong support level of 1.1300. Bollinger Bands are reversing downwards, and the price range remains unchanged indicating the formation of the downtrend. MACD histogram is decreasing in the positive zone, a weak buy signal is still relevant. Stochastic shows a correction in the equilibrium zone.
Resistance levels: 1.1362, 1.1454, 1.1490.
Support levels: 1.1300, 1.1213, 1.1126, 1.1025.
Trading tips
Short positions may be opened from the current level with the target at 1.1195 and stop-loss at 1.1365.
Long positions may be opened above 1.1365 with the target at 1.1460 and stop-loss at 1.1320.
Implementation time: 1-2 days.
EUR/USD: общий анализ
Текущая динамика
Вчера инструмент потерял порядка 160 пунктов, несмотря на восстановление темпов роста ВВП еврозоны.
Раньше пару поддерживало ожидание сокращения ставки ФРС как средства борьбы против негативного воздействия коронавируса. ЕЦБ не имеет возможности для реализации соответствующих мер, и единственным инструментом остаётся расширение программы количественного смягчения. Кроме того, в Европе распространение вируса имеет большие масштабы, чем в США, и экономика еврозоны находится в более тяжёлом положении. Вчера президент США Дональд Трамп заявил о намерении сократить налоги для работающих граждан до 31 декабря. Законопроект ещё необходимо провести через Конгресс, однако инвесторы видят, что Вашингтон имеет больше средств для поддержания экономики, чем ЕС. Поэтому участники рынка существенно сократили количество длинных позиций в преддверии заседания ЕЦБ, чем оказали дополнительное давление на инструмент.
Сегодня в 14:30 (GMT+2) ожидается публикация американского индекса потребительских цен. Учитывая рост продаж в розничных сетях, данные могут превзойти нейтральный прогноз, укрепив USD. Завтра в 12:00 (GMT+2) выйдут данные по промышленному производству в ЕС. Также важными событиями для пары являются заседание ЕЦБ по монетарной политике, запланированное на завтра в 14:45 (GMT+2), и последующая пресс-конференция в 15:30 GMT+2).
Уровни поддержки и сопротивления
На четырёхчасовом графике инструмент тестирует сильный уровень поддержки 1.1300. Полосы Боллинджера разворачиваются вниз, а ценовой диапазон остаётся неизменным, что указывает на формирование нисходящего тренда. Гистограмма MACD снижается в положительной зоне, слабый сигнал на покупку всё ещё актуален. Стохастик демонстрирует коррекцию в области равновесия.
Уровни сопротивления: 1.1362, 1.1454, 1.1490.
Уровни поддержки: 1.1300, 1.1213, 1.1126, 1.1025.
Торговые сценарии
Короткие позиции следует открывать от текущего уровня с целью 1.1195 и стоп-лоссом 1.1365.
Открывать длинные позиции можно выше отметки 1.1365 с целью 1.1460 и стоп-лоссом 1.1320.
Срок реализации: 1-2 дня.
LiteFinance
NZD/USD: technical analysis
NZD/USD, D1
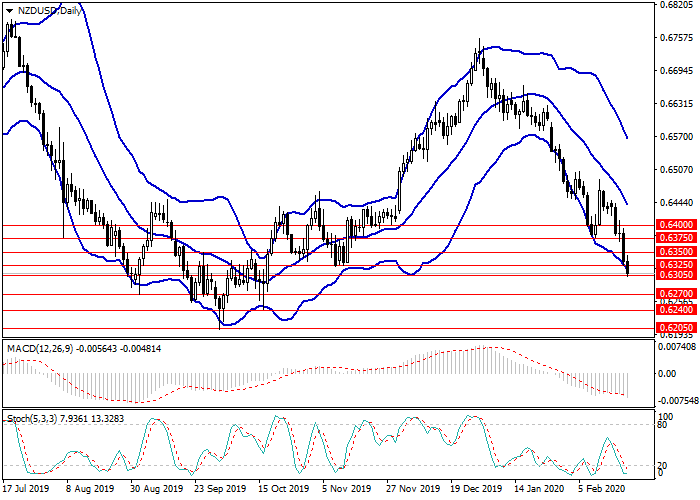
On the daily chart, a downtrend is maintained. The instrument is testing the lower border of the Bollinger Bands for a breakdown, and the indicator cloud is expanded. MACD histogram is in the negative zone, the signal line is crossing the body of the histogram from above forming a signal for opening short positions. Stochastic is on the border with the oversold zone, the oscillator signal line is directed downwards.
Key levels
Resistance levels: 0.6325, 0.6350, 0.6375, 0.6400.
Support levels: 0.6305, 0.6270, 0.6240, 0.6205.
Trading tips
Short positions may be opened from 0.6300 with target at 0.6240 and stop loss at 0.6330.
Long positions may be opened from 0.6350 with target at 0.6400. Stop loss – 0.6320.
Implementation time: 1-3 days.
NZD/USD, D1
On the daily chart, a downtrend is maintained. The instrument is testing the lower border of the Bollinger Bands for a breakdown, and the indicator cloud is expanded. MACD histogram is in the negative zone, the signal line is crossing the body of the histogram from above forming a signal for opening short positions. Stochastic is on the border with the oversold zone, the oscillator signal line is directed downwards.
Key levels
Resistance levels: 0.6325, 0.6350, 0.6375, 0.6400.
Support levels: 0.6305, 0.6270, 0.6240, 0.6205.
Trading tips
Short positions may be opened from 0.6300 with target at 0.6240 and stop loss at 0.6330.
Long positions may be opened from 0.6350 with target at 0.6400. Stop loss – 0.6320.
Implementation time: 1-3 days.
LiteFinance
EUR/USD: general analysis
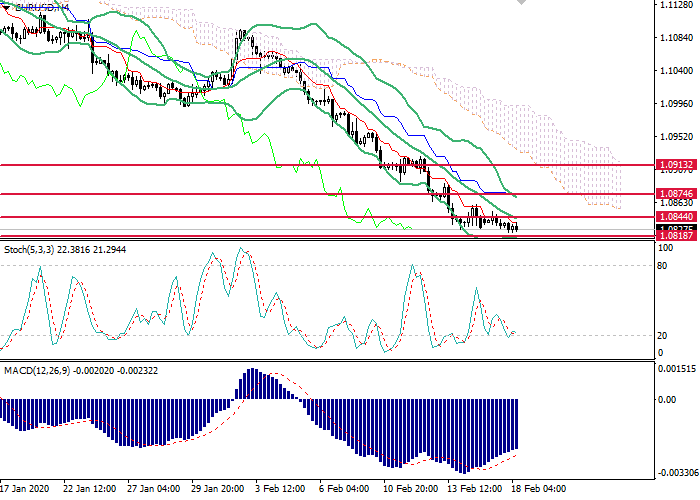
Current trend
On Monday, in the absence of significant macroeconomic releases, the EUR/USD pair continued to move within a moderate downtrend. Disappointing EU statistics, the possibility of introducing additional US duties against the EU, and the spread of coronavirus remain the main negative drivers.
An insignificant negative impact on the price was formed after yesterday's Eurogroup meeting. The forecast of the European Commission indicates a drop in the EU economy in 2020. Eurogroup Chairman Mario Centeno in his speech noted a decrease in trading risks, as well as Brexit risks. However, an outbreak of coronavirus poses a threat to EUR. Also, the ministers of economics and finance of European countries plan to ease the tax burden for entrepreneurs and the workforce. Traders did not hear anything new, while most investors focused on today’s German releases.
Today at 12:00 (GMT+2) German Current Conditions and Economic Sentiment will be published. Tomorrow at 15:30 (GMT+2), statistics on the US labor market, construction and inflation will be released. On Wednesday, a number of key Fed’s members will speak, and at 21:00 (GMT+2) Fed’s Meeting Minutes will be published.
Support and resistance
On a 4-hour chart, the instrument consolidates at the bottom of Bollinger bands. The indicator is directed downwards, and the price range is limited, which indicates a downward correction. MACD keeps a strong sell signal. Stochastic is preparing to enter the oversold zone; a strong buy signal is possible within 1–2 days.
Resistance levels: 1.0844, 1.0875, 1.0913.
Support levels: 1.0818, 1.0779, 1.0726, 1.0660.
Trading tips
Short positions may be opened from the current level with the target at 1.0735 and stop loss 1.0865.
Long positions may be opened above 1.0865 with the target at 1.0915 and stop loss 1.0840.
Implementation period: 1–2 days.
EUR/USD: общий анализ
Текущая динамика
В прошедший понедельник в отсутствии значимых макроэкономических релизов пара EUR/USD продолжила двигаться в рамках умеренного нисходящего тренда. Разочаровывающая статистика еврозоны, возможность введения дополнительных американских пошлин против ЕС, а также распространение коронавируса остаются основными драйверами давления на инструмент.
Несущественное негативное воздействие на цену сформировалось по итогам вчерашнего заседания Еврогруппы. Прогноз Еврокомиссии указывает на падение темпов роста экономики ЕС в 2020 году. Председатель Еврогруппы Марио Сентено в своём выступлении заметил снижение торговых рисков, а также рисков Brexit. Тем не менее, вспышка коронавируса несёт в себе угрозу для евро. Также министры экономики и финансов европейских стран планируют ослабление налоговой нагрузки для предпринимателей и рабочей силы. Участники рынка не услышали ничего нового, при этом большинство инвесторов сосредоточили своё внимание на немецком индексе экономических настроений ZEW, публикация которого запланирована на сегодня.
Сегодня в 12:00 (GMT+2) будут опубликованы данные по индексам текущих экономических условий и экономических настроений в Германии. Завтра в 15:30 (GMT+2) выйдет статистика по американскому рынку труда, строительству и инфляции. Кроме того, в среду пройдут выступления ряда ключевых членов ФРС, а в 21:00 (GMT+2) будет опубликован протокол последнего заседания регулятора.
Уровни поддержки и сопротивления
На 4-часовом графике инструмент консолидируется в нижней части полос Боллинджера. Индикатор направлен вниз, а ценовой диапазон ограничен, что указывает на наличие нисходящей коррекции. Гистограмма MACD удерживает сильный сигнал на продажу. Стохастик готовится войти в область перепроданности, сильный сигнал на покупку возможен в течение 1–2 дней.
Уровни сопротивления: 1.0844, 1.0875, 1.0913.
Уровни поддержки: 1.0818, 1.0779, 1.0726, 1.0660.
Торговые сценарии
Короткие позиции можно открывать от текущего уровня с целью 1.0735 и стоп-лоссом на уровне 1.0865.
Длинные позиции можно открывать выше уровня 1.0865 с целью 1.0915 и стоп-лоссом на уровне 1.0840.
Срок реализации: 1–2 дня.
LiteFinance
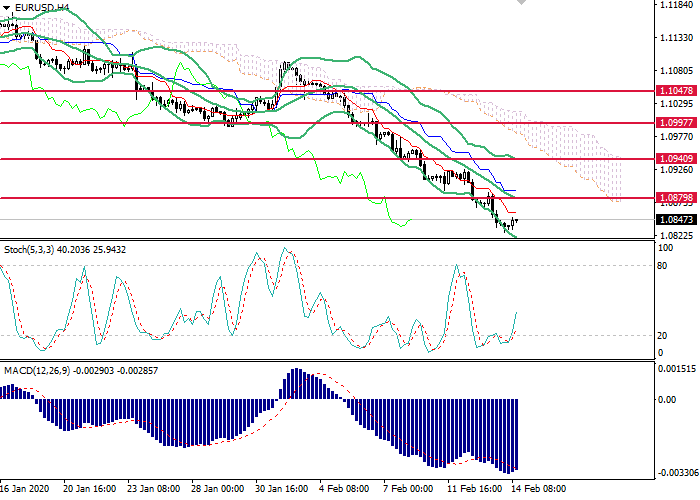
EUR/USD: general analysis
Current trend
The European currency is trading within the strong “bearish” trend this month. At the moment, the EUR/USD pair is near two-year lows, and the scenario for further decline seems most likely.
Eurozone statistics are deteriorating, while the slowdown in the manufacturing sector is one of the key drivers of pressure on the instrument. Industrial production occupies a significant part in the European economy, so the spread of the coronavirus poses a significant threat to the European currency. Today's GDP data, reflecting a 0.1% annual slowdown, confirm the presence of negative trends. In addition, the ECB insists on the need for low interest rates and is considering expanding its quantitative easing policy, while the Fed is pursuing a more stable monetary policy. Thus, the strong fundamental differences between the US and EU economies indicate a poor euro against the dollar.
Today at 15:30 (GMT+2), a number of major publications on retail sales in the USA are expected, and at 16:15 (GMT+2), statistics on industrial production volumes will be released.
Support and resistance
On the 4-hour chart, a downtrend correction is observed. The instrument falls along the lower border of Bollinger bands. The indicator is directed downwards, and the price range remains wide, which indicates a continuation of the downtrend. The MACD histogram keeps a strong sell signal. Stochastic left the oversold zone, maintaining a buy signal.
Resistance levels: 1.0880, 1.0940, 1.0997, 1.1047.
Support levels: 1.0816, 1.0745, 1.0685, 1.0560.
Trading tips
Short positions may be opened from the current level with the target at 1.0745 and stop loss 1.0885.
Long positions may be opened above the level of 1.0870 with the target at 1.0940 and stop loss 1.0840.
Implementation period: 1–3 days.
EUR/USD: общий анализ
Текущая динамика
Европейская валюта торгуется в рамках сильного «медвежьего» тренда в течение текущего месяца. В настоящий момент пара EUR/USD находится вблизи двухлетних минимумов, и сценарий дальнейшего снижения выглядит наиболее вероятным.
Статистика еврозоны ухудшается, при этом замедление производственного сектора является одним из ключевых драйверов давления на инструмент. Промышленное производство занимает существенную часть в европейской экономике, поэтому распространение коронавируса несёт в себе существенную угрозу для европейской валюты. Опубликованные сегодня данные по ВВП, отразившие замедление показателя на 0,1% в годовом выражении, подтверждают наличие негативных тенденций. Кроме того, ЕЦБ настаивает на необходимости низких процентных ставок и рассматривает возможность для расширения политики количественного смягчения, в то время как ФРС реализует более стабильную монетарную политику. Таким образом, сильные фундаментальные различия экономик США и ЕС указывают на слабость евро относительно доллара.
Сегодня в 15:30 (GMT+2) ожидается ряд важнейших публикаций по розничным продажам в США, а в 16:15 (GMT+2) выйдет статистика по объёмам промышленного производства.
Уровни поддержки и сопротивления
На 4-часовом графике наблюдается коррекция нисходящего тренда. Инструмент снижается вдоль нижней границы полос Боллинджера. Индикатор направлен вниз, а ценовой диапазон остаётся широким, что указывает на продолжение нисходящего тренда. Гистограмма MACD удерживает сильный сигнал на продажу. Стохастик покинул область перепроданности, сохранив сигнал на покупку.
Уровни сопротивления: 1.0880, 1.0940, 1.0997, 1.1047.
Уровни поддержки: 1.0816, 1.0745, 1.0685, 1.0560.
Торговые сценарии
Короткие позиции можно открывать от текущего уровня с целью 1.0745 и стоп-лоссом на уровне 1.0885.
Длинные позиции можно открывать выше уровня 1.0870 с целью 1.0940 и стоп-лоссом на уровне 1.0840.
Срок реализации: 1–3 дня.
LiteFinance
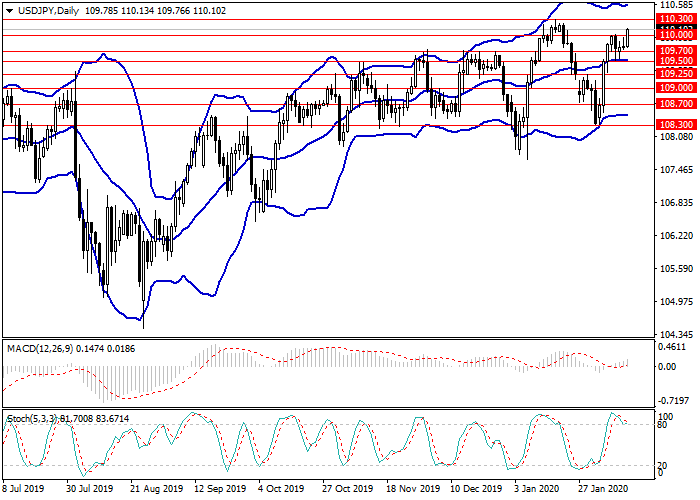
USD/JPY: technical analysis
USD/JPY, D1
On the D1 chart, a lateral trend remains. The instrument is being traded within the channel formed by the borders of Bollinger Bands, the indicator cloud is expanded. MACD histogram is near the zero level, its volumes are minimal; the signal line moves horizontally along the zero line without forming a clear signal to enter the market. Stochastic is in the overbought zone on the border with the neutral zone; the oscillator lines are reversing downwards.
Key levels
Support levels: 110.00, 109.70, 109.50, 109.25, 109.00, 108.70, 108.30.
Resistance levels: 110.30, 110.60.
Trading tips
Long positions may be opened from the current level with the target at 110.60 and stop-loss at 109.80.
Short positions may be opened from the level of 109.70 with the target at 109.25 and stop-loss at 110.00.
Implementation time: 1-3 days.
USD/JPY: технический анализ
USD/JPY, D1
На дневном графике сохраняется боковой тренд. Инструмент торгуется в рамках канала, сформированного границами полос Боллинджера, облако индикатора расширено. Гистограмма MACD находится в районе нулевой отметки, объёмы её минимальны, сигнальная линия движется горизонтально вдоль нулевой отметки, не формируя чёткого сигнала ко входу в рынок. Стохастик находится в зоне перекупленности на границе с нейтральной зоной, линии осциллятора разворачиваются вниз.
Ключевые уровни
Уровни поддержки: 110.00, 109.70, 109.50, 109.25, 109.00, 108.70, 108.30.
Уровни сопротивления: 110.30, 110.60.
Торговые сценарии
Длинные позиции можно открывать от текущего уровня с целью 110.60 и стоп-лоссом 109.80.
Короткие позиции можно открывать от уровня 109.70 с целью 109.25 и стоп-лоссом 110.00.
Срок реализации: 1-3 дня.
USD/JPY, D1
On the D1 chart, a lateral trend remains. The instrument is being traded within the channel formed by the borders of Bollinger Bands, the indicator cloud is expanded. MACD histogram is near the zero level, its volumes are minimal; the signal line moves horizontally along the zero line without forming a clear signal to enter the market. Stochastic is in the overbought zone on the border with the neutral zone; the oscillator lines are reversing downwards.
Key levels
Support levels: 110.00, 109.70, 109.50, 109.25, 109.00, 108.70, 108.30.
Resistance levels: 110.30, 110.60.
Trading tips
Long positions may be opened from the current level with the target at 110.60 and stop-loss at 109.80.
Short positions may be opened from the level of 109.70 with the target at 109.25 and stop-loss at 110.00.
Implementation time: 1-3 days.
USD/JPY: технический анализ
USD/JPY, D1
На дневном графике сохраняется боковой тренд. Инструмент торгуется в рамках канала, сформированного границами полос Боллинджера, облако индикатора расширено. Гистограмма MACD находится в районе нулевой отметки, объёмы её минимальны, сигнальная линия движется горизонтально вдоль нулевой отметки, не формируя чёткого сигнала ко входу в рынок. Стохастик находится в зоне перекупленности на границе с нейтральной зоной, линии осциллятора разворачиваются вниз.
Ключевые уровни
Уровни поддержки: 110.00, 109.70, 109.50, 109.25, 109.00, 108.70, 108.30.
Уровни сопротивления: 110.30, 110.60.
Торговые сценарии
Длинные позиции можно открывать от текущего уровня с целью 110.60 и стоп-лоссом 109.80.
Короткие позиции можно открывать от уровня 109.70 с целью 109.25 и стоп-лоссом 110.00.
Срок реализации: 1-3 дня.
LiteFinance

USD/CHF: technical analysis
USD/CHF, D1
An uptrend is forming on the daily chart. The instrument tests the upper border of the sideways channel formed by the boundaries of Bollinger bands, the indicator cloud expands. The MACD histogram is in the negative zone, gradually reducing volumes, the signal line has reversed upwards, a buy signal is being formed. Stochastic crosses the border of the overbought zone upwards, a signal to open long positions maintains
Key levels
Resistance levels: 0.9783, 0.9805, 0.9831.
Support levels: 0.9762, 0.9750, 0.9730, 0.9710, 0.9672.
Trading tips
Long positions may be opened from the current level with the target at 0.9830. Stop loss is 0.9750.
Short positions may be opened from the level of 0.9730 with the target at 0.9680 and stop loss of 0.9760.
Implementation period: 1–3 days.
USD/CHF: технический анализ
USD/CHF, D1
На дневном графике формируется восходящий тренд. Инструмент тестирует верхнюю границу бокового канала, сформированного границами полос Боллинджера, облако индикатора расширяется. Гистограмма MACD находится в отрицательной зоне, плавно сокращая объёмы, сигнальная линия развернулась вверх, формируется сигнал на покупку. Стохастик пересекает границу зоны перекупленности снизу вверх, сохраняется сигнал к открытию длинных позиций.
Ключевые уровни
Уровни сопротивления: 0.9783, 0.9805, 0.9831.
Уровни поддержки: 0.9762, 0.9750, 0.9730, 0.9710, 0.9672.
Торговые сценарии
Длинные позиции можно открывать от текущего уровня с целью 0.9830. Стоп-лосс на уровне 0.9750.
Короткие позиции можно открывать от уровня 0.9730 с целью 0.9680 и стоп-лоссом 0.9760.
Срок реализации: 1–3 дня.
USD/CHF, D1
An uptrend is forming on the daily chart. The instrument tests the upper border of the sideways channel formed by the boundaries of Bollinger bands, the indicator cloud expands. The MACD histogram is in the negative zone, gradually reducing volumes, the signal line has reversed upwards, a buy signal is being formed. Stochastic crosses the border of the overbought zone upwards, a signal to open long positions maintains
Key levels
Resistance levels: 0.9783, 0.9805, 0.9831.
Support levels: 0.9762, 0.9750, 0.9730, 0.9710, 0.9672.
Trading tips
Long positions may be opened from the current level with the target at 0.9830. Stop loss is 0.9750.
Short positions may be opened from the level of 0.9730 with the target at 0.9680 and stop loss of 0.9760.
Implementation period: 1–3 days.
USD/CHF: технический анализ
USD/CHF, D1
На дневном графике формируется восходящий тренд. Инструмент тестирует верхнюю границу бокового канала, сформированного границами полос Боллинджера, облако индикатора расширяется. Гистограмма MACD находится в отрицательной зоне, плавно сокращая объёмы, сигнальная линия развернулась вверх, формируется сигнал на покупку. Стохастик пересекает границу зоны перекупленности снизу вверх, сохраняется сигнал к открытию длинных позиций.
Ключевые уровни
Уровни сопротивления: 0.9783, 0.9805, 0.9831.
Уровни поддержки: 0.9762, 0.9750, 0.9730, 0.9710, 0.9672.
Торговые сценарии
Длинные позиции можно открывать от текущего уровня с целью 0.9830. Стоп-лосс на уровне 0.9750.
Короткие позиции можно открывать от уровня 0.9730 с целью 0.9680 и стоп-лоссом 0.9760.
Срок реализации: 1–3 дня.
LiteFinance
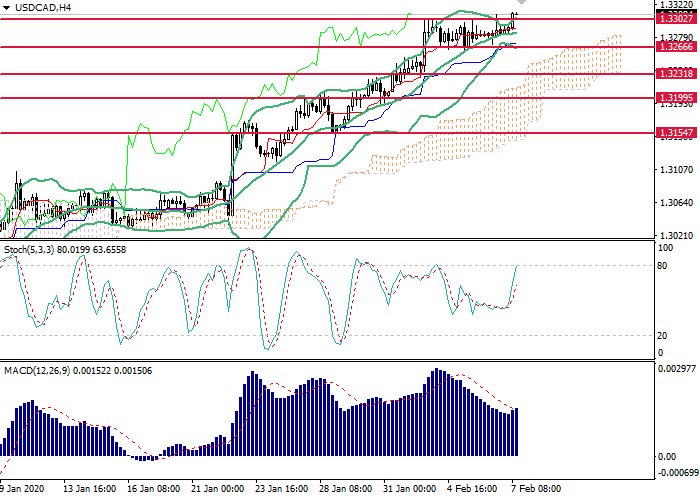
USD/CAD: general review
Current trend
This week, the pair has consolidated at highs since last December, pending employment data in the US and Canada.
Today, weak support to the instrument was provided by a significant reduction in China's trade balance. One could expect a larger growth, but this did not happen, which confirms the importance of today's employment statistics. US labor market data may further strengthen the US dollar. A strong report is indicated by: a reduction in the number of jobless claims (MoM); an increase in the non-farm payrolls from 199K to 291K (with a forecast of 156K), according to ADP data; growth of consumer confidence. Given all this, as well as a stable monetary policy and the strengthening of the position of President Donald Trump, investors expect USD to strengthen.
Data on the labor market in the US and Canada will be published today at 15:30 (GMT+2), and on business activity in Canada – at 17:00 (GMT + 2).
Support and resistance
On the H4 chart, the instrument is testing the upper border of Bollinger Bands, which is the key resistance level. The indicator is directed upwards, while the price range is expanding, indicating further growth. MACD histogram keeps a strong buy signal. Stochastic is approaching the oversold zone from below, a weak buy signal is relevant.
Support levels: 1.3266, 1.3231, 1.3200, 1.3154, 1.3057.
Resistance levels: 1.3300, 1.3346, 1.3390.
Trading tips
Long positions may be opened from the current level with the target at 1.3355 and stop-loss at 1.3270.
Short positions may be opened below the level of 1.3280 with the target at 1.3230 and stop-loss at 1.3295.
Implementation time: 1 day.
USD/CAD: общий анализ
Текущая динамика
На неделе пара консолидируется у максимумов с декабря прошлого года в ожидании данных по занятости в США и Канаде.
Сегодня несущественную поддержку инструменту оказало значительное сокращение сальдо торгового баланса Китая. Можно было бы ожидать более масштабного роста, однако этого не случилось, что подтверждает важность сегодняшней статистики по занятости. Данные по рынку труда США могут поспособствовать дальнейшему укреплению американского доллара. На сильный отчёт указывают: сокращение числа заявок на пособие по безработице в месячном выражении, увеличение числа трудоустроенных вне сельского хозяйства по данным ADP c 199 до 291 тысячи (при прогнозе 156 тысяч), рост доверия потребителей. Учитывая всё это, а также устойчивую монетарную политику и укрепление позиций президента Дональда Трампа, инвесторы ожидают укрепления USD.
Данные по рынку труда в США и Канаде будут опубликованы сегодня в 15:30 (GMT+2), а по деловой активности в Канаде – в 17:00 (GMT+2).
Уровни поддержки и сопротивления
На четырёхчасовом графике инструмент тестирует верхнюю границу полос Боллинджера, которая выступает ключевым уровнем сопротивления. Индикатор направлен вверх, а ценовой диапазон увеличивается, что указывает на дальнейший рост. Гистограмма MACD сохраняет сильный сигнал на покупку. Стохастик приближается к области перепроданности снизу, актуален слабый сигнал на покупку.
Уровни поддержки: 1.3266, 1.3231, 1.3200, 1.3154, 1.3057.
Уровни сопротивления: 1.3300, 1.3346, 1.3390.
Торговые сценарии
Длинные позиции следует открывать от текущего уровня с целью 1.3355 и стоп-лоссом 1.3270.
Открывать короткие позиции можно ниже отметки 1.3280 с целью 1.3230 и стоп-лоссом 1.3295.
Срок реализации: 1 день.
LiteFinance
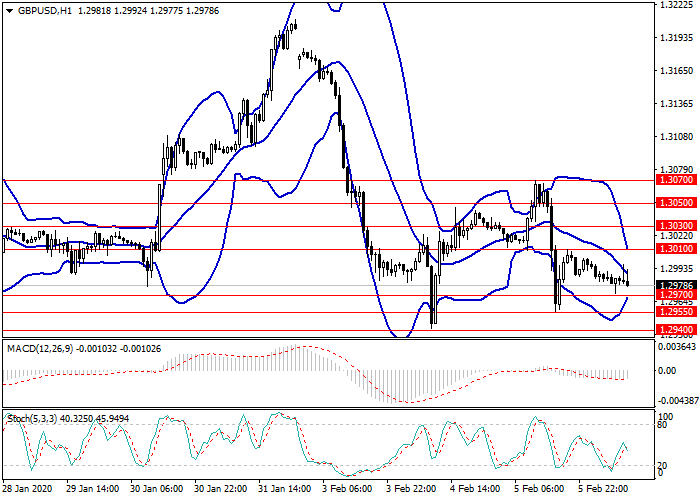
GBP/USD: general analysis
Current trend
GBP is under pressure from investors' doubts about the ability of the EU and the UK to agree on a deal before the end of the current calendar year. However, the parties may also extend the transition period in order to get more time to work out joint decisions. UK macroeconomic statistics released on Wednesday provided moderate support to the British currency. Thus, Markit Service PMI for January rose from 52.9 to 53.9 points with a constant forecast.
Macroeconomic statistics from the United States published on Wednesday were ambiguous but contributed to the further strengthening of the dollar. Thus, ISM Service PMI for January rose from 54.9 to 55.5 points against the forecast of growth to 55 points. ADP Nonfarm Payrolls data were also positive, which is traditionally published ahead of the release of the official US labor market report. It reflected a sharp increase in private sector employment in January by 291K jobs after an increase of 199K last month.
Today, the dynamics of the instrument may be affected by US Initial Jobless Claims data at 15:30 (GMT+2), as well as preliminary data on changes in labor productivity excluding agricultural machinery for the fourth quarter at 15:30 (GMT+2), moderate volatility is expected in the market.
Support and resistance
Resistance levels: 1.3010, 1.3030, 1.3050, 1.3070.
Support levels: 1.2970, 1.2955, 1.2940, 1.2900.
Trading tips
Short positions may be opened from 1.2955 with the target at 1.2905 and stop loss 1.2980.
Long positions may be opened from 1.3010 with the target at 1.3070 and stop loss 1.2980.
Implementation period: 1–3 days.
GBP/USD: общий анализ
Текущая динамика
Фунт находится под давлением, которое оказывают на валюту сомнения инвесторов относительно способности ЕС и Великобритании договориться по торговой сделке до конца текущего календарного года. Впрочем, стороны могут также продлить переходной период, чтобы дать себе больше времени на выработку совместных решений. Опубликованная в среду макроэкономическая статистика из Великобритании оказала британской валюте умеренную поддержку. Так, индекс деловой активности в секторе услуг от Markit в январе вырос с 52,9 до 53,9 пункта при неизменном прогнозе.
Опубликованная в среду макроэкономическая статистика из США оказалась смешанной, однако способствовала дальнейшему укреплению доллара. Так, индекс деловой активности в секторе услуг от ISM в январе вырос с 54,9 до 55,5 пункта при прогнозе о росте до 55 пунктов. Порадовал также и отчёт ADP по занятости, который традиционно публикуется в преддверии выхода официального отчёта по рынку труда США. Он отразил резкий рост занятости в частном секторе в январе на 291 тысячу рабочих мест после роста на 199 тысяч в прошлом месяце.
Сегодня на динамику инструмента могут повлиять данные из США по изменению числа первичных заявок на пособия по безработице в 15:30 (GMT+2), а также предварительные данные по изменению производительности труда без учёта с\х техники за четвёртый квартал в 15:30 (GMT+2), на рынке ожидается умеренная волатильность.
Уровни поддержки и сопротивления
Уровни сопротивления: 1.3010, 1.3030, 1.3050, 1.3070.
Уровни поддержки: 1.2970, 1.2955, 1.2940, 1.2900.
Торговые сценарии
Короткие позиции можно открывать от уровня 1.2955 с целью 1.2905 и стоп-лоссом 1.2980.
Длинные позиции можно открывать от уровня 1.3010 с целью 1.3070 и стоп-лоссом 1.2980.
LiteFinance
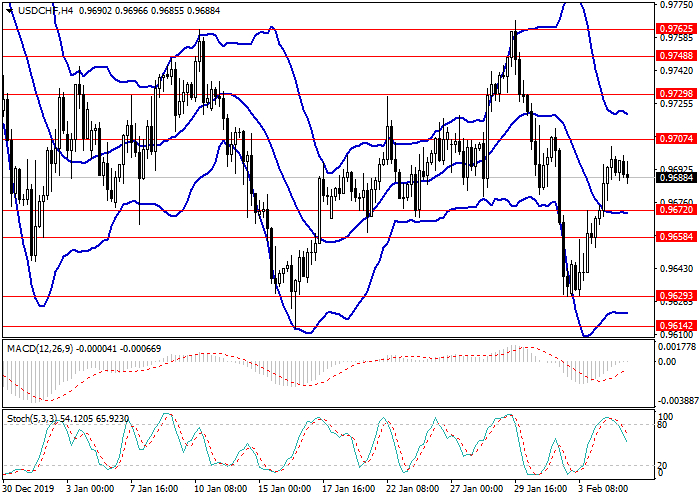
USD/CHF: general analysis
Current trend
On Tuesday, the USD/CHF pair strengthened amid rising US Factory Orders data for December by 1.8%, while the rise was only expected to 1.2%. The strengthening of the indicator reflects a high level of activity in the manufacturing sector, which is an important indicator of the current state of the economy.
Today, the upward trend in the instrument slowed after the publication of Swiss data on the change in the consumer confidence index SECO for the first quarter. The value increased from –10.3 to –9.4 points but overall consumer sentiment remains cautious: despite the rise, the indicator again fell below its long-term average value (–5 points).
Today, investors wait for the release of statistics in the US on the change in the ISM Service PMI at 15:30 (GMT+2), high volatility is predicted in the market.
Support and resistance
Resistance levels: 0.9707, 0.9729, 0.9748, 0.9762.
Support levels: 0.9672, 0.9658, 0.9629, 0.9614.
Trading tips
Long positions may be opened from the level of 0.9710 with the target at 0.9760 and stop loss of 0.9680.
Short positions may be opened from the level of 0.9670 with the target at 0.9630 and stop loss of 0.9700.
Implementation period: 1–3 days.
USD/CHF: общий анализ
Текущая динамика
Во вторник пара USD/CHF усилилась на фоне роста производственных заказов в США в декабре на 1,8%, в то время как ожидался подъём лишь до 1,2%. Укрепление показателя свидетельствует о высоком уровне активности в производственном секторе, что является важным индикатором текущего состояния экономики.
Сегодня восходящая динамика инструмента замедлилась после публикации швейцарских данных по изменению индекса доверия потребителей SECO за первый квартал. Значение выросло с –10,3 до –9,4 пункта, но всё же в целом потребительские настроения остаются осторожными: несмотря на подъем, показатель вновь оказался ниже своего долгосрочного среднего значения (–5 пунктов).
Сегодня инвесторы ожидают выхода статистики в США по изменению индекса деловой активности ISM в сфере услуг в 15:30 (GMT+2), на рынке прогнозируется высокая волатильность.
Уровни поддержки и сопротивления
Уровни сопротивления: 0.9707, 0.9729, 0.9748, 0.9762.
Уровни поддержки: 0.9672, 0.9658, 0.9629, 0.9614.
Торговые сценарии
Длинные позиции можно открывать от уровня 0.9710 с целью 0.9760 и стоп-лоссом 0.9680.
Короткие позиции можно открывать от уровня 0.9670 с целью 0.9630 и стоп-лоссом 0.9700.
Срок реализации: 1–3 дня.
: