LiteFinance / Профиль

Онлайн ECN брокер LiteFinance (ex. LiteForex) с 2005 года предоставляет клиентам возможность выхода к глубочайшей ликвидности на валютном, товарном и фондовом рынках. Для торговли через LiteFinance (ex. LiteForex) доступны все основные валютные пары и кросс-курсы, нефть, драгоценные металлы, биржевые индексы, акции корпораций и самый большой набор криптовалютных пар среди брокеров.
Друзья
382
Заявки
Исходящие

LiteFinance
EUR/USD: general review
Current trend
Yesterday, the instrument lost about 160 points, despite the restoration of Eurozone GDP.
Previously, the pair was supported by the expectation of the Fed rate reduction as a means of combating the negative effects of coronavirus. The ECB cannot implement such measures, and the expansion of the quantitative easing program remains the only tool. In addition, the spread of the virus in Europe is larger than in the USA, and the Eurozone economy struggles more. Yesterday, US President Donald Trump announced his intention to reduce taxes for working citizens until December 31. The bill still needs to be approved by Congress, but investors see that Washington has more resources to support the economy than the EU. Therefore, market participants significantly reduced the volume of long positions in anticipation of the ECB meeting, thereby exerting additional pressure.
Today at 14:30 (GMT+2), the US CPI will be published. Data may exceed the neutral forecast, strengthening USD. EU industrial output is due tomorrow at 12:00 (GMT+2). Other important events for the pair are the ECB meeting on monetary policy (tomorrow at 14:45 (GMT+2)), and the press conference at 15:30 (GMT+2).
Support and resistance
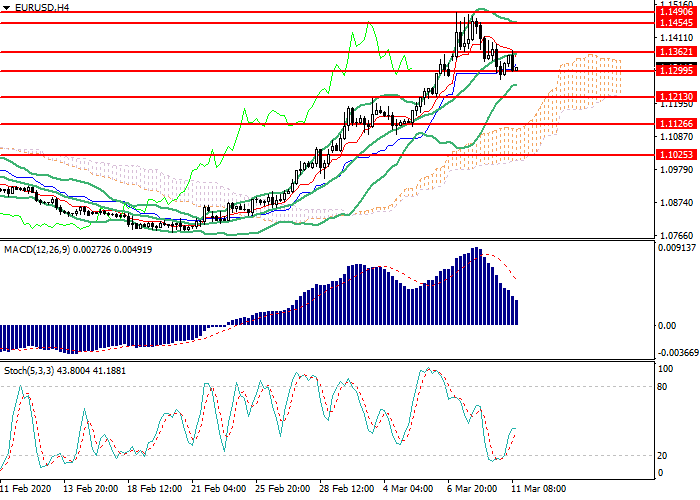
On the H4 chart, the instrument is testing a strong support level of 1.1300. Bollinger Bands are reversing downwards, and the price range remains unchanged indicating the formation of the downtrend. MACD histogram is decreasing in the positive zone, a weak buy signal is still relevant. Stochastic shows a correction in the equilibrium zone.
Resistance levels: 1.1362, 1.1454, 1.1490.
Support levels: 1.1300, 1.1213, 1.1126, 1.1025.
Trading tips
Short positions may be opened from the current level with the target at 1.1195 and stop-loss at 1.1365.
Long positions may be opened above 1.1365 with the target at 1.1460 and stop-loss at 1.1320.
Implementation time: 1-2 days.
EUR/USD: общий анализ
Текущая динамика
Вчера инструмент потерял порядка 160 пунктов, несмотря на восстановление темпов роста ВВП еврозоны.
Раньше пару поддерживало ожидание сокращения ставки ФРС как средства борьбы против негативного воздействия коронавируса. ЕЦБ не имеет возможности для реализации соответствующих мер, и единственным инструментом остаётся расширение программы количественного смягчения. Кроме того, в Европе распространение вируса имеет большие масштабы, чем в США, и экономика еврозоны находится в более тяжёлом положении. Вчера президент США Дональд Трамп заявил о намерении сократить налоги для работающих граждан до 31 декабря. Законопроект ещё необходимо провести через Конгресс, однако инвесторы видят, что Вашингтон имеет больше средств для поддержания экономики, чем ЕС. Поэтому участники рынка существенно сократили количество длинных позиций в преддверии заседания ЕЦБ, чем оказали дополнительное давление на инструмент.
Сегодня в 14:30 (GMT+2) ожидается публикация американского индекса потребительских цен. Учитывая рост продаж в розничных сетях, данные могут превзойти нейтральный прогноз, укрепив USD. Завтра в 12:00 (GMT+2) выйдут данные по промышленному производству в ЕС. Также важными событиями для пары являются заседание ЕЦБ по монетарной политике, запланированное на завтра в 14:45 (GMT+2), и последующая пресс-конференция в 15:30 GMT+2).
Уровни поддержки и сопротивления
На четырёхчасовом графике инструмент тестирует сильный уровень поддержки 1.1300. Полосы Боллинджера разворачиваются вниз, а ценовой диапазон остаётся неизменным, что указывает на формирование нисходящего тренда. Гистограмма MACD снижается в положительной зоне, слабый сигнал на покупку всё ещё актуален. Стохастик демонстрирует коррекцию в области равновесия.
Уровни сопротивления: 1.1362, 1.1454, 1.1490.
Уровни поддержки: 1.1300, 1.1213, 1.1126, 1.1025.
Торговые сценарии
Короткие позиции следует открывать от текущего уровня с целью 1.1195 и стоп-лоссом 1.1365.
Открывать длинные позиции можно выше отметки 1.1365 с целью 1.1460 и стоп-лоссом 1.1320.
Срок реализации: 1-2 дня.
Current trend
Yesterday, the instrument lost about 160 points, despite the restoration of Eurozone GDP.
Previously, the pair was supported by the expectation of the Fed rate reduction as a means of combating the negative effects of coronavirus. The ECB cannot implement such measures, and the expansion of the quantitative easing program remains the only tool. In addition, the spread of the virus in Europe is larger than in the USA, and the Eurozone economy struggles more. Yesterday, US President Donald Trump announced his intention to reduce taxes for working citizens until December 31. The bill still needs to be approved by Congress, but investors see that Washington has more resources to support the economy than the EU. Therefore, market participants significantly reduced the volume of long positions in anticipation of the ECB meeting, thereby exerting additional pressure.
Today at 14:30 (GMT+2), the US CPI will be published. Data may exceed the neutral forecast, strengthening USD. EU industrial output is due tomorrow at 12:00 (GMT+2). Other important events for the pair are the ECB meeting on monetary policy (tomorrow at 14:45 (GMT+2)), and the press conference at 15:30 (GMT+2).
Support and resistance
On the H4 chart, the instrument is testing a strong support level of 1.1300. Bollinger Bands are reversing downwards, and the price range remains unchanged indicating the formation of the downtrend. MACD histogram is decreasing in the positive zone, a weak buy signal is still relevant. Stochastic shows a correction in the equilibrium zone.
Resistance levels: 1.1362, 1.1454, 1.1490.
Support levels: 1.1300, 1.1213, 1.1126, 1.1025.
Trading tips
Short positions may be opened from the current level with the target at 1.1195 and stop-loss at 1.1365.
Long positions may be opened above 1.1365 with the target at 1.1460 and stop-loss at 1.1320.
Implementation time: 1-2 days.
EUR/USD: общий анализ
Текущая динамика
Вчера инструмент потерял порядка 160 пунктов, несмотря на восстановление темпов роста ВВП еврозоны.
Раньше пару поддерживало ожидание сокращения ставки ФРС как средства борьбы против негативного воздействия коронавируса. ЕЦБ не имеет возможности для реализации соответствующих мер, и единственным инструментом остаётся расширение программы количественного смягчения. Кроме того, в Европе распространение вируса имеет большие масштабы, чем в США, и экономика еврозоны находится в более тяжёлом положении. Вчера президент США Дональд Трамп заявил о намерении сократить налоги для работающих граждан до 31 декабря. Законопроект ещё необходимо провести через Конгресс, однако инвесторы видят, что Вашингтон имеет больше средств для поддержания экономики, чем ЕС. Поэтому участники рынка существенно сократили количество длинных позиций в преддверии заседания ЕЦБ, чем оказали дополнительное давление на инструмент.
Сегодня в 14:30 (GMT+2) ожидается публикация американского индекса потребительских цен. Учитывая рост продаж в розничных сетях, данные могут превзойти нейтральный прогноз, укрепив USD. Завтра в 12:00 (GMT+2) выйдут данные по промышленному производству в ЕС. Также важными событиями для пары являются заседание ЕЦБ по монетарной политике, запланированное на завтра в 14:45 (GMT+2), и последующая пресс-конференция в 15:30 GMT+2).
Уровни поддержки и сопротивления
На четырёхчасовом графике инструмент тестирует сильный уровень поддержки 1.1300. Полосы Боллинджера разворачиваются вниз, а ценовой диапазон остаётся неизменным, что указывает на формирование нисходящего тренда. Гистограмма MACD снижается в положительной зоне, слабый сигнал на покупку всё ещё актуален. Стохастик демонстрирует коррекцию в области равновесия.
Уровни сопротивления: 1.1362, 1.1454, 1.1490.
Уровни поддержки: 1.1300, 1.1213, 1.1126, 1.1025.
Торговые сценарии
Короткие позиции следует открывать от текущего уровня с целью 1.1195 и стоп-лоссом 1.1365.
Открывать длинные позиции можно выше отметки 1.1365 с целью 1.1460 и стоп-лоссом 1.1320.
Срок реализации: 1-2 дня.
LiteFinance
NZD/USD: technical analysis
NZD/USD, D1
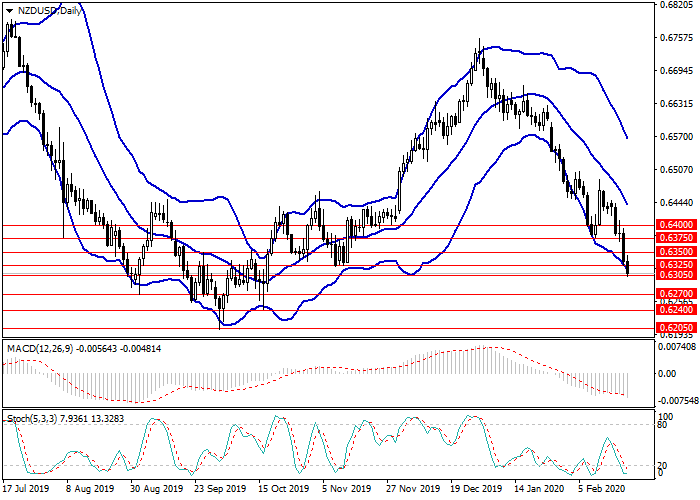
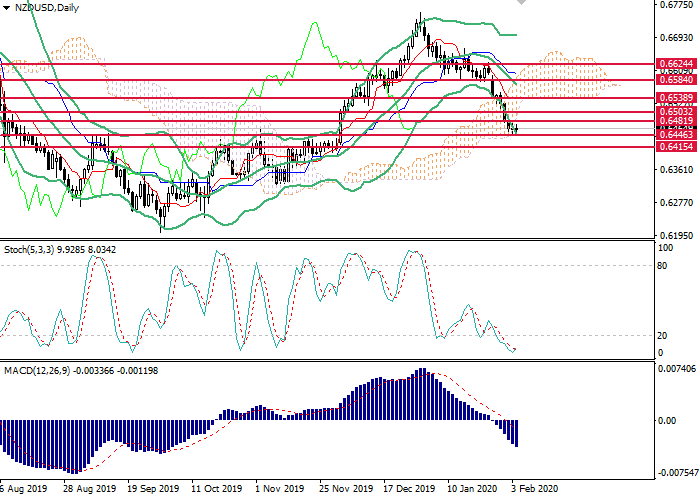
On the daily chart, a downtrend is maintained. The instrument is testing the lower border of the Bollinger Bands for a breakdown, and the indicator cloud is expanded. MACD histogram is in the negative zone, the signal line is crossing the body of the histogram from above forming a signal for opening short positions. Stochastic is on the border with the oversold zone, the oscillator signal line is directed downwards.
Key levels
Resistance levels: 0.6325, 0.6350, 0.6375, 0.6400.
Support levels: 0.6305, 0.6270, 0.6240, 0.6205.
Trading tips
Short positions may be opened from 0.6300 with target at 0.6240 and stop loss at 0.6330.
Long positions may be opened from 0.6350 with target at 0.6400. Stop loss – 0.6320.
Implementation time: 1-3 days.
NZD/USD, D1
On the daily chart, a downtrend is maintained. The instrument is testing the lower border of the Bollinger Bands for a breakdown, and the indicator cloud is expanded. MACD histogram is in the negative zone, the signal line is crossing the body of the histogram from above forming a signal for opening short positions. Stochastic is on the border with the oversold zone, the oscillator signal line is directed downwards.
Key levels
Resistance levels: 0.6325, 0.6350, 0.6375, 0.6400.
Support levels: 0.6305, 0.6270, 0.6240, 0.6205.
Trading tips
Short positions may be opened from 0.6300 with target at 0.6240 and stop loss at 0.6330.
Long positions may be opened from 0.6350 with target at 0.6400. Stop loss – 0.6320.
Implementation time: 1-3 days.
LiteFinance
EUR/USD: general analysis
Current trend
On Monday, in the absence of significant macroeconomic releases, the EUR/USD pair continued to move within a moderate downtrend. Disappointing EU statistics, the possibility of introducing additional US duties against the EU, and the spread of coronavirus remain the main negative drivers.
An insignificant negative impact on the price was formed after yesterday's Eurogroup meeting. The forecast of the European Commission indicates a drop in the EU economy in 2020. Eurogroup Chairman Mario Centeno in his speech noted a decrease in trading risks, as well as Brexit risks. However, an outbreak of coronavirus poses a threat to EUR. Also, the ministers of economics and finance of European countries plan to ease the tax burden for entrepreneurs and the workforce. Traders did not hear anything new, while most investors focused on today’s German releases.
Today at 12:00 (GMT+2) German Current Conditions and Economic Sentiment will be published. Tomorrow at 15:30 (GMT+2), statistics on the US labor market, construction and inflation will be released. On Wednesday, a number of key Fed’s members will speak, and at 21:00 (GMT+2) Fed’s Meeting Minutes will be published.
Support and resistance
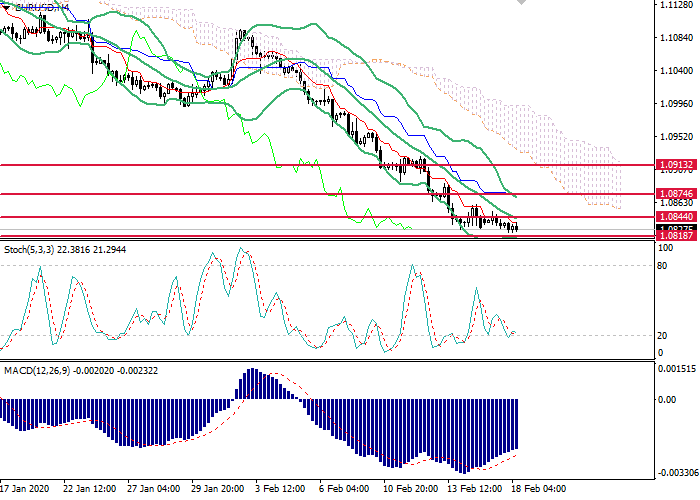
On a 4-hour chart, the instrument consolidates at the bottom of Bollinger bands. The indicator is directed downwards, and the price range is limited, which indicates a downward correction. MACD keeps a strong sell signal. Stochastic is preparing to enter the oversold zone; a strong buy signal is possible within 1–2 days.
Resistance levels: 1.0844, 1.0875, 1.0913.
Support levels: 1.0818, 1.0779, 1.0726, 1.0660.
Trading tips
Short positions may be opened from the current level with the target at 1.0735 and stop loss 1.0865.
Long positions may be opened above 1.0865 with the target at 1.0915 and stop loss 1.0840.
Implementation period: 1–2 days.
EUR/USD: общий анализ
Текущая динамика
В прошедший понедельник в отсутствии значимых макроэкономических релизов пара EUR/USD продолжила двигаться в рамках умеренного нисходящего тренда. Разочаровывающая статистика еврозоны, возможность введения дополнительных американских пошлин против ЕС, а также распространение коронавируса остаются основными драйверами давления на инструмент.
Несущественное негативное воздействие на цену сформировалось по итогам вчерашнего заседания Еврогруппы. Прогноз Еврокомиссии указывает на падение темпов роста экономики ЕС в 2020 году. Председатель Еврогруппы Марио Сентено в своём выступлении заметил снижение торговых рисков, а также рисков Brexit. Тем не менее, вспышка коронавируса несёт в себе угрозу для евро. Также министры экономики и финансов европейских стран планируют ослабление налоговой нагрузки для предпринимателей и рабочей силы. Участники рынка не услышали ничего нового, при этом большинство инвесторов сосредоточили своё внимание на немецком индексе экономических настроений ZEW, публикация которого запланирована на сегодня.
Сегодня в 12:00 (GMT+2) будут опубликованы данные по индексам текущих экономических условий и экономических настроений в Германии. Завтра в 15:30 (GMT+2) выйдет статистика по американскому рынку труда, строительству и инфляции. Кроме того, в среду пройдут выступления ряда ключевых членов ФРС, а в 21:00 (GMT+2) будет опубликован протокол последнего заседания регулятора.
Уровни поддержки и сопротивления
На 4-часовом графике инструмент консолидируется в нижней части полос Боллинджера. Индикатор направлен вниз, а ценовой диапазон ограничен, что указывает на наличие нисходящей коррекции. Гистограмма MACD удерживает сильный сигнал на продажу. Стохастик готовится войти в область перепроданности, сильный сигнал на покупку возможен в течение 1–2 дней.
Уровни сопротивления: 1.0844, 1.0875, 1.0913.
Уровни поддержки: 1.0818, 1.0779, 1.0726, 1.0660.
Торговые сценарии
Короткие позиции можно открывать от текущего уровня с целью 1.0735 и стоп-лоссом на уровне 1.0865.
Длинные позиции можно открывать выше уровня 1.0865 с целью 1.0915 и стоп-лоссом на уровне 1.0840.
Срок реализации: 1–2 дня.
Current trend
On Monday, in the absence of significant macroeconomic releases, the EUR/USD pair continued to move within a moderate downtrend. Disappointing EU statistics, the possibility of introducing additional US duties against the EU, and the spread of coronavirus remain the main negative drivers.
An insignificant negative impact on the price was formed after yesterday's Eurogroup meeting. The forecast of the European Commission indicates a drop in the EU economy in 2020. Eurogroup Chairman Mario Centeno in his speech noted a decrease in trading risks, as well as Brexit risks. However, an outbreak of coronavirus poses a threat to EUR. Also, the ministers of economics and finance of European countries plan to ease the tax burden for entrepreneurs and the workforce. Traders did not hear anything new, while most investors focused on today’s German releases.
Today at 12:00 (GMT+2) German Current Conditions and Economic Sentiment will be published. Tomorrow at 15:30 (GMT+2), statistics on the US labor market, construction and inflation will be released. On Wednesday, a number of key Fed’s members will speak, and at 21:00 (GMT+2) Fed’s Meeting Minutes will be published.
Support and resistance
On a 4-hour chart, the instrument consolidates at the bottom of Bollinger bands. The indicator is directed downwards, and the price range is limited, which indicates a downward correction. MACD keeps a strong sell signal. Stochastic is preparing to enter the oversold zone; a strong buy signal is possible within 1–2 days.
Resistance levels: 1.0844, 1.0875, 1.0913.
Support levels: 1.0818, 1.0779, 1.0726, 1.0660.
Trading tips
Short positions may be opened from the current level with the target at 1.0735 and stop loss 1.0865.
Long positions may be opened above 1.0865 with the target at 1.0915 and stop loss 1.0840.
Implementation period: 1–2 days.
EUR/USD: общий анализ
Текущая динамика
В прошедший понедельник в отсутствии значимых макроэкономических релизов пара EUR/USD продолжила двигаться в рамках умеренного нисходящего тренда. Разочаровывающая статистика еврозоны, возможность введения дополнительных американских пошлин против ЕС, а также распространение коронавируса остаются основными драйверами давления на инструмент.
Несущественное негативное воздействие на цену сформировалось по итогам вчерашнего заседания Еврогруппы. Прогноз Еврокомиссии указывает на падение темпов роста экономики ЕС в 2020 году. Председатель Еврогруппы Марио Сентено в своём выступлении заметил снижение торговых рисков, а также рисков Brexit. Тем не менее, вспышка коронавируса несёт в себе угрозу для евро. Также министры экономики и финансов европейских стран планируют ослабление налоговой нагрузки для предпринимателей и рабочей силы. Участники рынка не услышали ничего нового, при этом большинство инвесторов сосредоточили своё внимание на немецком индексе экономических настроений ZEW, публикация которого запланирована на сегодня.
Сегодня в 12:00 (GMT+2) будут опубликованы данные по индексам текущих экономических условий и экономических настроений в Германии. Завтра в 15:30 (GMT+2) выйдет статистика по американскому рынку труда, строительству и инфляции. Кроме того, в среду пройдут выступления ряда ключевых членов ФРС, а в 21:00 (GMT+2) будет опубликован протокол последнего заседания регулятора.
Уровни поддержки и сопротивления
На 4-часовом графике инструмент консолидируется в нижней части полос Боллинджера. Индикатор направлен вниз, а ценовой диапазон ограничен, что указывает на наличие нисходящей коррекции. Гистограмма MACD удерживает сильный сигнал на продажу. Стохастик готовится войти в область перепроданности, сильный сигнал на покупку возможен в течение 1–2 дней.
Уровни сопротивления: 1.0844, 1.0875, 1.0913.
Уровни поддержки: 1.0818, 1.0779, 1.0726, 1.0660.
Торговые сценарии
Короткие позиции можно открывать от текущего уровня с целью 1.0735 и стоп-лоссом на уровне 1.0865.
Длинные позиции можно открывать выше уровня 1.0865 с целью 1.0915 и стоп-лоссом на уровне 1.0840.
Срок реализации: 1–2 дня.
LiteFinance
EUR/USD: general analysis
Current trend
The European currency is trading within the strong “bearish” trend this month. At the moment, the EUR/USD pair is near two-year lows, and the scenario for further decline seems most likely.
Eurozone statistics are deteriorating, while the slowdown in the manufacturing sector is one of the key drivers of pressure on the instrument. Industrial production occupies a significant part in the European economy, so the spread of the coronavirus poses a significant threat to the European currency. Today's GDP data, reflecting a 0.1% annual slowdown, confirm the presence of negative trends. In addition, the ECB insists on the need for low interest rates and is considering expanding its quantitative easing policy, while the Fed is pursuing a more stable monetary policy. Thus, the strong fundamental differences between the US and EU economies indicate a poor euro against the dollar.
Today at 15:30 (GMT+2), a number of major publications on retail sales in the USA are expected, and at 16:15 (GMT+2), statistics on industrial production volumes will be released.
Support and resistance
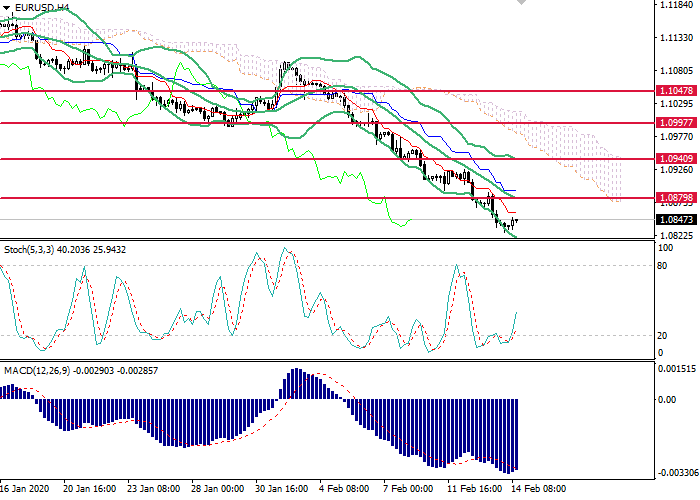
On the 4-hour chart, a downtrend correction is observed. The instrument falls along the lower border of Bollinger bands. The indicator is directed downwards, and the price range remains wide, which indicates a continuation of the downtrend. The MACD histogram keeps a strong sell signal. Stochastic left the oversold zone, maintaining a buy signal.
Resistance levels: 1.0880, 1.0940, 1.0997, 1.1047.
Support levels: 1.0816, 1.0745, 1.0685, 1.0560.
Trading tips
Short positions may be opened from the current level with the target at 1.0745 and stop loss 1.0885.
Long positions may be opened above the level of 1.0870 with the target at 1.0940 and stop loss 1.0840.
Implementation period: 1–3 days.
EUR/USD: общий анализ
Текущая динамика
Европейская валюта торгуется в рамках сильного «медвежьего» тренда в течение текущего месяца. В настоящий момент пара EUR/USD находится вблизи двухлетних минимумов, и сценарий дальнейшего снижения выглядит наиболее вероятным.
Статистика еврозоны ухудшается, при этом замедление производственного сектора является одним из ключевых драйверов давления на инструмент. Промышленное производство занимает существенную часть в европейской экономике, поэтому распространение коронавируса несёт в себе существенную угрозу для европейской валюты. Опубликованные сегодня данные по ВВП, отразившие замедление показателя на 0,1% в годовом выражении, подтверждают наличие негативных тенденций. Кроме того, ЕЦБ настаивает на необходимости низких процентных ставок и рассматривает возможность для расширения политики количественного смягчения, в то время как ФРС реализует более стабильную монетарную политику. Таким образом, сильные фундаментальные различия экономик США и ЕС указывают на слабость евро относительно доллара.
Сегодня в 15:30 (GMT+2) ожидается ряд важнейших публикаций по розничным продажам в США, а в 16:15 (GMT+2) выйдет статистика по объёмам промышленного производства.
Уровни поддержки и сопротивления
На 4-часовом графике наблюдается коррекция нисходящего тренда. Инструмент снижается вдоль нижней границы полос Боллинджера. Индикатор направлен вниз, а ценовой диапазон остаётся широким, что указывает на продолжение нисходящего тренда. Гистограмма MACD удерживает сильный сигнал на продажу. Стохастик покинул область перепроданности, сохранив сигнал на покупку.
Уровни сопротивления: 1.0880, 1.0940, 1.0997, 1.1047.
Уровни поддержки: 1.0816, 1.0745, 1.0685, 1.0560.
Торговые сценарии
Короткие позиции можно открывать от текущего уровня с целью 1.0745 и стоп-лоссом на уровне 1.0885.
Длинные позиции можно открывать выше уровня 1.0870 с целью 1.0940 и стоп-лоссом на уровне 1.0840.
Срок реализации: 1–3 дня.
Current trend
The European currency is trading within the strong “bearish” trend this month. At the moment, the EUR/USD pair is near two-year lows, and the scenario for further decline seems most likely.
Eurozone statistics are deteriorating, while the slowdown in the manufacturing sector is one of the key drivers of pressure on the instrument. Industrial production occupies a significant part in the European economy, so the spread of the coronavirus poses a significant threat to the European currency. Today's GDP data, reflecting a 0.1% annual slowdown, confirm the presence of negative trends. In addition, the ECB insists on the need for low interest rates and is considering expanding its quantitative easing policy, while the Fed is pursuing a more stable monetary policy. Thus, the strong fundamental differences between the US and EU economies indicate a poor euro against the dollar.
Today at 15:30 (GMT+2), a number of major publications on retail sales in the USA are expected, and at 16:15 (GMT+2), statistics on industrial production volumes will be released.
Support and resistance
On the 4-hour chart, a downtrend correction is observed. The instrument falls along the lower border of Bollinger bands. The indicator is directed downwards, and the price range remains wide, which indicates a continuation of the downtrend. The MACD histogram keeps a strong sell signal. Stochastic left the oversold zone, maintaining a buy signal.
Resistance levels: 1.0880, 1.0940, 1.0997, 1.1047.
Support levels: 1.0816, 1.0745, 1.0685, 1.0560.
Trading tips
Short positions may be opened from the current level with the target at 1.0745 and stop loss 1.0885.
Long positions may be opened above the level of 1.0870 with the target at 1.0940 and stop loss 1.0840.
Implementation period: 1–3 days.
EUR/USD: общий анализ
Текущая динамика
Европейская валюта торгуется в рамках сильного «медвежьего» тренда в течение текущего месяца. В настоящий момент пара EUR/USD находится вблизи двухлетних минимумов, и сценарий дальнейшего снижения выглядит наиболее вероятным.
Статистика еврозоны ухудшается, при этом замедление производственного сектора является одним из ключевых драйверов давления на инструмент. Промышленное производство занимает существенную часть в европейской экономике, поэтому распространение коронавируса несёт в себе существенную угрозу для европейской валюты. Опубликованные сегодня данные по ВВП, отразившие замедление показателя на 0,1% в годовом выражении, подтверждают наличие негативных тенденций. Кроме того, ЕЦБ настаивает на необходимости низких процентных ставок и рассматривает возможность для расширения политики количественного смягчения, в то время как ФРС реализует более стабильную монетарную политику. Таким образом, сильные фундаментальные различия экономик США и ЕС указывают на слабость евро относительно доллара.
Сегодня в 15:30 (GMT+2) ожидается ряд важнейших публикаций по розничным продажам в США, а в 16:15 (GMT+2) выйдет статистика по объёмам промышленного производства.
Уровни поддержки и сопротивления
На 4-часовом графике наблюдается коррекция нисходящего тренда. Инструмент снижается вдоль нижней границы полос Боллинджера. Индикатор направлен вниз, а ценовой диапазон остаётся широким, что указывает на продолжение нисходящего тренда. Гистограмма MACD удерживает сильный сигнал на продажу. Стохастик покинул область перепроданности, сохранив сигнал на покупку.
Уровни сопротивления: 1.0880, 1.0940, 1.0997, 1.1047.
Уровни поддержки: 1.0816, 1.0745, 1.0685, 1.0560.
Торговые сценарии
Короткие позиции можно открывать от текущего уровня с целью 1.0745 и стоп-лоссом на уровне 1.0885.
Длинные позиции можно открывать выше уровня 1.0870 с целью 1.0940 и стоп-лоссом на уровне 1.0840.
Срок реализации: 1–3 дня.
LiteFinance
USD/JPY: technical analysis
USD/JPY, D1
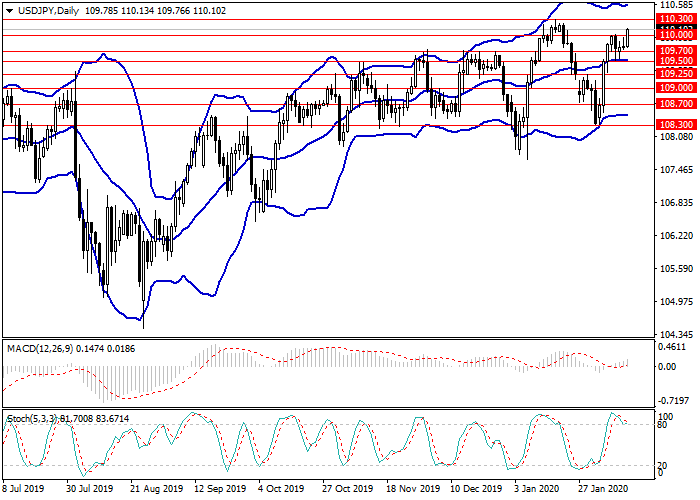
On the D1 chart, a lateral trend remains. The instrument is being traded within the channel formed by the borders of Bollinger Bands, the indicator cloud is expanded. MACD histogram is near the zero level, its volumes are minimal; the signal line moves horizontally along the zero line without forming a clear signal to enter the market. Stochastic is in the overbought zone on the border with the neutral zone; the oscillator lines are reversing downwards.
Key levels
Support levels: 110.00, 109.70, 109.50, 109.25, 109.00, 108.70, 108.30.
Resistance levels: 110.30, 110.60.
Trading tips
Long positions may be opened from the current level with the target at 110.60 and stop-loss at 109.80.
Short positions may be opened from the level of 109.70 with the target at 109.25 and stop-loss at 110.00.
Implementation time: 1-3 days.
USD/JPY: технический анализ
USD/JPY, D1
На дневном графике сохраняется боковой тренд. Инструмент торгуется в рамках канала, сформированного границами полос Боллинджера, облако индикатора расширено. Гистограмма MACD находится в районе нулевой отметки, объёмы её минимальны, сигнальная линия движется горизонтально вдоль нулевой отметки, не формируя чёткого сигнала ко входу в рынок. Стохастик находится в зоне перекупленности на границе с нейтральной зоной, линии осциллятора разворачиваются вниз.
Ключевые уровни
Уровни поддержки: 110.00, 109.70, 109.50, 109.25, 109.00, 108.70, 108.30.
Уровни сопротивления: 110.30, 110.60.
Торговые сценарии
Длинные позиции можно открывать от текущего уровня с целью 110.60 и стоп-лоссом 109.80.
Короткие позиции можно открывать от уровня 109.70 с целью 109.25 и стоп-лоссом 110.00.
Срок реализации: 1-3 дня.
USD/JPY, D1
On the D1 chart, a lateral trend remains. The instrument is being traded within the channel formed by the borders of Bollinger Bands, the indicator cloud is expanded. MACD histogram is near the zero level, its volumes are minimal; the signal line moves horizontally along the zero line without forming a clear signal to enter the market. Stochastic is in the overbought zone on the border with the neutral zone; the oscillator lines are reversing downwards.
Key levels
Support levels: 110.00, 109.70, 109.50, 109.25, 109.00, 108.70, 108.30.
Resistance levels: 110.30, 110.60.
Trading tips
Long positions may be opened from the current level with the target at 110.60 and stop-loss at 109.80.
Short positions may be opened from the level of 109.70 with the target at 109.25 and stop-loss at 110.00.
Implementation time: 1-3 days.
USD/JPY: технический анализ
USD/JPY, D1
На дневном графике сохраняется боковой тренд. Инструмент торгуется в рамках канала, сформированного границами полос Боллинджера, облако индикатора расширено. Гистограмма MACD находится в районе нулевой отметки, объёмы её минимальны, сигнальная линия движется горизонтально вдоль нулевой отметки, не формируя чёткого сигнала ко входу в рынок. Стохастик находится в зоне перекупленности на границе с нейтральной зоной, линии осциллятора разворачиваются вниз.
Ключевые уровни
Уровни поддержки: 110.00, 109.70, 109.50, 109.25, 109.00, 108.70, 108.30.
Уровни сопротивления: 110.30, 110.60.
Торговые сценарии
Длинные позиции можно открывать от текущего уровня с целью 110.60 и стоп-лоссом 109.80.
Короткие позиции можно открывать от уровня 109.70 с целью 109.25 и стоп-лоссом 110.00.
Срок реализации: 1-3 дня.
LiteFinance

USD/CHF: technical analysis
USD/CHF, D1
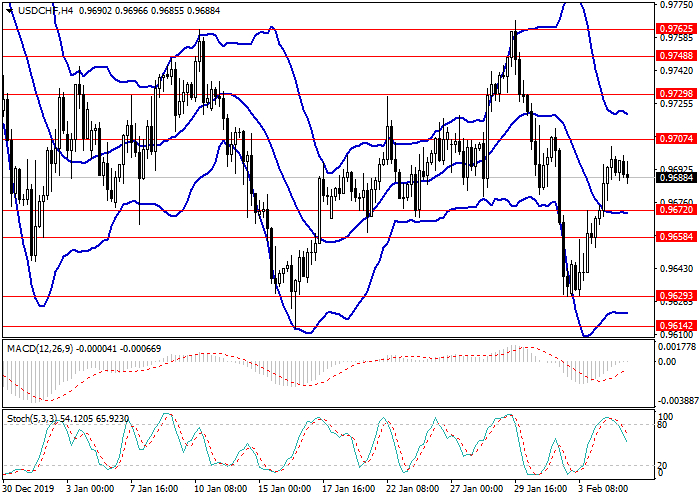
An uptrend is forming on the daily chart. The instrument tests the upper border of the sideways channel formed by the boundaries of Bollinger bands, the indicator cloud expands. The MACD histogram is in the negative zone, gradually reducing volumes, the signal line has reversed upwards, a buy signal is being formed. Stochastic crosses the border of the overbought zone upwards, a signal to open long positions maintains
Key levels
Resistance levels: 0.9783, 0.9805, 0.9831.
Support levels: 0.9762, 0.9750, 0.9730, 0.9710, 0.9672.
Trading tips
Long positions may be opened from the current level with the target at 0.9830. Stop loss is 0.9750.
Short positions may be opened from the level of 0.9730 with the target at 0.9680 and stop loss of 0.9760.
Implementation period: 1–3 days.
USD/CHF: технический анализ
USD/CHF, D1
На дневном графике формируется восходящий тренд. Инструмент тестирует верхнюю границу бокового канала, сформированного границами полос Боллинджера, облако индикатора расширяется. Гистограмма MACD находится в отрицательной зоне, плавно сокращая объёмы, сигнальная линия развернулась вверх, формируется сигнал на покупку. Стохастик пересекает границу зоны перекупленности снизу вверх, сохраняется сигнал к открытию длинных позиций.
Ключевые уровни
Уровни сопротивления: 0.9783, 0.9805, 0.9831.
Уровни поддержки: 0.9762, 0.9750, 0.9730, 0.9710, 0.9672.
Торговые сценарии
Длинные позиции можно открывать от текущего уровня с целью 0.9830. Стоп-лосс на уровне 0.9750.
Короткие позиции можно открывать от уровня 0.9730 с целью 0.9680 и стоп-лоссом 0.9760.
Срок реализации: 1–3 дня.
USD/CHF, D1
An uptrend is forming on the daily chart. The instrument tests the upper border of the sideways channel formed by the boundaries of Bollinger bands, the indicator cloud expands. The MACD histogram is in the negative zone, gradually reducing volumes, the signal line has reversed upwards, a buy signal is being formed. Stochastic crosses the border of the overbought zone upwards, a signal to open long positions maintains
Key levels
Resistance levels: 0.9783, 0.9805, 0.9831.
Support levels: 0.9762, 0.9750, 0.9730, 0.9710, 0.9672.
Trading tips
Long positions may be opened from the current level with the target at 0.9830. Stop loss is 0.9750.
Short positions may be opened from the level of 0.9730 with the target at 0.9680 and stop loss of 0.9760.
Implementation period: 1–3 days.
USD/CHF: технический анализ
USD/CHF, D1
На дневном графике формируется восходящий тренд. Инструмент тестирует верхнюю границу бокового канала, сформированного границами полос Боллинджера, облако индикатора расширяется. Гистограмма MACD находится в отрицательной зоне, плавно сокращая объёмы, сигнальная линия развернулась вверх, формируется сигнал на покупку. Стохастик пересекает границу зоны перекупленности снизу вверх, сохраняется сигнал к открытию длинных позиций.
Ключевые уровни
Уровни сопротивления: 0.9783, 0.9805, 0.9831.
Уровни поддержки: 0.9762, 0.9750, 0.9730, 0.9710, 0.9672.
Торговые сценарии
Длинные позиции можно открывать от текущего уровня с целью 0.9830. Стоп-лосс на уровне 0.9750.
Короткие позиции можно открывать от уровня 0.9730 с целью 0.9680 и стоп-лоссом 0.9760.
Срок реализации: 1–3 дня.
LiteFinance
USD/CAD: general review
Current trend
This week, the pair has consolidated at highs since last December, pending employment data in the US and Canada.
Today, weak support to the instrument was provided by a significant reduction in China's trade balance. One could expect a larger growth, but this did not happen, which confirms the importance of today's employment statistics. US labor market data may further strengthen the US dollar. A strong report is indicated by: a reduction in the number of jobless claims (MoM); an increase in the non-farm payrolls from 199K to 291K (with a forecast of 156K), according to ADP data; growth of consumer confidence. Given all this, as well as a stable monetary policy and the strengthening of the position of President Donald Trump, investors expect USD to strengthen.
Data on the labor market in the US and Canada will be published today at 15:30 (GMT+2), and on business activity in Canada – at 17:00 (GMT + 2).
Support and resistance
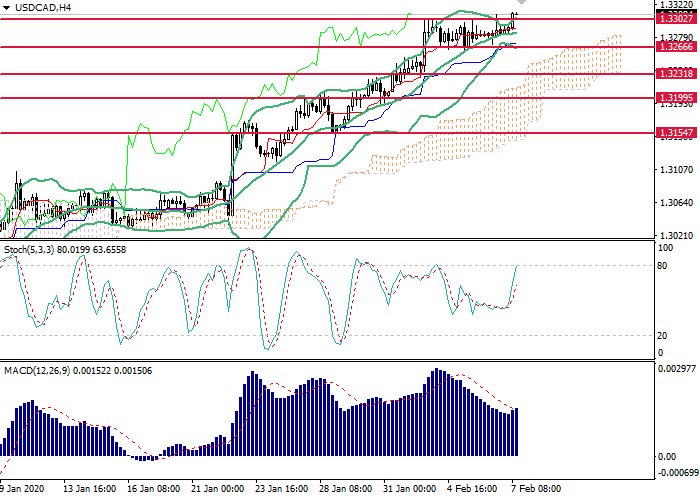
On the H4 chart, the instrument is testing the upper border of Bollinger Bands, which is the key resistance level. The indicator is directed upwards, while the price range is expanding, indicating further growth. MACD histogram keeps a strong buy signal. Stochastic is approaching the oversold zone from below, a weak buy signal is relevant.
Support levels: 1.3266, 1.3231, 1.3200, 1.3154, 1.3057.
Resistance levels: 1.3300, 1.3346, 1.3390.
Trading tips
Long positions may be opened from the current level with the target at 1.3355 and stop-loss at 1.3270.
Short positions may be opened below the level of 1.3280 with the target at 1.3230 and stop-loss at 1.3295.
Implementation time: 1 day.
USD/CAD: общий анализ
Текущая динамика
На неделе пара консолидируется у максимумов с декабря прошлого года в ожидании данных по занятости в США и Канаде.
Сегодня несущественную поддержку инструменту оказало значительное сокращение сальдо торгового баланса Китая. Можно было бы ожидать более масштабного роста, однако этого не случилось, что подтверждает важность сегодняшней статистики по занятости. Данные по рынку труда США могут поспособствовать дальнейшему укреплению американского доллара. На сильный отчёт указывают: сокращение числа заявок на пособие по безработице в месячном выражении, увеличение числа трудоустроенных вне сельского хозяйства по данным ADP c 199 до 291 тысячи (при прогнозе 156 тысяч), рост доверия потребителей. Учитывая всё это, а также устойчивую монетарную политику и укрепление позиций президента Дональда Трампа, инвесторы ожидают укрепления USD.
Данные по рынку труда в США и Канаде будут опубликованы сегодня в 15:30 (GMT+2), а по деловой активности в Канаде – в 17:00 (GMT+2).
Уровни поддержки и сопротивления
На четырёхчасовом графике инструмент тестирует верхнюю границу полос Боллинджера, которая выступает ключевым уровнем сопротивления. Индикатор направлен вверх, а ценовой диапазон увеличивается, что указывает на дальнейший рост. Гистограмма MACD сохраняет сильный сигнал на покупку. Стохастик приближается к области перепроданности снизу, актуален слабый сигнал на покупку.
Уровни поддержки: 1.3266, 1.3231, 1.3200, 1.3154, 1.3057.
Уровни сопротивления: 1.3300, 1.3346, 1.3390.
Торговые сценарии
Длинные позиции следует открывать от текущего уровня с целью 1.3355 и стоп-лоссом 1.3270.
Открывать короткие позиции можно ниже отметки 1.3280 с целью 1.3230 и стоп-лоссом 1.3295.
Срок реализации: 1 день.
Current trend
This week, the pair has consolidated at highs since last December, pending employment data in the US and Canada.
Today, weak support to the instrument was provided by a significant reduction in China's trade balance. One could expect a larger growth, but this did not happen, which confirms the importance of today's employment statistics. US labor market data may further strengthen the US dollar. A strong report is indicated by: a reduction in the number of jobless claims (MoM); an increase in the non-farm payrolls from 199K to 291K (with a forecast of 156K), according to ADP data; growth of consumer confidence. Given all this, as well as a stable monetary policy and the strengthening of the position of President Donald Trump, investors expect USD to strengthen.
Data on the labor market in the US and Canada will be published today at 15:30 (GMT+2), and on business activity in Canada – at 17:00 (GMT + 2).
Support and resistance
On the H4 chart, the instrument is testing the upper border of Bollinger Bands, which is the key resistance level. The indicator is directed upwards, while the price range is expanding, indicating further growth. MACD histogram keeps a strong buy signal. Stochastic is approaching the oversold zone from below, a weak buy signal is relevant.
Support levels: 1.3266, 1.3231, 1.3200, 1.3154, 1.3057.
Resistance levels: 1.3300, 1.3346, 1.3390.
Trading tips
Long positions may be opened from the current level with the target at 1.3355 and stop-loss at 1.3270.
Short positions may be opened below the level of 1.3280 with the target at 1.3230 and stop-loss at 1.3295.
Implementation time: 1 day.
USD/CAD: общий анализ
Текущая динамика
На неделе пара консолидируется у максимумов с декабря прошлого года в ожидании данных по занятости в США и Канаде.
Сегодня несущественную поддержку инструменту оказало значительное сокращение сальдо торгового баланса Китая. Можно было бы ожидать более масштабного роста, однако этого не случилось, что подтверждает важность сегодняшней статистики по занятости. Данные по рынку труда США могут поспособствовать дальнейшему укреплению американского доллара. На сильный отчёт указывают: сокращение числа заявок на пособие по безработице в месячном выражении, увеличение числа трудоустроенных вне сельского хозяйства по данным ADP c 199 до 291 тысячи (при прогнозе 156 тысяч), рост доверия потребителей. Учитывая всё это, а также устойчивую монетарную политику и укрепление позиций президента Дональда Трампа, инвесторы ожидают укрепления USD.
Данные по рынку труда в США и Канаде будут опубликованы сегодня в 15:30 (GMT+2), а по деловой активности в Канаде – в 17:00 (GMT+2).
Уровни поддержки и сопротивления
На четырёхчасовом графике инструмент тестирует верхнюю границу полос Боллинджера, которая выступает ключевым уровнем сопротивления. Индикатор направлен вверх, а ценовой диапазон увеличивается, что указывает на дальнейший рост. Гистограмма MACD сохраняет сильный сигнал на покупку. Стохастик приближается к области перепроданности снизу, актуален слабый сигнал на покупку.
Уровни поддержки: 1.3266, 1.3231, 1.3200, 1.3154, 1.3057.
Уровни сопротивления: 1.3300, 1.3346, 1.3390.
Торговые сценарии
Длинные позиции следует открывать от текущего уровня с целью 1.3355 и стоп-лоссом 1.3270.
Открывать короткие позиции можно ниже отметки 1.3280 с целью 1.3230 и стоп-лоссом 1.3295.
Срок реализации: 1 день.
LiteFinance
GBP/USD: general analysis
Current trend
GBP is under pressure from investors' doubts about the ability of the EU and the UK to agree on a deal before the end of the current calendar year. However, the parties may also extend the transition period in order to get more time to work out joint decisions. UK macroeconomic statistics released on Wednesday provided moderate support to the British currency. Thus, Markit Service PMI for January rose from 52.9 to 53.9 points with a constant forecast.
Macroeconomic statistics from the United States published on Wednesday were ambiguous but contributed to the further strengthening of the dollar. Thus, ISM Service PMI for January rose from 54.9 to 55.5 points against the forecast of growth to 55 points. ADP Nonfarm Payrolls data were also positive, which is traditionally published ahead of the release of the official US labor market report. It reflected a sharp increase in private sector employment in January by 291K jobs after an increase of 199K last month.
Today, the dynamics of the instrument may be affected by US Initial Jobless Claims data at 15:30 (GMT+2), as well as preliminary data on changes in labor productivity excluding agricultural machinery for the fourth quarter at 15:30 (GMT+2), moderate volatility is expected in the market.
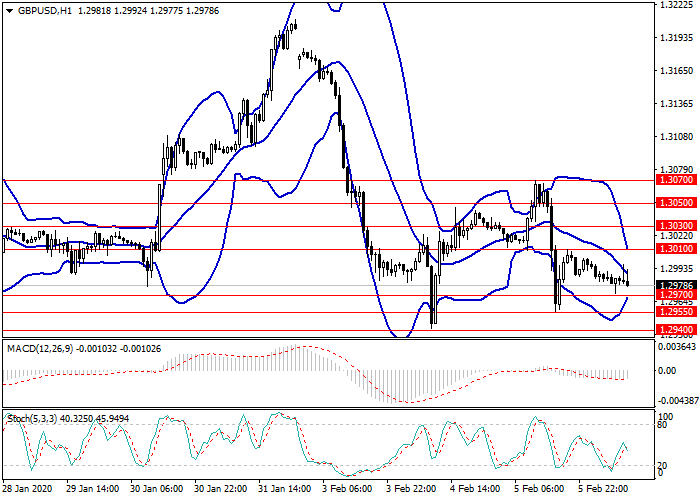
Support and resistance
Resistance levels: 1.3010, 1.3030, 1.3050, 1.3070.
Support levels: 1.2970, 1.2955, 1.2940, 1.2900.
Trading tips
Short positions may be opened from 1.2955 with the target at 1.2905 and stop loss 1.2980.
Long positions may be opened from 1.3010 with the target at 1.3070 and stop loss 1.2980.
Implementation period: 1–3 days.
GBP/USD: общий анализ
Текущая динамика
Фунт находится под давлением, которое оказывают на валюту сомнения инвесторов относительно способности ЕС и Великобритании договориться по торговой сделке до конца текущего календарного года. Впрочем, стороны могут также продлить переходной период, чтобы дать себе больше времени на выработку совместных решений. Опубликованная в среду макроэкономическая статистика из Великобритании оказала британской валюте умеренную поддержку. Так, индекс деловой активности в секторе услуг от Markit в январе вырос с 52,9 до 53,9 пункта при неизменном прогнозе.
Опубликованная в среду макроэкономическая статистика из США оказалась смешанной, однако способствовала дальнейшему укреплению доллара. Так, индекс деловой активности в секторе услуг от ISM в январе вырос с 54,9 до 55,5 пункта при прогнозе о росте до 55 пунктов. Порадовал также и отчёт ADP по занятости, который традиционно публикуется в преддверии выхода официального отчёта по рынку труда США. Он отразил резкий рост занятости в частном секторе в январе на 291 тысячу рабочих мест после роста на 199 тысяч в прошлом месяце.
Сегодня на динамику инструмента могут повлиять данные из США по изменению числа первичных заявок на пособия по безработице в 15:30 (GMT+2), а также предварительные данные по изменению производительности труда без учёта с\х техники за четвёртый квартал в 15:30 (GMT+2), на рынке ожидается умеренная волатильность.
Уровни поддержки и сопротивления
Уровни сопротивления: 1.3010, 1.3030, 1.3050, 1.3070.
Уровни поддержки: 1.2970, 1.2955, 1.2940, 1.2900.
Торговые сценарии
Короткие позиции можно открывать от уровня 1.2955 с целью 1.2905 и стоп-лоссом 1.2980.
Длинные позиции можно открывать от уровня 1.3010 с целью 1.3070 и стоп-лоссом 1.2980.
Current trend
GBP is under pressure from investors' doubts about the ability of the EU and the UK to agree on a deal before the end of the current calendar year. However, the parties may also extend the transition period in order to get more time to work out joint decisions. UK macroeconomic statistics released on Wednesday provided moderate support to the British currency. Thus, Markit Service PMI for January rose from 52.9 to 53.9 points with a constant forecast.
Macroeconomic statistics from the United States published on Wednesday were ambiguous but contributed to the further strengthening of the dollar. Thus, ISM Service PMI for January rose from 54.9 to 55.5 points against the forecast of growth to 55 points. ADP Nonfarm Payrolls data were also positive, which is traditionally published ahead of the release of the official US labor market report. It reflected a sharp increase in private sector employment in January by 291K jobs after an increase of 199K last month.
Today, the dynamics of the instrument may be affected by US Initial Jobless Claims data at 15:30 (GMT+2), as well as preliminary data on changes in labor productivity excluding agricultural machinery for the fourth quarter at 15:30 (GMT+2), moderate volatility is expected in the market.
Support and resistance
Resistance levels: 1.3010, 1.3030, 1.3050, 1.3070.
Support levels: 1.2970, 1.2955, 1.2940, 1.2900.
Trading tips
Short positions may be opened from 1.2955 with the target at 1.2905 and stop loss 1.2980.
Long positions may be opened from 1.3010 with the target at 1.3070 and stop loss 1.2980.
Implementation period: 1–3 days.
GBP/USD: общий анализ
Текущая динамика
Фунт находится под давлением, которое оказывают на валюту сомнения инвесторов относительно способности ЕС и Великобритании договориться по торговой сделке до конца текущего календарного года. Впрочем, стороны могут также продлить переходной период, чтобы дать себе больше времени на выработку совместных решений. Опубликованная в среду макроэкономическая статистика из Великобритании оказала британской валюте умеренную поддержку. Так, индекс деловой активности в секторе услуг от Markit в январе вырос с 52,9 до 53,9 пункта при неизменном прогнозе.
Опубликованная в среду макроэкономическая статистика из США оказалась смешанной, однако способствовала дальнейшему укреплению доллара. Так, индекс деловой активности в секторе услуг от ISM в январе вырос с 54,9 до 55,5 пункта при прогнозе о росте до 55 пунктов. Порадовал также и отчёт ADP по занятости, который традиционно публикуется в преддверии выхода официального отчёта по рынку труда США. Он отразил резкий рост занятости в частном секторе в январе на 291 тысячу рабочих мест после роста на 199 тысяч в прошлом месяце.
Сегодня на динамику инструмента могут повлиять данные из США по изменению числа первичных заявок на пособия по безработице в 15:30 (GMT+2), а также предварительные данные по изменению производительности труда без учёта с\х техники за четвёртый квартал в 15:30 (GMT+2), на рынке ожидается умеренная волатильность.
Уровни поддержки и сопротивления
Уровни сопротивления: 1.3010, 1.3030, 1.3050, 1.3070.
Уровни поддержки: 1.2970, 1.2955, 1.2940, 1.2900.
Торговые сценарии
Короткие позиции можно открывать от уровня 1.2955 с целью 1.2905 и стоп-лоссом 1.2980.
Длинные позиции можно открывать от уровня 1.3010 с целью 1.3070 и стоп-лоссом 1.2980.
LiteFinance
USD/CHF: general analysis
Current trend
On Tuesday, the USD/CHF pair strengthened amid rising US Factory Orders data for December by 1.8%, while the rise was only expected to 1.2%. The strengthening of the indicator reflects a high level of activity in the manufacturing sector, which is an important indicator of the current state of the economy.
Today, the upward trend in the instrument slowed after the publication of Swiss data on the change in the consumer confidence index SECO for the first quarter. The value increased from –10.3 to –9.4 points but overall consumer sentiment remains cautious: despite the rise, the indicator again fell below its long-term average value (–5 points).
Today, investors wait for the release of statistics in the US on the change in the ISM Service PMI at 15:30 (GMT+2), high volatility is predicted in the market.
Support and resistance
Resistance levels: 0.9707, 0.9729, 0.9748, 0.9762.
Support levels: 0.9672, 0.9658, 0.9629, 0.9614.
Trading tips
Long positions may be opened from the level of 0.9710 with the target at 0.9760 and stop loss of 0.9680.
Short positions may be opened from the level of 0.9670 with the target at 0.9630 and stop loss of 0.9700.
Implementation period: 1–3 days.
USD/CHF: общий анализ
Текущая динамика
Во вторник пара USD/CHF усилилась на фоне роста производственных заказов в США в декабре на 1,8%, в то время как ожидался подъём лишь до 1,2%. Укрепление показателя свидетельствует о высоком уровне активности в производственном секторе, что является важным индикатором текущего состояния экономики.
Сегодня восходящая динамика инструмента замедлилась после публикации швейцарских данных по изменению индекса доверия потребителей SECO за первый квартал. Значение выросло с –10,3 до –9,4 пункта, но всё же в целом потребительские настроения остаются осторожными: несмотря на подъем, показатель вновь оказался ниже своего долгосрочного среднего значения (–5 пунктов).
Сегодня инвесторы ожидают выхода статистики в США по изменению индекса деловой активности ISM в сфере услуг в 15:30 (GMT+2), на рынке прогнозируется высокая волатильность.
Уровни поддержки и сопротивления
Уровни сопротивления: 0.9707, 0.9729, 0.9748, 0.9762.
Уровни поддержки: 0.9672, 0.9658, 0.9629, 0.9614.
Торговые сценарии
Длинные позиции можно открывать от уровня 0.9710 с целью 0.9760 и стоп-лоссом 0.9680.
Короткие позиции можно открывать от уровня 0.9670 с целью 0.9630 и стоп-лоссом 0.9700.
Срок реализации: 1–3 дня.
LiteFinance
NZD/USD: technical analysis
NZD/USD, D1
On the daily chart, the instrument is decreasing along the lower border of Bollinger bands, which acts as a key support level. The indicator is directed downwards, and the price range is expanding, which indicates the continuation of a downtrend. The MACD histogram keeps a sell signal. Stochastic has entered the oversold zone, a buy signal is expected before the end of this week.
Key levels
Resistance levels: 0.6482, 0.6503, 0.6539, 0.6584, 0.6624.
Support levels: 0.6446, 0.6415, 0.6371.
Trading tips
Short positions may be opened below the level of 0.6445 with the target at 0.6390 and stop loss 0.6465. Implementation period: 1–2 days.
Long positions may be opened above the level of 0.6490 with the target at 0.6540 and stop loss 0.6470. Implementation period: 1–3 days.
NZD/USD: технический анализ
NZD/USD, D1
На дневном графике инструмент снижается вдоль нижней границы полос Боллинджера, которая выступает ключевым уровнем поддержки. Индикатор направлен вниз, а ценовой диапазон расширяется, что указывает на продолжение нисходящего тренда. Гистограмма MACD удерживает сигнал на продажу. Стохастик вошёл в область перепроданности, сигнал на покупку ожидается до конца текущей недели.
Ключевые уровни
Уровни сопротивления: 0.6482, 0.6503, 0.6539, 0.6584, 0.6624.
Уровни поддержки: 0.6446, 0.6415, 0.6371.
Торговые сценарии
Короткие позиции можно открывать ниже уровня 0.6445 с целью 0.6390 и стоп-лоссом на уровне 0.6465. Срок реализации: 1–2 дня.
Длинные позиции можно открывать выше уровня 0.6490 с целью 0.6540 и стоп-лоссом на уровне 0.6470. Срок реализации: 1–3 дня.
NZD/USD, D1
On the daily chart, the instrument is decreasing along the lower border of Bollinger bands, which acts as a key support level. The indicator is directed downwards, and the price range is expanding, which indicates the continuation of a downtrend. The MACD histogram keeps a sell signal. Stochastic has entered the oversold zone, a buy signal is expected before the end of this week.
Key levels
Resistance levels: 0.6482, 0.6503, 0.6539, 0.6584, 0.6624.
Support levels: 0.6446, 0.6415, 0.6371.
Trading tips
Short positions may be opened below the level of 0.6445 with the target at 0.6390 and stop loss 0.6465. Implementation period: 1–2 days.
Long positions may be opened above the level of 0.6490 with the target at 0.6540 and stop loss 0.6470. Implementation period: 1–3 days.
NZD/USD: технический анализ
NZD/USD, D1
На дневном графике инструмент снижается вдоль нижней границы полос Боллинджера, которая выступает ключевым уровнем поддержки. Индикатор направлен вниз, а ценовой диапазон расширяется, что указывает на продолжение нисходящего тренда. Гистограмма MACD удерживает сигнал на продажу. Стохастик вошёл в область перепроданности, сигнал на покупку ожидается до конца текущей недели.
Ключевые уровни
Уровни сопротивления: 0.6482, 0.6503, 0.6539, 0.6584, 0.6624.
Уровни поддержки: 0.6446, 0.6415, 0.6371.
Торговые сценарии
Короткие позиции можно открывать ниже уровня 0.6445 с целью 0.6390 и стоп-лоссом на уровне 0.6465. Срок реализации: 1–2 дня.
Длинные позиции можно открывать выше уровня 0.6490 с целью 0.6540 и стоп-лоссом на уровне 0.6470. Срок реализации: 1–3 дня.
LiteFinance
XAU/USD: general review
Current trend
Gold prices remain high amid armed conflict between the United States and Iran, the controversial Brexit situation, the economic downturn in the United States, rumors of a possible impeachment of Donald Trump, and the deadly virus in China. All these factors had a serious impact on the growth in demand for the precious metal, since gold has traditionally been a "safe haven" asset. The growth impulse received during the aggravation of US-Iranian relations has now decreased, but the price of the instrument has not been seriously corrected down. Over the past two weeks, gold has again risen in price by more than USD 40 per ounce.
Support and resistance
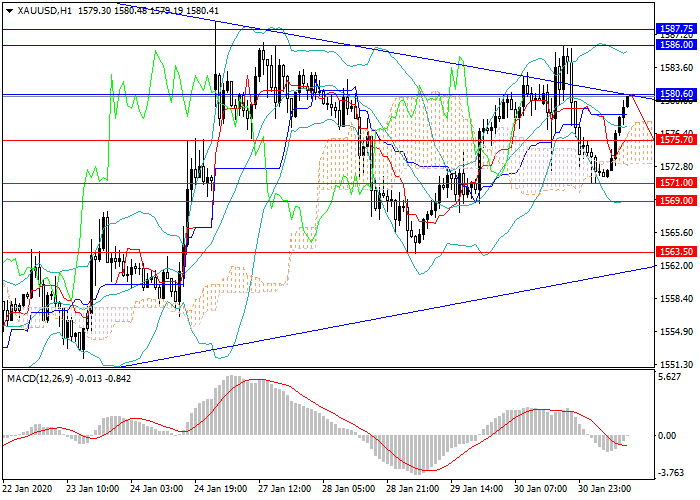
The instrument moved into a narrowing lateral range and, having passed 4000 points, reached the upper border of this range. Therefore, the formation of a new downward wave to 1563.50, 1560.00 is possible. An alternative scenario would be further growth, a breakdown of the key resistance level of 1587.75, and growth above 1600.00. However, the level of 1587.75 is very strong, and its breakout will become possible only in case of increasing tension between Iran and the USA, spread of the Chinese virus, or deterioration of the US macroeconomic background.
Technical indicators confirm the growth forecast: MACD shows growth in the volume of long positions and Bollinger Bands are directed upwards.
Support levels: 1575.70, 1571.00, 1569.00, 1563.50, 1560.00.
Resistance levels: 1580.60, 1586.00, 1587.75, 1590.00, 1600.00.
Trading tips
In this situation, short positions may be opened from the current level with the target at 1563.50 and stop-loss at 1582.00.
XAU/USD: общий обзор
Текущая динамика
Цена на золото остаётся высокой на фоне вооружённого конфликта между США и Ираном, неоднозначной ситуации по Brexit, экономического спада в США, слухов по поводу возможного импичмента Дональда Трампа и смертельного вируса в Китае. Все эти факторы оказали серьёзное влияние на рост спроса на драгоценный металл, поскольку золото традиционно является «активом-убежищем». Импульс роста, полученный во время обострения американо-иранских отношений, сейчас уменьшился, но цена инструмента вниз серьёзно не скорректировалась. За последние две недели золото снова выросло в цене более чем на 40 долларов за унцию.
Уровни поддержки и сопротивления
Инструмент перешёл в боковой сужающийся диапазон и, пройдя 4000 пунктов, достиг верхней границы этого диапазона. Поэтому можно рассчитывать на формирование новой нисходящей волны к уровням 1563.50, 1560.00. Альтернативным сценарием будет дальнейший рост, пробой ключевого уровня сопротивления 1587.75 и рост выше отметки 1600.00. Однако уровень 1587.75 очень силён, и его преодоление станет возможным только в случае нарастания напряжённости между Ираном и США, распространения китайского вируса, либо ухудшения макроэкономического фона в США.
Технические индикаторы подтверждают прогноз роста: MACD указывает на рост объёма длинных позиций, а полосы Боллинджера направлены вверх.
Уровни поддержки: 1575.70, 1571.00, 1569.00, 1563.50, 1560.00.
Уровни сопротивления: 1580.60, 1586.00, 1587.75, 1590.00, 1600.00.
Торговые сценарии
В данной ситуации актуально открывать короткие позиции от текущего уровня с целью 1563.50 и стоп-лоссом 1582.00.
Current trend
Gold prices remain high amid armed conflict between the United States and Iran, the controversial Brexit situation, the economic downturn in the United States, rumors of a possible impeachment of Donald Trump, and the deadly virus in China. All these factors had a serious impact on the growth in demand for the precious metal, since gold has traditionally been a "safe haven" asset. The growth impulse received during the aggravation of US-Iranian relations has now decreased, but the price of the instrument has not been seriously corrected down. Over the past two weeks, gold has again risen in price by more than USD 40 per ounce.
Support and resistance
The instrument moved into a narrowing lateral range and, having passed 4000 points, reached the upper border of this range. Therefore, the formation of a new downward wave to 1563.50, 1560.00 is possible. An alternative scenario would be further growth, a breakdown of the key resistance level of 1587.75, and growth above 1600.00. However, the level of 1587.75 is very strong, and its breakout will become possible only in case of increasing tension between Iran and the USA, spread of the Chinese virus, or deterioration of the US macroeconomic background.
Technical indicators confirm the growth forecast: MACD shows growth in the volume of long positions and Bollinger Bands are directed upwards.
Support levels: 1575.70, 1571.00, 1569.00, 1563.50, 1560.00.
Resistance levels: 1580.60, 1586.00, 1587.75, 1590.00, 1600.00.
Trading tips
In this situation, short positions may be opened from the current level with the target at 1563.50 and stop-loss at 1582.00.
XAU/USD: общий обзор
Текущая динамика
Цена на золото остаётся высокой на фоне вооружённого конфликта между США и Ираном, неоднозначной ситуации по Brexit, экономического спада в США, слухов по поводу возможного импичмента Дональда Трампа и смертельного вируса в Китае. Все эти факторы оказали серьёзное влияние на рост спроса на драгоценный металл, поскольку золото традиционно является «активом-убежищем». Импульс роста, полученный во время обострения американо-иранских отношений, сейчас уменьшился, но цена инструмента вниз серьёзно не скорректировалась. За последние две недели золото снова выросло в цене более чем на 40 долларов за унцию.
Уровни поддержки и сопротивления
Инструмент перешёл в боковой сужающийся диапазон и, пройдя 4000 пунктов, достиг верхней границы этого диапазона. Поэтому можно рассчитывать на формирование новой нисходящей волны к уровням 1563.50, 1560.00. Альтернативным сценарием будет дальнейший рост, пробой ключевого уровня сопротивления 1587.75 и рост выше отметки 1600.00. Однако уровень 1587.75 очень силён, и его преодоление станет возможным только в случае нарастания напряжённости между Ираном и США, распространения китайского вируса, либо ухудшения макроэкономического фона в США.
Технические индикаторы подтверждают прогноз роста: MACD указывает на рост объёма длинных позиций, а полосы Боллинджера направлены вверх.
Уровни поддержки: 1575.70, 1571.00, 1569.00, 1563.50, 1560.00.
Уровни сопротивления: 1580.60, 1586.00, 1587.75, 1590.00, 1600.00.
Торговые сценарии
В данной ситуации актуально открывать короткие позиции от текущего уровня с целью 1563.50 и стоп-лоссом 1582.00.
LiteFinance

USD/CAD: growth is possible
Current trend
The USD/CAD pair continues to grow over three trading weeks and has already passed more than 250 points. The main catalyst for the dynamics is strong US economic data. In particular, the instrument was positively affected by the growth of the consumer confidence index from CB to 131.6 points, which is the best indicator since last August, and the increase in the volume of orders for durable goods by 2.4%. Yesterday, the US Federal Reserve left the key interest rate unchanged. Officials noted that current monetary policy continues to support the growth of the US economy. Pressure on the Canadian currency is also exerted by a decline in oil prices amid an epidemic in China.
Today, the US will publish data on economic growth rates for the fourth quarter of last year, it is expected that the indicator will remain at the same level of 2.1%.
Support and resistance
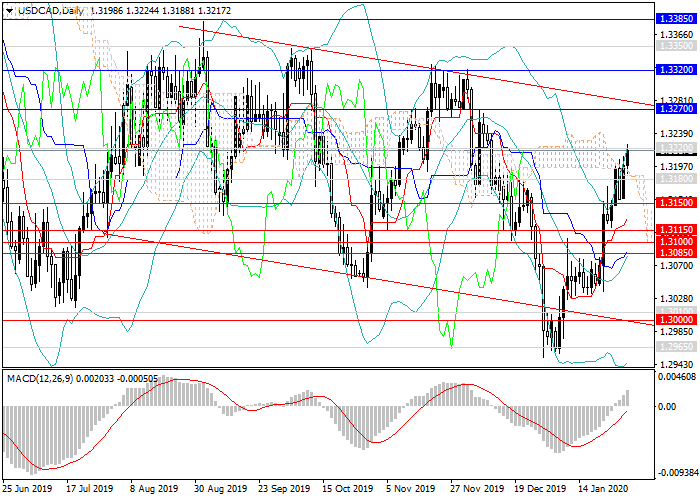
In the short term, the pair will continue to strengthen to the key resistance level of 1.3270, and in case of a breakout, it will grow to the levels of 1.3320, 1.3385 up to the local maximums 1.3560, 1.3670. The main catalyst for the positive dynamics will be the increased investor interest in the US currency. Otherwise, the movement to the first strong resistance level 1.3270 and a reversal and transition to the formation of a downward wave are possible.
Technical indicators confirm the growth forecast: the volumes of long MACD positions are growing, and Bollinger bands are reversing upwards.
Resistance levels: 1.3120, 1.3270, 1.3320, 1.3350, 1.3385, 1.3450.
Support levels: 1.3150, 1.3115, 1.3100, 1.3085, 1.3000.
Trading tips
Long positions may be opened with the targets at 1.3320, 1.3385 and stop loss 1.3160.
USD/CAD: возможен рост
Текущая динамика
Пара USD/CAD продолжает расти на протяжении трёх торговых недель и уже прошла уже более 250 пунктов. Основным катализатором динамики сейчас служат сильные американские экономические данные. В частности, на инструмент положительно повлиял рост индекса потребительского доверия от CB до 131,6 пункта, что является лучшим показателем с августа прошлого года, и увеличение объёма заказов на товары длительного пользования на 2,4%. Накануне ФРС США оставил ключевую процентную ставку без изменения. Чиновники отметили, что текущая денежно-кредитная политика продолжает поддерживать рост американской экономики. Давление на канадскую валюту оказывает также снижение нефтяных цен на фоне эпидемии в КНР.
Сегодня в США будут опубликованы данные по темпам роста экономики за четвёртый квартал минувшего года, ожидается, что показатель останется на прежнем уровне 2,1%.
Уровни поддержки и сопротивления
В краткосрочной перспективе пара продолжит укрепляться к ключевому уровню сопротивления 1.3270, а в случае его пробоя будет расти к отметкам 1.3320, 1.3385 вплоть до локальных максимумов 1.3560, 1.3670. Основным катализатором положительной динамики будет усиление инвесторского интереса к американской валюте. Альтернативным сценарием является движение к первому сильному уровню сопротивления 1.3270, после чего возможен разворот и переход к формированию нисходящей волны.
Технические индикаторы подтверждают прогноз роста: объёмы длинных позиций MACD растут, а полосы Боллинджера перестраиваются вверх.
Уровни сопротивления: 1.3120, 1.3270, 1.3320, 1.3350, 1.3385, 1.3450.
Уровни поддержки: 1.3150, 1.3115, 1.3100, 1.3085, 1.3000.
Торговые сценарии
Длинные позиции можно открывать с целями 1.3320, 1.3385 и стоп-лоссом 1.3160.
Current trend
The USD/CAD pair continues to grow over three trading weeks and has already passed more than 250 points. The main catalyst for the dynamics is strong US economic data. In particular, the instrument was positively affected by the growth of the consumer confidence index from CB to 131.6 points, which is the best indicator since last August, and the increase in the volume of orders for durable goods by 2.4%. Yesterday, the US Federal Reserve left the key interest rate unchanged. Officials noted that current monetary policy continues to support the growth of the US economy. Pressure on the Canadian currency is also exerted by a decline in oil prices amid an epidemic in China.
Today, the US will publish data on economic growth rates for the fourth quarter of last year, it is expected that the indicator will remain at the same level of 2.1%.
Support and resistance
In the short term, the pair will continue to strengthen to the key resistance level of 1.3270, and in case of a breakout, it will grow to the levels of 1.3320, 1.3385 up to the local maximums 1.3560, 1.3670. The main catalyst for the positive dynamics will be the increased investor interest in the US currency. Otherwise, the movement to the first strong resistance level 1.3270 and a reversal and transition to the formation of a downward wave are possible.
Technical indicators confirm the growth forecast: the volumes of long MACD positions are growing, and Bollinger bands are reversing upwards.
Resistance levels: 1.3120, 1.3270, 1.3320, 1.3350, 1.3385, 1.3450.
Support levels: 1.3150, 1.3115, 1.3100, 1.3085, 1.3000.
Trading tips
Long positions may be opened with the targets at 1.3320, 1.3385 and stop loss 1.3160.
USD/CAD: возможен рост
Текущая динамика
Пара USD/CAD продолжает расти на протяжении трёх торговых недель и уже прошла уже более 250 пунктов. Основным катализатором динамики сейчас служат сильные американские экономические данные. В частности, на инструмент положительно повлиял рост индекса потребительского доверия от CB до 131,6 пункта, что является лучшим показателем с августа прошлого года, и увеличение объёма заказов на товары длительного пользования на 2,4%. Накануне ФРС США оставил ключевую процентную ставку без изменения. Чиновники отметили, что текущая денежно-кредитная политика продолжает поддерживать рост американской экономики. Давление на канадскую валюту оказывает также снижение нефтяных цен на фоне эпидемии в КНР.
Сегодня в США будут опубликованы данные по темпам роста экономики за четвёртый квартал минувшего года, ожидается, что показатель останется на прежнем уровне 2,1%.
Уровни поддержки и сопротивления
В краткосрочной перспективе пара продолжит укрепляться к ключевому уровню сопротивления 1.3270, а в случае его пробоя будет расти к отметкам 1.3320, 1.3385 вплоть до локальных максимумов 1.3560, 1.3670. Основным катализатором положительной динамики будет усиление инвесторского интереса к американской валюте. Альтернативным сценарием является движение к первому сильному уровню сопротивления 1.3270, после чего возможен разворот и переход к формированию нисходящей волны.
Технические индикаторы подтверждают прогноз роста: объёмы длинных позиций MACD растут, а полосы Боллинджера перестраиваются вверх.
Уровни сопротивления: 1.3120, 1.3270, 1.3320, 1.3350, 1.3385, 1.3450.
Уровни поддержки: 1.3150, 1.3115, 1.3100, 1.3085, 1.3000.
Торговые сценарии
Длинные позиции можно открывать с целями 1.3320, 1.3385 и стоп-лоссом 1.3160.
LiteFinance
USD/CHF: a downward trend
Current trend
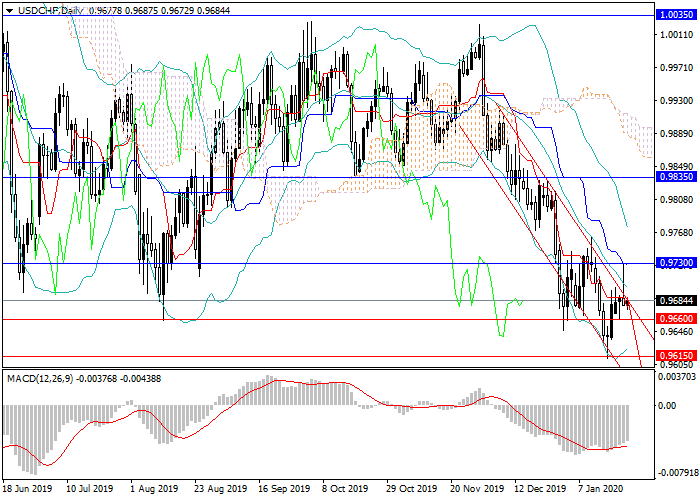
The pair USD/CHF has been staying within a downward trend over the past two months. In mid-January, the price broke the local minimum of last August, at 0.9660 and fell further, testing the level of 0.9615. The main catalyst for the decline was the negative data on major indices, industrial production and the construction sector in the United States. Yesterday, the instrument tried to leave the downward channel, rising to the level of 0.9730 but failed to go higher. The price reversed downwards, returning to the downward range. Now, the price is near the upper border of the downward channel at 0.9680.
At the end of the current trading week, there are no key releases in the economic calendar, which means that the dynamics will depend on technical factors.
Support and resistance
In the medium term, a downward trend may continue with testing new local lows. In January-February, the pair can test the level of 0.9540, which is the local minimum of September 2018. At the moment, the pair is expected to move within the trend. A reversal from the downward range and consolidation within a few trading days will be considered a reversal.
Technical indicators confirm the forecast of a further decline: the volumes of short MACD positions are growing, and Bollinger bands are directed downwards.
Resistance levels: 0.9730, 0.9835, 0.9900, 1.0035.
Support levels: 0.9660, 0.9615, 0.9600, 0.9540, 0.9500, 0.9430.
Trading tips
Short positions may be opened from the current level with the targets at 0.6515, 0.6540 and stop loss 0.9720.
USD/CHF: движение в рамках нисходящей тенденции
Текущая динамика
Пара USD/CHF сохраняет нисходящую динамику на протяжении последних двух месяцев. В середине января цена преодолела локальный минимум августа, минувшего года на отметке 0.9660 и устремилась ниже, протестировав уровень 0.9615. Основным катализатором снижения стали негативные данные по основным индексам, промышленному производству и строительному сектору в США. Вчера инструмент попытался покинуть нисходящий канал, поднявшись к отметке 0.9730, но не сумел пойти выше. Курс развернулся вниз, вернувшись в нисходящий диапазон. Сейчас цена находится вблизи верхней границы нисходящего канала на уровне 0.9680.
В конце текущей торговой недели в экономическом календаре отсутствуют ключевые релизы, а значит, динамика будет зависеть от технических факторов.
Уровни поддержки и сопротивления
В среднесрочной перспективе ожидается сохранение нисходящей тенденции с тестированием новых локальных минимумов. Уже в январе-феврале пара может протестировать отметку 0.9540 — локальный минимум сентября 2018 года. На текущий момент стоит рассматривать лишь движение по тренду, разворотом будет считаться выход из нисходящего диапазона и закрепление в течение нескольких торговых дней.
Технические индикаторы подтверждают прогноз дальнейшего снижения: объёмы коротких позиций MACD растут, а полосы Боллинджера направлены вниз.
Уровни сопротивления: 0.9730, 0.9835, 0.9900, 1.0035.
Уровни поддержки: 0.9660, 0.9615, 0.9600, 0.9540, 0.9500, 0.9430.
Торговые сценарии
Короткие позиции можно открывать от текущего уровня с целями 0.6515, 0.6540 и стоп-лоссом 0.9720.
Current trend
The pair USD/CHF has been staying within a downward trend over the past two months. In mid-January, the price broke the local minimum of last August, at 0.9660 and fell further, testing the level of 0.9615. The main catalyst for the decline was the negative data on major indices, industrial production and the construction sector in the United States. Yesterday, the instrument tried to leave the downward channel, rising to the level of 0.9730 but failed to go higher. The price reversed downwards, returning to the downward range. Now, the price is near the upper border of the downward channel at 0.9680.
At the end of the current trading week, there are no key releases in the economic calendar, which means that the dynamics will depend on technical factors.
Support and resistance
In the medium term, a downward trend may continue with testing new local lows. In January-February, the pair can test the level of 0.9540, which is the local minimum of September 2018. At the moment, the pair is expected to move within the trend. A reversal from the downward range and consolidation within a few trading days will be considered a reversal.
Technical indicators confirm the forecast of a further decline: the volumes of short MACD positions are growing, and Bollinger bands are directed downwards.
Resistance levels: 0.9730, 0.9835, 0.9900, 1.0035.
Support levels: 0.9660, 0.9615, 0.9600, 0.9540, 0.9500, 0.9430.
Trading tips
Short positions may be opened from the current level with the targets at 0.6515, 0.6540 and stop loss 0.9720.
USD/CHF: движение в рамках нисходящей тенденции
Текущая динамика
Пара USD/CHF сохраняет нисходящую динамику на протяжении последних двух месяцев. В середине января цена преодолела локальный минимум августа, минувшего года на отметке 0.9660 и устремилась ниже, протестировав уровень 0.9615. Основным катализатором снижения стали негативные данные по основным индексам, промышленному производству и строительному сектору в США. Вчера инструмент попытался покинуть нисходящий канал, поднявшись к отметке 0.9730, но не сумел пойти выше. Курс развернулся вниз, вернувшись в нисходящий диапазон. Сейчас цена находится вблизи верхней границы нисходящего канала на уровне 0.9680.
В конце текущей торговой недели в экономическом календаре отсутствуют ключевые релизы, а значит, динамика будет зависеть от технических факторов.
Уровни поддержки и сопротивления
В среднесрочной перспективе ожидается сохранение нисходящей тенденции с тестированием новых локальных минимумов. Уже в январе-феврале пара может протестировать отметку 0.9540 — локальный минимум сентября 2018 года. На текущий момент стоит рассматривать лишь движение по тренду, разворотом будет считаться выход из нисходящего диапазона и закрепление в течение нескольких торговых дней.
Технические индикаторы подтверждают прогноз дальнейшего снижения: объёмы коротких позиций MACD растут, а полосы Боллинджера направлены вниз.
Уровни сопротивления: 0.9730, 0.9835, 0.9900, 1.0035.
Уровни поддержки: 0.9660, 0.9615, 0.9600, 0.9540, 0.9500, 0.9430.
Торговые сценарии
Короткие позиции можно открывать от текущего уровня с целями 0.6515, 0.6540 и стоп-лоссом 0.9720.
LiteFinance
USD/JPY: general review
Current trend
Over the course of three weeks, the yen is weakening against the dollar. During this time, the pair gained more than 250 points.
One should note, that the price is rising even amid declining demand for the American currency. The main catalyst for this was the decline in investment interest in the Japanese currency and weak economic statistics, in particular, negative data on business activity in Japan's industry and services. In the middle of the week, the instrument slightly corrected down on weak US inflation data. However, yesterday the dollar resumed strengthening amid US retail sales growth by 0.3% and a decrease in the number of initial jobless claims from 214K to 204K.
Today special attention should be paid to the US industrial output and construction sector.
Support and resistance
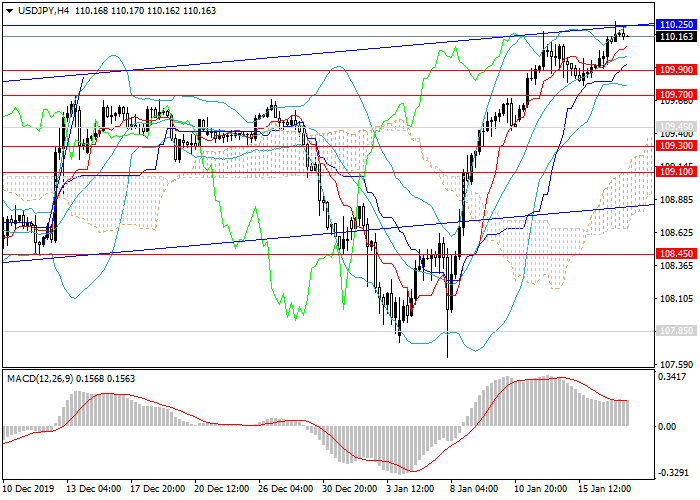
The pair reached the upper border of a wide ascending channel, from which a deeper correction may start. But the main scenario remains the preservation of a steady upward momentum on strong releases from the US and the continuation of the sales of the yen. In this situation, in the medium term, the instrument may grow further to the levels of 110.70, 112.40.
Technical indicators on the H4 chart confirm the continued growth forecast: MACD shows a serious increase in the volume of long positions and Bollinger Bands are directed upwards.
Support levels: 109.90, 109.70, 109.30, 109.10, 108.45.
Resistance levels: 110.25, 110.70, 111.00, 111.50, 112.40.
Trading tips
Long positions may be opened from the current level with the target at 112.40 and stop-loss at 109.30.
USD/JPY: общий обзор
Текущая динамика
На протяжении трёх недель иена теряет позиции по отношению к доллару. За это время пара укрепилась более чем на 250 пунктов.
Стоит отметить, что цена растёт даже в ситуации снижения спроса на американскую валюту. Основным катализатором укрепления стало снижение инвестиционного интереса к японской валюте и слабая экономическая статистика, в частности, негативные данные по деловой активности в промышленности и сфере услуг Японии. В середине недели инструмент незначительно скорректировался вниз на слабых американских данных по инфляции. Однако вчера доллар возобновил укрепление на фоне роста розничных продаж в США на 0,3% и снижения количества первичных заявок на пособие по безработице с 214 до 204 тысяч.
Сегодня особое внимание стоит уделить данным по промышленному производству и строительному сектору США.
Уровни поддержки и сопротивления
Пара достигла верхней границы широкого восходящего канала, от которого может перейти к более глубокой коррекции. Но основным сценарием остаётся сохранение сильного восходящего импульса на сильных релизах из США и продолжения распродаж иены. В этой ситуации стоит рассчитывать на дальнейший рост инструмента к уровням 110.70, 112.40 уже в среднесрочной перспективе.
Технические индикаторы на четырёхчасовом графике подтверждают прогноз дальнейшего роста: MACD указывает на серьёзное увеличение объёма длинных позиций, а полосы Боллинджера направлены вверх.
Уровни поддержки: 109.90, 109.70, 109.30, 109.10, 108.45.
Уровни сопротивления: 110.25, 110.70, 111.00, 111.50, 112.40.
Торговые сценарии
В данной ситуации актуально открывать длинные позиции от текущего уровня с целью 112.40 и стоп-лоссом 109.30.
Current trend
Over the course of three weeks, the yen is weakening against the dollar. During this time, the pair gained more than 250 points.
One should note, that the price is rising even amid declining demand for the American currency. The main catalyst for this was the decline in investment interest in the Japanese currency and weak economic statistics, in particular, negative data on business activity in Japan's industry and services. In the middle of the week, the instrument slightly corrected down on weak US inflation data. However, yesterday the dollar resumed strengthening amid US retail sales growth by 0.3% and a decrease in the number of initial jobless claims from 214K to 204K.
Today special attention should be paid to the US industrial output and construction sector.
Support and resistance
The pair reached the upper border of a wide ascending channel, from which a deeper correction may start. But the main scenario remains the preservation of a steady upward momentum on strong releases from the US and the continuation of the sales of the yen. In this situation, in the medium term, the instrument may grow further to the levels of 110.70, 112.40.
Technical indicators on the H4 chart confirm the continued growth forecast: MACD shows a serious increase in the volume of long positions and Bollinger Bands are directed upwards.
Support levels: 109.90, 109.70, 109.30, 109.10, 108.45.
Resistance levels: 110.25, 110.70, 111.00, 111.50, 112.40.
Trading tips
Long positions may be opened from the current level with the target at 112.40 and stop-loss at 109.30.
USD/JPY: общий обзор
Текущая динамика
На протяжении трёх недель иена теряет позиции по отношению к доллару. За это время пара укрепилась более чем на 250 пунктов.
Стоит отметить, что цена растёт даже в ситуации снижения спроса на американскую валюту. Основным катализатором укрепления стало снижение инвестиционного интереса к японской валюте и слабая экономическая статистика, в частности, негативные данные по деловой активности в промышленности и сфере услуг Японии. В середине недели инструмент незначительно скорректировался вниз на слабых американских данных по инфляции. Однако вчера доллар возобновил укрепление на фоне роста розничных продаж в США на 0,3% и снижения количества первичных заявок на пособие по безработице с 214 до 204 тысяч.
Сегодня особое внимание стоит уделить данным по промышленному производству и строительному сектору США.
Уровни поддержки и сопротивления
Пара достигла верхней границы широкого восходящего канала, от которого может перейти к более глубокой коррекции. Но основным сценарием остаётся сохранение сильного восходящего импульса на сильных релизах из США и продолжения распродаж иены. В этой ситуации стоит рассчитывать на дальнейший рост инструмента к уровням 110.70, 112.40 уже в среднесрочной перспективе.
Технические индикаторы на четырёхчасовом графике подтверждают прогноз дальнейшего роста: MACD указывает на серьёзное увеличение объёма длинных позиций, а полосы Боллинджера направлены вверх.
Уровни поддержки: 109.90, 109.70, 109.30, 109.10, 108.45.
Уровни сопротивления: 110.25, 110.70, 111.00, 111.50, 112.40.
Торговые сценарии
В данной ситуации актуально открывать длинные позиции от текущего уровня с целью 112.40 и стоп-лоссом 109.30.
LiteFinance
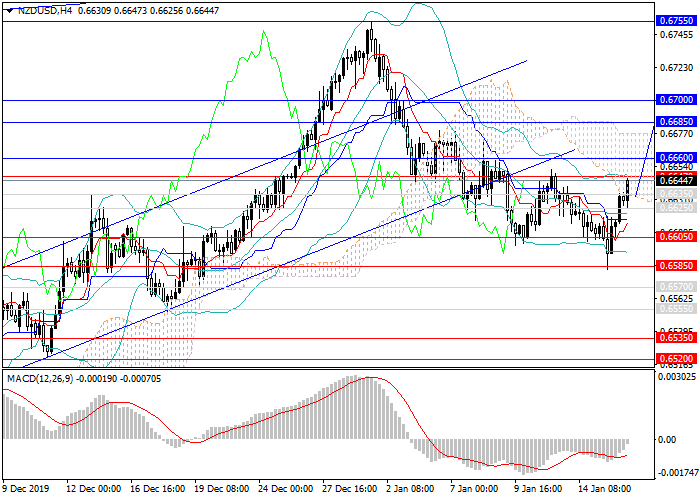
NZD/USD: general review
Current trend
At the end of the year, the pair grew rapidly, gaining more than 500 points. In early January, the instrument began to decline and in two weeks, the US dollar won back more than 150 points.
Yesterday, the pair tested the key support level of 0.6585, but, failing to conaolidate below it, reversed and formed an upward wave. Growth was driven by market reaction to the signing of the long-awaited US-China trade deal.
Today and on Friday, special attention should be paid to data on retail sales and industrial output in the United States. Retail sales are expected to accelerate from 0.2% to 0.3%, while industrial output may decline by 0.2%.
Support and resistance
It is very likely that the downward movement at the beginning of the year was a protracted correction, and in the future, the pair will begin to strengthen again. In the medium term, one should expect growth to key resistance levels of 0.6685, 0.6700, 0.6770 amid the next wave of falling demand for USD due to negative statistics and political tensions in the United States.
Technical indicators on the D1 chart confirm the continued growth forecast: MACD indicates the preservation of the high volume of long positions, and Bollinger Bands are directed upwards.
Support levels: 0.6660, 0.6685, 0.6700, 0.6755, 0.6770, 0.6800.
Resistance levels: 0.6635, 0.6625, 0.6605, 0.6570, 0.6555.
NZD/USD: общий обзор
Текущая динамика
В конце года пара стремительно росла, набрав более 500 пунктов. В начале января инструмент перешёл к снижению и за две недели американский доллар отыграл более 150 пунктов.
Вчера пара протестировала ключевой уровень поддержки 0.6585, но, не сумев закрепиться ниже него, развернулась и сформировала восходящую волну. Рост был обусловлен реакцией рынка на подписание долгожданной торговой сделки между США и КНР.
Сегодня и в пятницу особое внимание стоит уделить выходу данных по розничным продажам и промышленному производству в США. Ожидается, что объём розничных продаж может ускориться с 0,2% до 0,3%, а объём промышленного производства – сократиться на 0,2%.
Уровни поддержки и сопротивления
Велика вероятность того, что нисходящее движение в начале года было затянувшейся коррекцией, и в дальнейшем пара снова станет укрепляться. В среднесрочной перспективе стоит рассчитывать на рост к ключевым уровням сопротивления 0.6685, 0.6700, 0.6770 на очередной волне снижения спроса на USD из-за негативной статистики и политической напряжённости в США.
Технические индикаторы на дневном графике подтверждают прогноз дальнейшего роста: MACD указывает на сохранение большого объёма длинных позиций, а полосы Боллинджера направлены вверх.
Уровни поддержки: 0.6660, 0.6685, 0.6700, 0.6755, 0.6770, 0.6800.
Уровни сопротивления: 0.6635, 0.6625, 0.6605, 0.6570, 0.6555.
LiteFinance
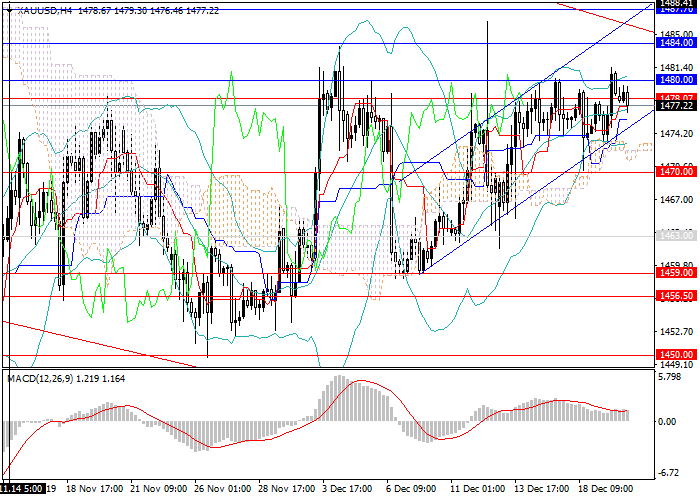
XAU/USD: general analysis
Current trend
The price of the precious metal is moving within a long-term downward trend. In early December, the instrument moved to growth, and over the past two trading weeks gained more than 200 points. Now, the rate has reached 1480.00. The main catalyst for growth remains the decline in demand for the US currency against the background of poor macroeconomic statistics for the main sectors of the US economy. The upward momentum will continue until the upper border of the long-term downward channel at the levels of 1484.00, 1487.70.
Today, Q3 data on the growth rate of the US economy will be published. GDP is expected to accelerate growth from 2.0% to 2.1%. The implementation of forecasts may support the American dollar.
Support and resistance
In the medium term, testing of new local maximums 1484.00, 1487.70 with a subsequent reversal and a downward correction formation are expected. A longer growth to 1493.00, 1495.00 before the reversal is possible. Otherwise, the instrument can break the level of 1500.00 and strengthen significantly but this version of the movement is unlikely within the medium term. Most likely, the price will form a downward trend to 1470.00, 1459.00 and from them grow to the highs of early November 1500.00, 1510.00, 1512.00.
Technical indicators still give a signal of growth: high volumes of long MACD positions remain but the volume of the histogram is gradually decreasing. On the daily chart, Bollinger bands lined up in parallel, which indicates a high probability of the formation of wide sideways consolidation.
Resistance levels: 1480.00, 1484.00, 1487.70, 1500.00, 1510.00.
Support levels: 1475.00, 1470.00, 1463.00, 1459.00, 1456.50, 1450.00
Trading tips
Pending short positions may be opened from 1484.00, 1487.70 with the targets at 1459.00, 1456.50 and stop loss 1490.70.
XAU/USD: общий обзор
Текущая динамика
Цена на драгоценный металл находится в долгосрочной нисходящей тенденции. В начале декабря инструмент перешёл к росту, а на протяжении последних двух торговых недель набрал более 200 пунктов. Сейчас курс достиг отметки 1480.00. Основным катализатором роста остаётся снижение спроса на американскую валюту на фоне слабой макроэкономической статистики по основным секторам экономики США. Восходящий импульс сохранится вплоть до верхней границы долгосрочного нисходящего канала на уровнях 1484.00, 1487.70.
Сегодня будут опубликованы данные по темпам роста экономики США за третий квартал. Ожидается, что ВВП может ускорить рост с 2,0% до 2,1%. Реализация прогнозов может поддержать американский доллар.
Уровни поддержки и сопротивления
В среднесрочной перспективе ожидается тестирование новых локальных максимумов на отметках 1484.00, 1487.70 с последующим разворотом и формированием нисходящей коррекции. Стоит рассматривать и более затяжной рост с целями 1493.00, 1495.00 перед разворотом. Альтернативным сценарием будет значительное усиление инструмента после пробоя уровня 1500.00, но этот вариант движения маловероятен в рамках среднесрочной перспективы. Скорее всего, цена сначала сформирует нисходящую тенденцию к отметкам 1470.00, 1459.00 и уже от них пойдёт к максимумам начала ноября на уровнях 1500.00, 1510.00, 1512.00.
Технические индикаторы по-прежнему дают сигнал роста: высокие объёмы длинных позиций MACD сохраняются, но объём гистограммы постепенно снижается. На дневном графике полосы Боллинджера выстроились параллельно, что указывает на высокую вероятность формирования широкой боковой консолидации.
Уровни сопротивления: 1480.00, 1484.00, 1487.70, 1500.00, 1510.00.
Уровни поддержки: 1475.00, 1470.00, 1463.00, 1459.00, 1456.50, 1450.00.
Торговые сценарии
Отложенные короткие позиции можно открывать от уровней 1484.00, 1487.70 с целями 1459.00, 1456.50 и стоп-лоссом 1490.70.
LiteFinance
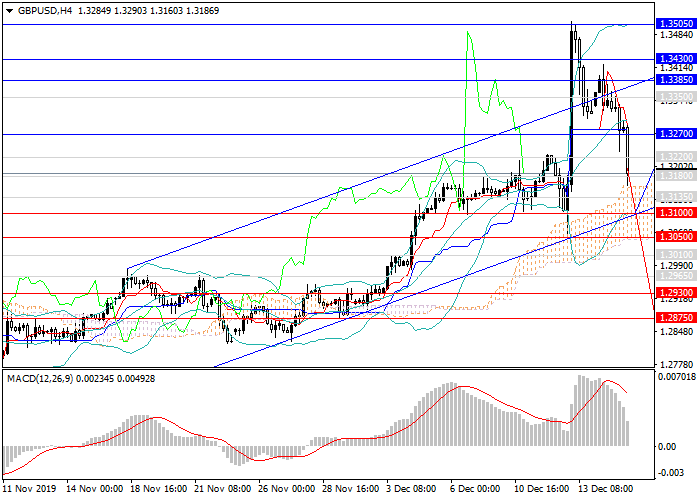
GBP/USD: upward trend coming
Current trend
GBP is in the downward correction after the rapid growth caused by the victory of conservatives in the UK parliamentary elections. The main catalyst for the decline was a sharp drop in demand for GBP after the closing of a large volume of long positions at the peak. The GBP/USD pair is under pressure of poor preliminary November UK data. Thus, Manufacturing PMI decreased from 48.9 to 47.4 points, and Services PMI fell from 49.3 to 49.0 points.
Today, American data on industrial production and the construction sector will be published, which may be positive and put additional pressure on the instrument. In the second half of the week, traders will focus on the UK GDP and the BoE interest rate decision. The US will publish statistics on economic growth and the labor market. The data will add dynamics to the pair and can determine the direction of its further movement.
Support and resistance
In the short term, the pair will reach the current channel lower border (1.3100). Later, a reversal and the ascending wave formation is possible, afterward, a transition to wide sideways consolidation with subsequent growth to new local highs are expected. Otherwise, a breakdown of the range lower limit, consolidation and a transition to a further decrease to the levels of 1.2875, 1.2800 are possible. The course stays in an uptrend, which will stimulate the growth of the volume of long positions.
Technical indicators confirm the forecast for further growth, high volumes of long MACD positions remain, and Bollinger bands are directed upwards.
Resistance levels: 1.3220, 1.3270, 1.3350, 1.3385, 1.3430, 1.3505.
Support levels: 1.3180, 1.3135, 1.3100, 1.3050, 1.3010, 1.2965, 1.2930.
Trading tips
Long positions may be opened from the current level with the targets at 1.3430, 1.3505 and stop loss 1.3080.
LiteFinance
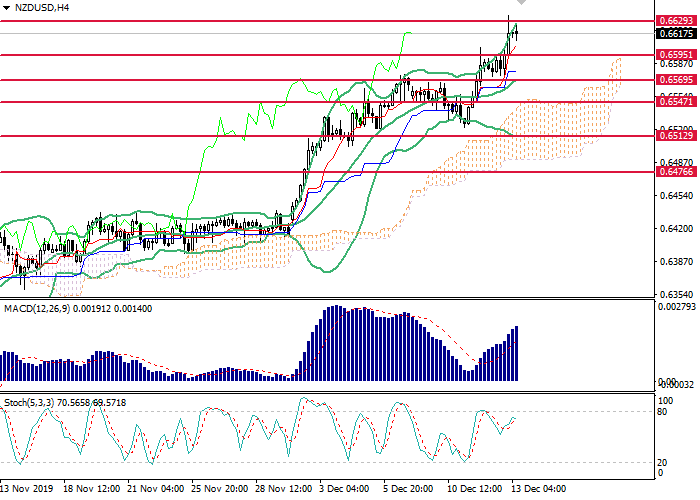
NZD/USD: general review
Current trend
The pair continues to trade within the uptrend. The main support was provided by the announcement of the Fed's monetary policy plans.
The regulator kept the rate at 1.75%. Inflation is significantly below the target level, so in 2020, the Fed will likely be inactive. NZD ignored the decline in manufacturing activity and accelerated migration, while positive macroeconomic releases from New Zealand and China continue to provide moderate support to it. Such dynamics indicates that the further direction of the global market entirely depends on the decision of US President Donald Trump on tariffs. On Thursday, The Wall Street Journal announced Washington’s readiness to cut them by 50%. There's no official statements, but the media indicate that significant progress in the negotiations will be achieved in the coming days and tariffs will be at least delayed. If duties can be delayed or reduced, the pair will continue to grow, while inaction and the change of plans of the US leader will put strong pressure on the instrument.
Statistics on the US retail sales is due today at 15:30 (GMT+2).
Support and resistance
The H4 chart shows the uptrend correction. The instrument is trading near the upper border of Bollinger Bands. The indicator is directed upwards, while the price range is expanding, indicating further growth. MACD histogram is in the positive zone, a buy signal is still relevant. Stochastic is approaching the overbought area, there is no signal for entering the market.
Support levels: 0.6595, 0.6569, 0.6547, 0.6513, 0.6476.
Resistance levels: 0.6629, 0.6657, 0.6684.
Trading tips
Long positions may be opened above 0.6635 with the target at 0.6690 and stop-loss at 0.6595. Implementation period: 1-2 days.
Short positions may be opened below 0.6585 with the target at 0.6510 and stop-loss at 0.6610. Implementation period: 1-3 days.
LiteFinance
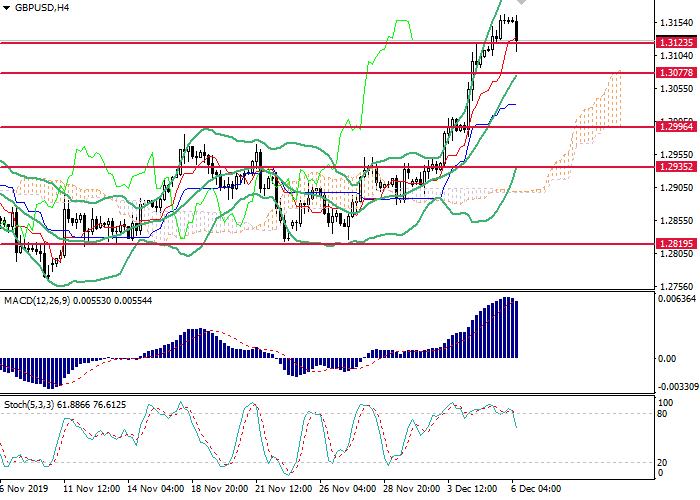
GBP/USD: general analysis
Current trend
This week, GBP strengthened significantly against major currencies and is currently trading near 7-month highs.
On Wednesday, the GBP/USD pair received a strong impetus for growth after the publication of positive British data and poor US data. UK PMI retreated from the lows and exceeded the forecast but has not yet reached a key level of 50 basis points. US ADP Nonfarm Payrolls grew by 67K for November, while an increase of 140K was expected.
Before the election, British statistics have little effect on the dynamics of the instrument. The protracted Brexit negatively affects performance in all sectors of the British economy. Inflation moves away from target levels, which may eventually force the Bank of England to lower its key rate. In the medium-term, GBP is supported by British Prime Minister Boris Jones’ speech, although in general, he did not say anything new, speaking with the usual populist rhetoric. The political factor makes the British currency vulnerable.
Today, the traders are focused on the US labor market data release at 15:30 (GMT+2). Experts predict significant growth, while there are more arguments in favor of poor reports. In this situation, market participants expect a surge in volatility.
Support and resistance
On a 4-hour chart, the instrument trades at Bollinger Bands’ top. The indicator is directed upwards, and the price range expanded, indicating a continuation of the uptrend. MACD keeps a strong buy signal. Stochastic left the overbought zone, generating a strong sell signal.
Resistance levels: 1.3212, 1.3283, 1.3350, 1.3393.
Support levels: 1.3123, 1.3077, 1.2997, 1.2935, 1.2819.
Trading tips
Short positions may be opened below 1.3080 with the target at 1.2955 and stop loss 1.3110.
Long positions may be opened above 1.3175 with the target at 1.3260 and stop loss 1.3140.
Implementation period: 1–2 days.
GBP/USD: общий анализ
Текущая динамика
На текущей неделе британский фунт существенно укрепился по отношению к основным валютам и в настоящий момент торгуется вблизи 7-месячных максимумов.
В среду пара GBP/USD получила сильный импульс для роста после публикации позитивных британских данных и слабых данных США. Индекс деловой активности в Великобритании отступил от минимумов и превысил прогноз, однако ещё не достиг ключевого уровня в 50 базисных пункта. По данным ADP, число занятых вне сельского хозяйства в США в ноябре выросло на 67 тысяч человек, в то время как ожидался рост на 140 тысяч.
В преддверии выборов британская статистика оказывает незначительное влияние на динамику инструмента. Затяжной Brexit негативно влияет на показатели во всех секторах британской экономики. Инфляция отдаляется от целевых уровней, что в итоге может заставить Банк Англии снизить ключевую ставку. Среднесрочную поддержку фунту обеспечили заявления премьера Великобритании Бориса Джонса, хотя в целом британский премьер не сказал ничего нового, выступив с уже привычной популистской риторикой. Политический фактор делает британскую валюту уязвимой.
Ключевым событием сегодняшнего дня является публикация данных по американскому рынку труда в 15:30 (GMT+2). Специалисты прогнозируют существенный рост, в то время как аргументов в пользу слабых отчётов больше. В сложившейся ситуации участники рынка ожидают всплеск волатильности.
Уровни поддержки и сопротивления
На 4-часовом графике инструмент торгуется в верхней части полос Боллинджера. Индикатор направлен вверх, а ценовой диапазон расширился, что указывает на продолжение восходящего тренда. Гистограмма MACD удерживает сильный сигнал на покупку. Стохастик покинул область перекупленности, сформировав сильный сигнал на продажу.
Уровни сопротивления: 1.3212, 1.3283, 1.3350, 1.3393.
Уровни поддержки: 1.3123, 1.3077, 1.2997, 1.2935, 1.2819.
Торговые сценарии
Короткие позиции можно открывать ниже уровня 1.3080 с целью 1.2955 и стоп-лоссом на уровне 1.3110.
Длинные позиции можно открывать выше уровня 1.3175 с целью 1.3260 и стоп-лоссом на уровне 1.3140.
Срок реализации: 1–2 дня.
LiteFinance
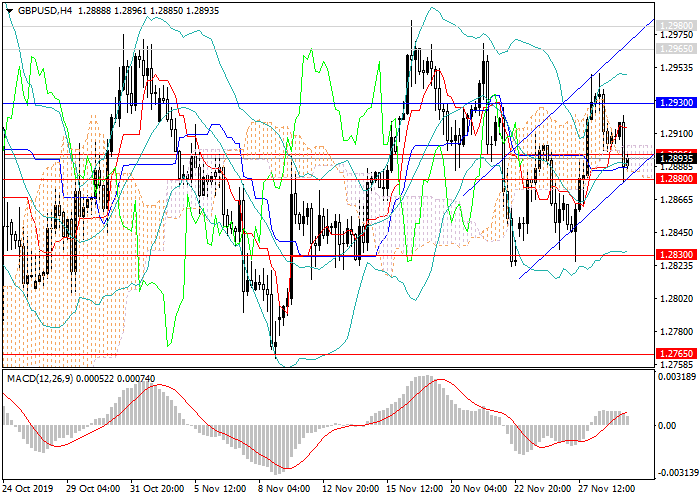
GBP/USD: restoration of growth
Current trend
After significant growth at the beginning of October, the GBP/USD pair has been moving within the framework of wide sideways consolidation for a month and a half. The channel is narrowing, and very soon, the price will determine the direction of further movement. The main catalyst for the current trend is ambiguous statistics in the US and the UK but the instrument is pressured by high demand for the US currency.
Yesterday, strong data on economic growth rates came out in the US but recently, data on key sectors of the US economy, including inflation and the labor market, have been weak.
Support and resistance
The next testing of the upper border of the sideways canal is expected at the level of local highs at 1.2965, 1.2980. In the future, a breakout of the levels and the resumption of growth to the levels of 1.3270, 1.3430 is expected. Otherwise, a transition to a deeper correction with the target at 1.2660 and the formation of an upward wave from it to new local maximums is possible.
On the daily and weekly charts, technical indicators confirm the growth forecast: high volumes of long MACD positions remain, and Bollinger bands are directed upwards.
Resistance levels: 1.2930, 1.2965, 1.2980, 1.3000, 1.3030, 1.3050, 1.3270, 1.3430.
Support levels: 1.2880, 1.2830, 1.2765, 1.2700, 1.2650, 1.2630, 1.2550, 1.2500.
Trading tips
Long positions may be opened from the current level with the targets at 1.3050, 1.3270, 1.3430 and stop loss 1.2790.
GBP/USD: возобновление роста
Текущая динамика
После значительного роста в начале октября пара GBP/USD на протяжении полутора месяцев движется в рамках широкой боковой консолидации. Канал сужается, и уже очень скоро цена будет определяться с направлением дальнейшего движения. Основным катализатором текущей динамики является разнонаправленная статистика по США и Великобритании, однако на инструмент оказывает давление высокий спрос на американскую валюту.
Вчера в США вышли сильные данные по темпам роста экономики, но за последнее время данные по основным секторам американской экономики, в том числе по инфляции и рынку труда, были слабыми.
Уровни поддержки и сопротивления
Ожидается очередное тестирование верхней границы бокового канала на уровне локальных максимумов 1.2965, 1.2980. В дальнейшем ожидается пробой этих отметок и возобновление роста к уровням 1.3270, 1.3430. Альтернативным сценарием будет переход к более глубокой коррекции с целью 1.2660 и формированием от неё восходящей волны к новым локальным максимумам.
На дневном и недельном графике технические индикаторы подтверждают прогноз роста: высокие объёмы длинных позиций MACD сохраняются, а полосы Боллинджера направлены вверх.
Уровни сопротивления: 1.2930, 1.2965, 1.2980, 1.3000, 1.3030, 1.3050, 1.3270, 1.3430.
Уровни поддержки: 1.2880, 1.2830, 1.2765, 1.2700, 1.2650, 1.2630, 1.2550, 1.2500.
: