• Обзор
  • Отзывы
  • Обсуждение

NTL HLines

HLines User Guide

Overview and Features

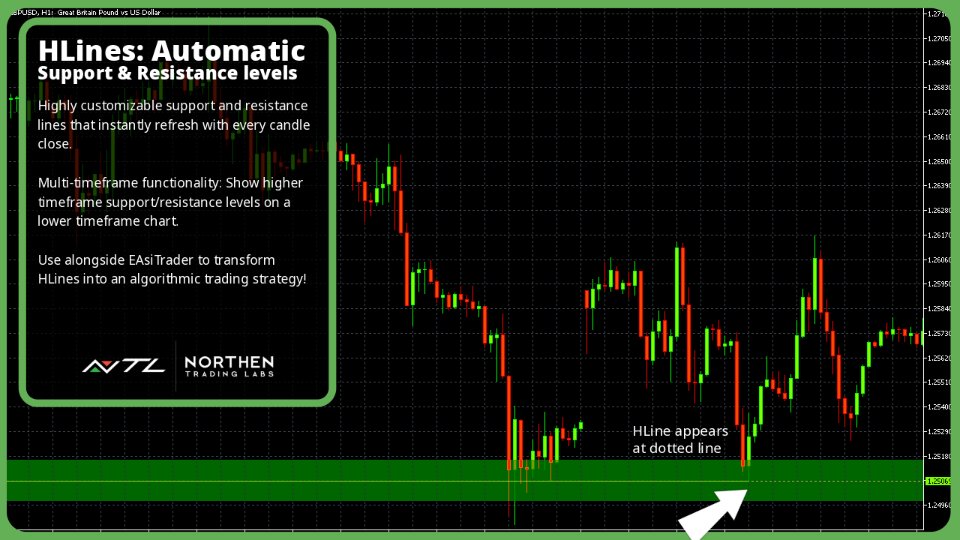
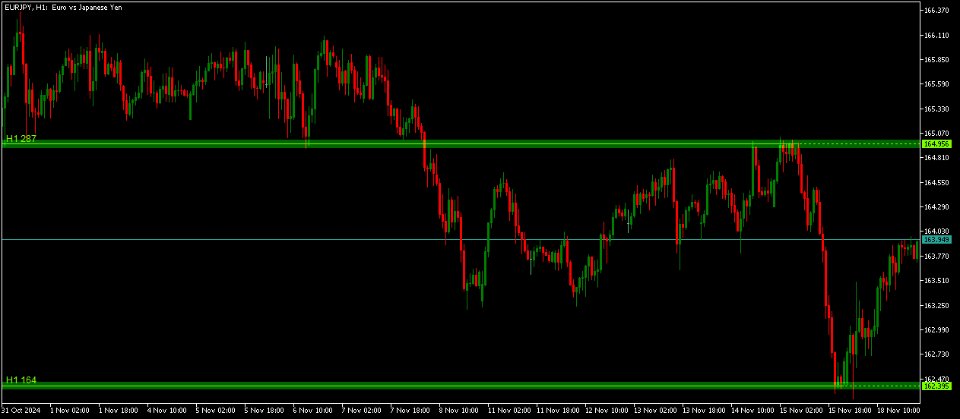
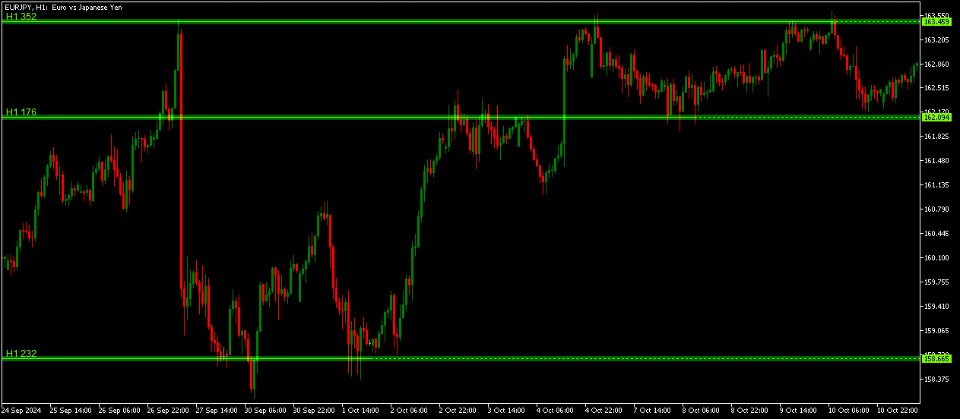
The NTL HLines Indicator is designed to elevate your trading with precise support and resistance analysis. Utilizing a sophisticated algorithm, this MQL5 indicator scans for high-probability price levels across multiple timeframes, helping traders pinpoint strategic entry and exit zones. With fully customizable pivot scanning and multi-timeframe support, HLines provides a powerful, adaptable toolset for traders of all experience levels.

Key features include customizable Pivot String and Pivot Order settings, allowing traders to define unique patterns of support and resistance pivots. HLines automatically adjusts these levels in real time, reducing subjectivity and maintaining clarity in fast-moving markets. This indicator is compatible with the EAsiTrader EA, offering seamless integration for automated trading strategies. Whether you’re focused on short-term trading or longer-term trend analysis, HLines helps you make data-driven decisions with greater confidence.

Key Features

  • Custom Pivot Scanning
    This feature allows traders to search key pivot points within price action for specific sequences of support and resistance pivots, such as a strong support level followed by a key resistance level, or any custom-defined combination that aligns with their strategy enabling traders to spot optimal entry and exit points with greater confidence.

  • Automatic Line Adjustments
    Continuously updates support and resistance lines to reflect the latest market data, allowing traders to maintain a clear view of critical price zones in real time and stay focused on strategic decision-making.

  • Customizable Settings for Line Sensitivity
    Allows traders to adjust the sensitivity of line generation to suit their unique trading strategy, from short-term scalping to long-term positioning.

  • Multi-Timeframe Scanning: Whether trading on the 1-minute chart or the monthly chart, HLines adapts seamlessly, allowing users to examine support and resistance lines across multiple timeframes, from intra-day to long-term perspectives. Note: To use this feature effectively, fully load tick data for your desired timeframe.

  • Reduces Subjectivity: Manual identification of patterns can be subjective, while HLines applies consistent criteria.

  • Compatible with EAsiTrader EA: Provides signals to NTL EAsiTrader EA for automated trading.

Installation and Settings

This section provides the installation steps for setting up the HLines indicator on the MQL5 platform, as well as detailed explanations of customizable settings to configure it for optimal performance.

Installation

  1. Install the Indicator:

    • Download the HLines indicator file (HLines.ex5) and place it in the  Indicators\NTL  folder in your MQL5 platform directory. If this folder does not exist, create it manually.
    • Typical path:  Terminal -> MQL5 -> Indicators -> NTL . Restart the platform to make the indicator appear in the Navigator panel.
  2. Apply to a Chart:

    • Open your desired chart, select the symbol and timeframe.
    • Drag the HLines indicator from the Navigator panel onto your chart.
    • Configure the Input settings to customize HLines, display options, and other parameters.
  3. Customize Settings:

    • Access the Input settings by double-clicking the indicator on the chart or through the Navigator panel.
  4. Save as Template:

    • Save your preferred settings as a template by right-clicking on the chart and selecting  Template -> Save Template . Give it a descriptive name like  HLines_Custom  for easy access.

Settings

Timeframe

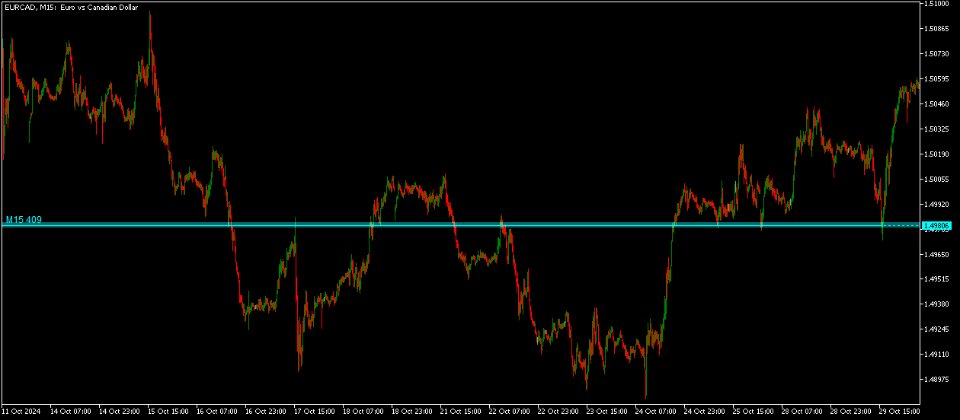
This setting allows you to select the specific timeframe from which HLines will analyze price data, regardless of the chart’s current timeframe. This feature is helpful if you want to analyze support and resistance lines on a higher or lower timeframe than the one currently displayed, giving you a multi-timeframe perspective.

Min Line Strength

Line strength is a measure of the support or resistance line’s importance relative to other lines. Use this setting to specify the minimum strength value of a line that can be shown on the chart. Use values between 20 and 1000.

Pivot String

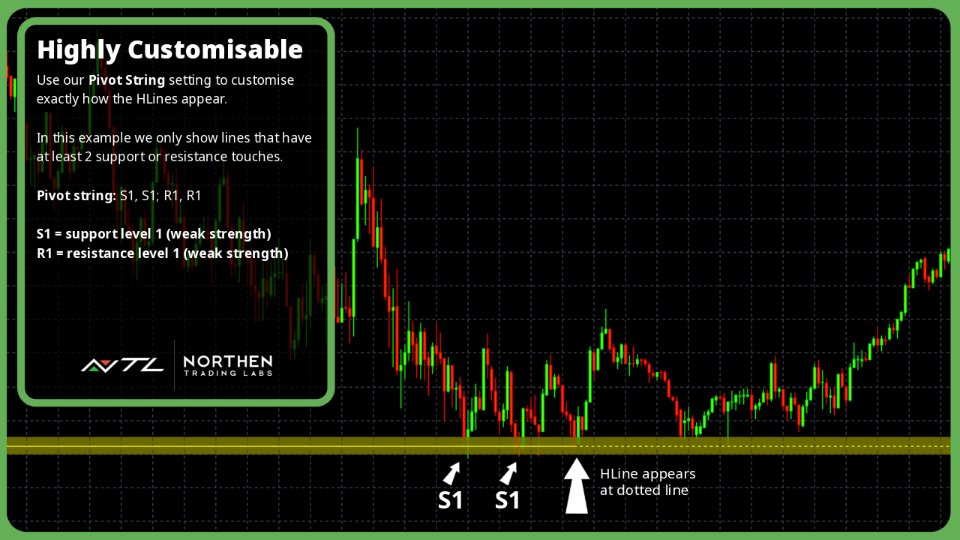
Use this setting to filter line patterns according to their pivot order values. The default value is “S2;R2” meaning HLines will find all support lines with a pivot order value of 2 or more and resistance lines with a pivot order value of 2 or more. Here are more examples:
"S3": matches support lines that have a 3 or greater pivot order value.
"R3": matches resistance lines that have a 3 or greater pivot order value.
"S2;S3": matches support lines that have a 2 or greater pivot order value, or resistance lines that have a 3 or greater pivot order value.
"S3,R3": matches support lines that have a 3 or greater pivot order value followed by a resistance line that has a 3 or greater pivot order. For example, a down trend that finds support, breaks and then find resistance.
"R3,S3": matches resistance lines that have a 3 or greater pivot order value followed by a support line that has a 3 or greater pivot order. For example, an up trend that finds resistance, breaks and then find support.
"S3,R3;R3,S3": matches support lines that have a 3 or greater pivot order value followed by a resistance line that has a 3 or greater pivot order. Or, matches resistance lines that have a 3 or greater pivot order value followed by a support line that has a 3 or greater pivot order.

Max Body Crosses

Defines the maximum number of candle bodies that the support or resistance line can cross before being excluded as a support or resistance line.

Pivot Weight

Defines the tolerance around a candle’s high and low and candle’s body high and body low when calculating line strength and body cross. The smaller this value the less tolerance, meaning support and resistance lines are more precise. More precision usually results in fewer lines.

Overlap Tolerance

Defines the tolerance, in average body height, between adjacent lines of support or resistance. It is used to decide if two adjacent lines should be considered the same line or separate lines. A smaller tolerance will produce more lines whilst a larger tolerance will produce less lines.

ABH Period

Defines the period for the ABH (Average Bar Height) Indicator. HLines uses the ABH Indicator in its calculations to set the value of an average bar height and average body height.

ABH Zone Multiplier

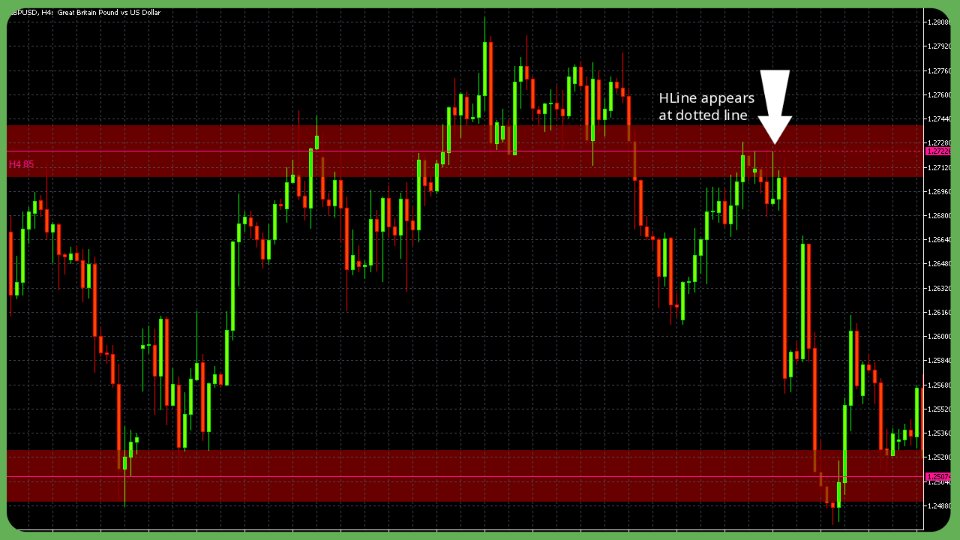
Defines the size of an HLine draw zone above and below the support or resistance lines as a ratio of the average bar height at the time the line is created. A multiplier value of 1.0 draws a zone of half ABH ** 1.0 above and below the line. A multiplier value of 1.5 draws a zone of half ABH * 1.5 above and below the line.

ABH Show Zones

If true, the indicator will draw the zone above and below the lines. If false, no zones are drawn. The zone is an area drawn on the chart above and below each line, whose size is a ratio of the average bar height at the time the line is created. These edges of the zones can be used by traders to set entry, stop loss or take profit prices.

New HLine Alerts

If true, the trader will be alerted with a message in a separate window whenever a new support or resistance line is created. The message includes the symbol, timeframe, local time of the alert and the symbol’s price the line was created. Optionally, a push notification can also be sent to a mobile device.  Tools -> Options -> Notifications

Font Size

Defines the size of font to be used to display the timeframe and strength values on the HLine.

Chart Label Style

Determines the style used to display the timeframe and strength values on the HLine. Use Label to show this information as a simple label, or use Boxed to show the information inside a rectangle box.

Chart Edge Alignment

Allows the trader to align the HLine text content to the left or right edge of the chart.

Advanced Usage and Strategy Integration

Static HLines

To fix an HLine so that it doesn’t get removed when new candles are added, simply click on the HLine - the word Static will appear above the line. Click again to return the HLine to normal.

Leverage HLines to refine complex trading strategies by integrating advanced pivot and support/resistance analysis:

  1. Custom Pivot Sequence for Targeted Signal Generation
    With the Pivot String and Pivot Order settings, traders can construct personalized sequences of support and resistance pivots, enabling focused searches for specific patterns that align with their strategy. For example, combining a high-order support pivot (e.g. S3) followed by a resistance pivot (e.g. R3) can highlight zones of strong trend reversals, providing actionable signals that fit into trend-based or mean-reversion strategies.

  2. Multi-Timeframe Analysis for Strategic Depth
    By configuring HLines to scan higher timeframes, traders can identify significant support and resistance levels from daily or weekly charts while trading on shorter timeframes. This setup allows for more comprehensive analysis, helping to validate signals against broader market trends or longer-term levels.

  3. Dynamic Zone Creation for Entry and Exit Management
    The ABH Zone Multiplier helps define adaptive zones around each line, offering flexible areas where traders can place entry, stop loss, or take profit levels. These zones, based on average bar height, provide a buffer that accommodates minor fluctuations, especially useful in volatile markets.

  4. Automated Alerts for Real-Time Strategy Execution
    HLines can be configured to alert traders when new support or resistance levels are detected. This feature is especially beneficial for strategies that require quick reactions to emerging levels, enabling prompt entries or exits based on the latest market data.

  5. Seamless Integration with EAsiTrader for Automated Trading
    Compatible with NTL’s EAsiTrader EA, the indicator provides automated trading capabilities by sending signals directly to the EA. This feature allows traders to combine manual analysis with automated trade execution, aligning with sophisticated strategies that depend on precision timing.

Insights

Gain deeper insights into market structure and dynamics with HLines’ analytical features:

  1. Pivot Order Depth and Market Significance
    High-order pivots reflect more stable, recurring price levels, suggesting strong support or resistance zones. By focusing on high-order pivots, traders can identify areas with increased probability of price reversal, helping them anticipate potential breakout or reversal points with greater accuracy.

  2. The Role of Sequence in Support and Resistance Strength
    The customizable Pivot String enables traders to spot pivotal sequences, such as a resistance pivot followed by a support pivot, which may indicate a potential shift in market direction. Recognizing these sequences enhances a trader’s ability to interpret market sentiment, allowing for strategic alignment with prevailing trends.

  3. Min Line Strength and Volatility Sensitivity
    The Min Line Strength setting aids in filtering noise by ensuring only significant lines appear on the chart, reducing clutter and focusing attention on levels that are more likely to hold. This sensitivity adjustment is particularly useful in high-volatility periods, where less reliable levels are automatically excluded.

  4. Adaptive Tolerance for Precision Analysis
    The Overlap Tolerance and Pivot Weight settings allow traders to fine-tune the precision of the support and resistance lines, accommodating their specific needs for broader or narrower levels. This flexibility provides an edge in adapting the indicator’s analysis to both trending and ranging market conditions.

Terms

Pivot Order

Ordering pivots ranks price highs and lows based on their significance. The higher the order, the more significant the price compared to lower-ordered pivots.

  • a 0 order high pivot is a bar without a lower high bar on its immediate left (older) and right (newer).
  • a 0 order low pivot is a bar without a higher low bar on its immediate left (older) and right (newer).
  • a 1 order high pivot is a bar with a lower high bar on its immediate left and right.
  • a 1 order low pivot is a bar with a higher low bar on its immediate left and right.
  • a 2 order high pivot is a bar with a 1 order high pivot on its left and right.
  • a 2 order low pivot is a bar with a 1 order low pivot on its left and right.
  • a 3 order pivot has a 2 order pivot on its left and right.
  • a 4 order pivot has a 3 order pivot on its left and right, and so on.

Rev:10.11.2024

Рекомендуем также
Transaction Data Analysis Assistant: This is a statistical analysis tool for transaction data, and there are many data charts for analysis and reference. language: Support language selection switch (currently supports Chinese and English active recognition without manual selection) The main window shows: Balance display Total profit and loss display Now the position profit and loss amount is displayed Now the position profit and loss ratio is displayed The total order volume, total lot size, and
FREE
Индикатор Market Steps разработан и построен на основе корреляций времени/цены Ганна и оптимизирован по правилам Price Action для рынка Forex. Он использует концепции потока рыночных ордеров для прогнозирования потенциальных ценовых зон для большого объема ордеров.  Индикатор Уровней может быть использован для самостоятельной торговли или в качестве комбинации для фильтрации неверных сигналов других стратегий/индикаторов. Каждый трейдер нуждается в таком мощном инструменте, чтобы иметь на граф
This is a simple arrow system based on Engulfing Candlestick Pattern. It gives you alerts on your smartphone when there is an engulfing candlestick pattern happens. Which type of alerts available? 1. It paints on chart Up/Down Arrows. 2. Popup message and sound alert in trading terminal window. 3. Push notification or Alert on your Android and IOS mobile phones (requires MT4 or MT5 app installed!) *Note: Use it on higher timeframes like H4 (4 hours), D1 (1 Day) then find trade opportunities on s
KT Candlestick Patterns Scanner is a Multi-Symbol and Multi-Timeframe scanner that fetches and shows various candlestick patterns on 28 currency pairs and 9 time-frames concurrently . The scanner finds the candlestick patterns by loading the KT Candlestick Patterns indicator as a resource in the background. Features The scanner can find the candlestick patterns on 252* combinations of symbols and time-frames from a single chart. Open the signal's chart loaded with a predefined template with a s
Pro Thunder V10: Нейросетевой Индикатор для MT5 | Сигналы для Бинарных Опционов и OTC-Рынков Выведите свою торговлю бинарными опционами на новый уровень с   Pro Thunder V10   — индикатором на базе искусственного интеллекта, созданным для MetaTrader 5. Благодаря передовым нейронным сетям и многолетнему опыту анализа рынка, этот нерепайнт-инструмент обеспечивает беспрецедентную точность сигналов в любых условиях: волатильность на новостях, OTC-рынки, индексы Deriv (Boom 300, Crash 500) и многое д
MTF MultiMeter5
GRANTLEY LAURENCE CAUSE
Benefits: A new and innovative way of looking across multiple timeframes and multiple indicators on any chart. Provides instant multi-timeframe analysis of any market. i.e. forex currency pairs, cryptocurrency pairs, commodities, etc. It offers precise indications across multiple timeframes of volatility as measured by RSI, ADX and STOCH within one chart. Helps you determine high probability trading setups. See example strategy in comments. Can see bullish/bearish volatility building across mult
Auto3M Pro MT5
Mr Anucha Maneeyotin
3.33 (3)
AUTO3M Pro MT5 — это полностью автоматический советник (Expert Advisor) для торговли по тренду с фильтром новостей. Стратегия торговли основана на: Машинном обучении Индикаторах EMA, SMA Стохастическом осцилляторе Основная и сигнальная линии стохастика используются для открытия отложенных ордеров на покупку или продажу. Поддерживаются все таймфреймы. Рекомендуется использовать D1. AUTO3M Pro MT5 поддерживает все валютные пары, золото и криптовалюты. Советник может работать на VPS. Версия для MT4
The "Super Trend Alert MT5" is an indicator designed for the MetaTrader 5 (MT5) trading platform. The specific details and functionality of this indicator may depend on the version or settings you are using. The Super Trend indicator is a popular technical analysis tool that helps identify the direction of the current market trend. It is displayed as a line on the price chart and is accompanied by alerts to notify traders of potential trend changes. To use the "Super Trend Alert MT5" indicator i
Ловец трендов: Стратегия Ловец трендов с индикатором оповещения - это универсальный инструмент технического анализа, который помогает трейдерам определять рыночные тренды и потенциальные точки входа и выхода. Он представляет собой динамичную стратегию Ловец трендов, адаптирующуюся к рыночным условиям для четкого визуального представления направления тренда. Трейдеры могут настраивать параметры в соответствии со своими предпочтениями и уровнем риска. Индикатор помогает в идентификации тренда, с
FREE
The Easy Trend Trading Indicator delivers quick and accurate BUY/SELL signals, ensuring that traders can make timely decisions. It works flawlessly across various timeframes and supports all symbols, making it a versatile tool for any market. Whether you're trading short-term or long-term, this indicator adapts to your needs with ease. Quick Setup: Simply "Enable" the indicator via input settings With a low memory footprint, the indicator is designed for efficiency, ensuring smooth performance e
VisualEMA TrendForce Indicator — Empower Your Trading with Precision Price: $65 Discover a Smarter Way to Trade with EMAs! The VisualEMA TrendForce Indicator is designed to elevate your trading with a reliable and visually intuitive trend-following system. Leveraging the power of Exponential Moving Averages (EMAs), this indicator provides actionable buy and sell signals based on dynamic market conditions, enabling traders to capture profitable trends with confidence. Core Features: Dynamic EMA
INTRODUCTION   Do you want to make money with trading robots Read this. Before investing in a trading robot, take a moment to understand what it entails. Trading is a game of probabilities. No one can guarantee a profit on every trade or every month. What truly matters is long-term profitability. My robots are designed with this reality in mind. They have been rigorously backtested and optimized to maximize the chances of success in real mar
Индикатор ROMAN5 Time Breakout автоматически рисует блоки прорыва дневной поддержки или сопротивления. Он помогает пользователю определиться с направлением сделки. В утилиту также встроена функция звукового уведомления при появлении нового сигнала. Дополнительно доступна функция уведомления по email. Ваш e-mail адрес, а также параметры SMTP сервера должны быть указаны в настройках терминала MetaTrader 5 (вкладка "Почта"). Синяя стрелка вверх = Покупка. Красная стрелка вниз = Продажа. Вы можете и
FREE
Обзор В быстроменяющемся мире форекса и финансовых рынков быстрое реагирование и точное принятие решений имеют решающее значение. Однако стандартный терминал MetaTrader 5 поддерживает только графики с минимальным временным интервалом в 1 минуту, что ограничивает чувствительность трейдеров к колебаниям рынка. Чтобы решить эту проблему, мы представляем Индикатор свечных графиков на уровне секунд , который позволяет вам легко просматривать и анализировать динамику рынка с интервалами от 1 до 30 сек
Manyal trading system, CovEchoTrend Robot, focuses on reliability and flexibility. By employing statistical analysis methods to study the relationships between the base indicator and market patterns, the system enables a deeper understanding of market processes. Intelligent pattern analysis: The application of statistical data processing helps identify key trend reversal points more accurately, signaling significant market shifts. Informed decision-making is based on the intersection of indicato
Одна из числовых последовательностей носит название - "Последовательность лесного пожара". Она была признана одной из самых красивых новых последовательностей. Её главная особенность заключается в том, что эта последовательность избегает линейных трендов, даже самых кратковременных. Именно это свойство легло в основу этого индикатора. При анализе финансового временного ряда этот индикатор старается отбросить все возможные варианты тренда. И только если это ему не удается, то он признает наличие
Free automatic Fibonacci is an indicator that automatically plots a Fibonacci retracement based on the number of bars you select on the BarsToScan setting in the indicator. The Fibonacci is automatically updated in real time as new highest and lowest values appears amongst the selected bars. You can select which level values to be displayed in the indicator settings. You can also select the color of the levels thus enabling the trader to be able to attach the indicator several times with differe
FREE
Binary Options Assistant (BOA) BOIL Signals Indicator provides signals based on Ana Trader Binary Options Strategy. Indicators: Stochastic Stop missing trades, stop jumping from chart to chart looking for trade set-ups and get all the signals on 1 chart! U se any of the BOA Signals Indicator with the  Binary Options Assistant (BOA) Multi Currency Dashboard .  All BOA Signal Indicator settings are adjustable to give you more strategy combinations. The signals can be seen visually and heard audi
Candle Counter is a simple indicator that list the amout of candles in the day according to the current chart timeframe. It is specially useful for those teaching others how to trade, as it can draw attention to a specific candle of the day. Configuration: Reverse mode - if on, the actual candle is the first one. Position - Above or below the candles. Vertical distance - Vertical distance from the candles in pipets/points. Size - Font size. If you need help please don't hesitate to contact me.
FREE
Эта торговая стратегия подходит только для пары USDJPY со средней годовой доходностью 20%~25% . Напоминание об условиях торговли: Выберите валютную пару USDJPY; Начальный депозит:> = 1000USD; Кредитное плечо:> 1: 100; Рекомендуется режим 1: 500; Эта стратегия представляет собой полностью автоматизированный торговый скрипт, не требующий вручную открывать и закрывать позиции; конечно, он также поддерживает ручное открытие и закрытие; Если вы стремитесь к стабильному и стабильному росту, выберите
SyncDB LT
Maxim Kuznetsov
Сервис для постоянной поддержки базы SQLite в актуальном состоянии. Быстрая работа в реальном времени.   Сохраняет открытые позиции и ордера, текущие котировки, торговую историю. Воспользуйтесь возможностями SQLite для промежуточного хранения данных, аналитики и интеграций платформы MetaTrader. Сохраняйте все данные в едином месте. Используйте сохранённые данные в аналитических запросах SQL, из Питон и других языков, для построения dash-boards и интеграции MetaTrader Эта версия " Learn & Test "
FREE
Smart FVG Indicator – Advanced Fair Value Gap Detection for MT5 Enhance Your Trading with the Smart FVG Indicator! Are you looking to identify Fair Value Gaps (FVGs) effectively and integrate them into your trading strategy? The Smart FVG Indicator for MetaTrader 5 (MT5) offers a comprehensive solution to detect and utilize FVGs, providing you with a trading edge. Key Features: Dynamic FVG Detection: Automatically scans and highlights FVGs on your charts, indicating potential institutional
FREE
Are you tired of drawing trendlines every time you're analyzing charts? Or perhaps you would like more consistency in your technical analysis. Then this is for you. This indicator will draw trend lines automatically when dropped on a chart. How it works Works similar to standard deviation channel found on mt4 and mt5. It has 2 parameters: 1. Starting Bar 2. Number of bars for calculation The   starting bar   is the bar which drawing of the trend lines will begin, while the   number of bars for c
FREE
This indicator gives you arrows, two SR lines and a golden trend line. Uses a special trend algorithm to plot the arrows, combined with support and resistance inputs. Perfect for channel trading. Features alert functions. Parameter TrendArrowPeriod. Parameter TrendLinePeriod. (Change to your preference) How to use: Simply attach to any chart with default settings. Zoom in the chart, to see the two blue SR lines and arrows more clearly. When the blue SR line is below the price, golden trend line
Range Directional Force Indicator – Designed for You to Optimize! The Range Directional Force Indicator is a cutting-edge tool designed to empower traders by visualizing market dynamics and directional strength. Built to offer insights into market trends and reversals, this indicator is an invaluable asset for traders seeking precision in their strategies. However, it is important to note that this indicator is not optimized, leaving room for you to tailor it to your unique trading preferences.
Follow The Line MT5
Oliver Gideon Amofa Appiah
4.52 (29)
This indicator obeys the popular maxim that: "THE TREND IS YOUR FRIEND" It paints a GREEN line for BUY and also paints a RED line for SELL. (you can change the colors). It gives alarms and alerts of all kinds. IT DOES NOT REPAINT and can be used for all currency pairs and timeframes. Yes, as easy and simple as that. Even a newbie can use it to make great and reliable trades. NB: For best results, get my other premium indicators for more powerful and reliable signals. Get them here: https://www.m
FREE
Binary Options Assistant (BOA) BURN Signals Indicator provides signals based on Ana Trader Binary Options Strategy. Indicators: MACD & Stochastic Stop missing trades, stop jumping from chart to chart looking for trade set-ups and get all the signals on 1 chart! U se any of the BOA Signals Indicator with the  Binary Options Assistant (BOA) Multi Currency Dashboard .  All BOA Signal Indicator settings are adjustable to give you more strategy combinations. The signals can be seen visually and hear
20 Sources, Non-Repainting, Fast Performance Introducing the All-In-One Supertrend: my first attempt at creating the ultimate trading tool. Designed with flexibility and customization in mind, each source is fully adjustable and integrates seamlessly with the others, allowing you to craft a strategy that fits your unique trading style, without compromising on speed or performance. General settings (applicable across all sources): ATR Period ATR Multiplier Change ATR Calculation [when switched
Раскройте силу торговли трендами с помощью индикатора Trend Screener: вашего идеального решения для торговли трендами, основанного на нечеткой логике и мультивалютной системе! Повысьте уровень своей торговли по тренду с помощью Trend Screener, революционного индикатора тренда, основанного на нечеткой логике. Это мощный индикатор отслеживания тренда, который сочетает в себе более 13 инструментов и функций премиум-класса и 3 торговые стратегии, что делает его универсальным выбором для превращения
Awesome Oscillator Билла Уильямса с возможностью тонкой настройки и замены алгоритмов усреднения индикатора, что значительно расширяет возможности применения этого осциллятора в алгоритмическом трейдинге и приближает его по своим свойствам к такому индикатору, как MACD. Для уменьшения ценовых шумов итоговый индикатор обработан дополнительным усреднением Smooth.  Индикатор имеет возможность подавать алерты, отправлять почтовые сообщения и push-сигналы при смене направления движения осциллятора и
С этим продуктом покупают
Golden Trend Indicator MT5
Noha Mohamed Fathy Younes Badr
4.89 (18)
Golden Trend indicator  is The best indicator for predicting trend movement this indicator never lags and never repaints and never back paints    and give  arrow buy and sell    before the candle appear  and it will help you and  will make your trading decisions clearer its work on all currencies and  gold and crypto and all time frame This unique  indicator uses very secret algorithms to catch the  trends, so you can trade using this indicator and see the trend clear on charts  manual guide and
Точки входа по закрытию бара, без перерисовки .  Сканер трендов по всем активам, режим MTF  и многое другое в одном инструменте. Рекомендуем использовать вместе с   RFI LEVELS. ИНСТРУКЦИЯ RUS   /   INSTRUCTIONS  ENG         /        VERSION MT4   Основные функции: Точные сигналы на вход БЕЗ ПЕРЕРИСОВКИ! Если сигнал появился, он остается актуальным! Это важное отличие от индикаторов с перерисовкой, которые могут предоставить сигнал, а затем изменить его, что может привести к потере средств на деп
Сейчас 147 долл. США (увеличиваясь до 499 долл. США после нескольких обновлений) - неограниченные учетные записи (ПК или Mac) Руководство пользователя + Обучающие видео + Доступ к приватному Discord-каналу + VIP-статус и мобильная версия + Лицензия на 5 ПК с неограниченным количеством аккаунтов и терминалов MT4. Сколько раз вы покупали индикатор торговли с замечательными обратными тестами, доказательствами производительности на живых счетах и зашикарными цифрами и статистикой, но после исполь
MonetTrend — Премиум-индикатор для торговли по тренду (M30, H1, H4) MonetTrend — это мощный и визуально понятный трендовый индикатор, созданный для торговли на таймфреймах M30, H1 и H4. Он идеально подходит для работы с волатильными инструментами, такими как: • Золото (XAUUSD) • Криптовалюты (BTCUSD) • Валютные пары (EURUSD, USDJPY и др.) Ключевые особенности MonetTrend: • Автоматическое отображение Take Profit 1 (TP1) и Stop Loss (SL): После появления сигнала индикатор сразу показывает: • TP
Разворотные зоны / Пиковые объемы / Активные зоны крупного игрока =  ТС TPSPROSYSTEM ИНСТРУКЦИЯ RUS  /  INSTRUCTIONS  ENG        /       Version MT4    Каждый покупатель этого индикатора получает дополнительно БЕСПЛАТНО:  3 месяцев доступа к торговым сигналам от сервиса RFI SIGNALS — готовые точки входа по алгоритму TPSproSYSTEM. Обучающие материалы с регулярными обновлениями — погружение в стратегию и рост профессионального уровня. Круглосуточная поддержка в будние дни (24/5) и доступ в закрыт
Quantum TrendPulse
Bogdan Ion Puscasu
5 (13)
Представляем   Quantum TrendPulse   , совершенный торговый инструмент, который объединяет мощь   SuperTrend   ,   RSI   и   Stochastic   в один комплексный индикатор, чтобы максимизировать ваш торговый потенциал. Разработанный для трейдеров, которые ищут точность и эффективность, этот индикатор помогает вам уверенно определять рыночные тренды, сдвиги импульса и оптимальные точки входа и выхода. Основные характеристики: Интеграция SuperTrend:   легко следуйте преобладающим рыночным тенденциям и п
MetaBands M5
Vahidreza Heidar Gholami
4.5 (2)
MetaBands использует мощные и уникальные алгоритмы для построения каналов и обнаружения тенденций, чтобы предоставлять трейдерам потенциальные точки для входа и выхода из сделок. Это индикатор канала плюс мощный индикатор тенденций. Он включает различные типы каналов, которые могут быть объединены для создания новых каналов, просто используя параметры ввода. MetaBands использует все типы оповещений, чтобы уведомлять пользователей о событиях на рынке. Особенности Поддерживает большинство алгоритм
MONEYTRON – ТВОЙ ЛИЧНЫЙ СИГНАЛ НА УСПЕХ! XAUUSD | AUDUSD | USDJPY | BTCUSD Поддержка таймфреймов: M5, M15, M30, H1 Почему трейдеры выбирают Moneytron? 82% успешных сделок — это не просто цифры, это результат продуманной логики, точного алгоритма и настоящей силы анализа. Автоматические сигналы на вход — не нужно гадать: когда покупать, когда продавать. 3 уровня Take Profit — ты сам выбираешь свой уровень прибыли: безопасный, уверенный или максимум. Четкий Stop Loss — контролируешь риск
CBT Quantum Maverick Высокоэффективная система торговли бинарными опционами CBT Quantum Maverick – это точно настроенная, высокопроизводительная система торговли бинарными опционами, созданная для трейдеров, стремящихся к точности, простоте и дисциплинированному подходу. Настройка не требуется – система оптимизирована для эффективных результатов прямо "из коробки". Просто следуйте сигналам, которые можно освоить с небольшой практикой. Основные характеристики: Точность сигналов: Сигналы для тор
Индикатор Trend Forecaster использует уникальный авторский алгоритм для определения точек входа в сделку по пробойной стратегии. Индикатор определяет ценовые скопления и анализирует движение цены возле уровней и показывает сигнал, когда цена пробивает уровень. Индикатор Trend Forecaster подходит для любых финансовых активов: валюты (Форекс), металлы, акции, индексы, криптовалюты. Также индикатор можно настроить для работы на любых тайм-фреймах, однако в качестве рабочего тайм-фрейма все же реком
Индикатор Supply Demand использует предыдущее ценовое действие для выявления потенциального дисбаланса между покупателями и продавцами. Ключевым является определение зон с лучшими возможностями, а не просто вероятностей. Индикатор Blahtech Supply Demand обеспечивает функционал, не доступный ни в одной платформе. Этот индикатор 4 в 1 не только выделяет зоны с более высокой вероятностью на основе механизма оценки силы по множественным критериям, но также комбинирует его с мульти-таймфреймовым ана
Индикатор Elliott Wave Trend был разработан для научного подсчета волн на основе шаблонов и паттернов, впервые разработанных Чжон Хо Сео. Индикатор нацелен на максимальное устранение нечеткости классического подсчета волн Эллиотта с использованием шаблонов и паттернов. Таким образом индикатор Elliott Wave Trend в первую очередь предоставляет шаблон для подсчета волн. Во-вторых, он предлагает структурный подсчет волн Wave Structural Score, которые помогает определить точное формирование волны. Он
Следующее поколение автоматизированных зон спроса и предложения. Новый инновационный алгоритм, работающий на любом графике. Все зоны создаются динамически в соответствии с ценовым действием рынка. ДВА ТИПА СИГНАЛОВ --> 1) ПРИ ПОПАДАНИИ ЦЕНЫ В ЗОНУ 2) ПРИ ФОРМИРОВАНИИ НОВОЙ ЗОНЫ Вы не получите еще один бесполезный индикатор. Вы получаете полную торговую стратегию с проверенными результатами.     Новые особенности:     Оповещения, когда цена достигает зоны спроса/предложения     Оповещения
Royal Scalping Indicator is an advanced price adaptive indicator designed to generate high-quality trading signals. Built-in multi-timeframe and multi-currency capabilities make it even more powerful to have configurations based on different symbols and timeframes. This indicator is perfect for scalp trades as well as swing trades. Royal Scalping is not just an indicator, but a trading strategy itself. Features Price Adaptive Trend Detector Algorithm Multi-Timeframe and Multi-Currency Trend Low
Топовый индикатор МТ5, дающий сигналы для входа в сделки без перерисовки! Идеальные точки входа в сделки для  валют, крипты, металлов, акций, индексов !  Смотрите  видео  (6:22) с примером отработки всего одного сигнала, окупившего индикатор. Версия индикатора для MT4 Преимущества индикатора Сигналы на вход без перерисовки Если сигнал появился, он никуда НЕ исчезает! В отличие от индикаторов с перерисовкой, которые ведут к потере депозита, потому что могут показать сигнал, а потом убрать его. Б
Лучшее решение для новичка или трейдера-эксперта! Этот индикатор является уникальным, высококачественным и доступным торговым инструментом, поскольку мы включили в него ряд собственных функций и секретную формулу. Всего на ОДНОМ графике он выдает алерты по всем 28 валютным парам. Представьте, как улучшится ваша торговля, ведь вы сможете точно определить точку запуска нового тренда или возможность скальпирования! Построенный на новых базовых алгоритмах, он позволяет еще проще определять и подт
IQ Gold Gann Levels a non-repainting, precision tool designed exclusively for XAUUSD/Gold intraday trading. It uses W.D. Gann’s square root method to plot real-time support and resistance levels, helping traders spot high-probability entries with confidence and clarity. William Delbert Gann (W.D. Gann) was an exceptional market analyst, whose trading technique was based on a complex blend of mathematics, geometry, astrology, and ancient mathematics which proved to be extremely accurate. Download
Сложно найти и дефицит по частоте, дивергенции являются одним из самых надежных торговых сценариев. Этот индикатор автоматически находит и сканирует регулярные и скрытые расхождения, используя ваш любимый осциллятор. [ Руководство по установке | Руководство по обновлению | Устранение неполадок | FAQ | Все продукты ] Легко торговать Находит регулярные и скрытые расхождения Поддерживает много известных генераторов Реализует торговые сигналы на основе прорывов Отображает подходящие уровни стоп-
MetaForecast M5
Vahidreza Heidar Gholami
5 (3)
MetaForecast предсказывает и визуализирует будущее любого рынка на основе гармонии в данных о ценах. Хотя рынок не всегда предсказуем, если существует узнаваемый паттерн в ценах, то MetaForecast способен предсказать будущее с наибольшей точностью. По сравнению с другими аналогичными продуктами, MetaForecast способен генерировать более точные результаты, анализируя тренды на рынке. Входные параметры Past size (Размер прошлых данных) Указывает количество баров, которые MetaForecast использует для
WHY IS OUR FXACCCURATE LS MT5 THE PROFITABLE ? PROTECT YOUR CAPITAL WITH RISK MANAGEMENT Gives entry, stop and target levels from time to time. It finds Trading opportunities by analyzing what the price is doing during established trends. POWERFUL INDICATOR FOR A RELIABLE STRATEGIES We have made these indicators with a lot of years of hard work. It is made at a very advanced level. Established trends provide dozens of trading opportunities, but most trend indicators completely ignore them! The
Это, пожалуй, самый полный индикатор автоматического распознавания гармонического ценообразования, который вы можете найти для платформы MetaTrader. Он обнаруживает 19 различных паттернов, воспринимает проекции Фибоначчи так же серьезно, как и вы, отображает зону потенциального разворота (PRZ) и находит подходящие уровни стоп-лосс и тейк-профит. [ Руководство по установке | Руководство по обновлению | Устранение неполадок | FAQ | Все продукты ] Он обнаруживает 19 различных гармонических ценов
Лучшее решение для новичка или трейдера-эксперта! Этот индикатор является уникальным, высококачественным и доступным торговым инструментом, поскольку мы включили в него ряд собственных функций и новую формулу. С помощью всего лишь ОДНОГО графика вы можете определить силу валюты для 28 пар Форекс! Представьте, как улучшится ваша торговля, потому что вы сможете точно определить точку запуска нового тренда или возможность скальпирования? Руководство пользователя:   нажмите здесь Это первый, ори
Прецизионный индикатор осциллятора (Pi-Osc) от Роджера Медкалфа из Precision Trading Systems Версия 2 была тщательно перекодирована для быстрой загрузки на вашем графике, а также внесены некоторые другие технические улучшения для улучшения опыта. Pi-Osc был создан для предоставления точных сигналов времени для совершения сделок, предназначенных для поиска экстремальных точек истощения - точек, к которым рынок вынужден идти, чтобы сработать стоп-заказы всех остальных. Этот продукт решает вековую
Уникальный индикатор, реализующий профессиональный и количественный подход к торговле на возврате к среднему. Он использует тот факт, что цена отклоняется и возвращается к среднему предсказуемым и измеримым образом, что позволяет использовать четкие правила входа и выхода, которые значительно превосходят неколичественные торговые стратегии. [ Installation Guide | Update Guide | Troubleshooting | FAQ | All Products ] Четкие торговые сигналы Удивительно легко торговать Настраиваемые цвета и разме
Индикатор   Time_Price_SQ9_Degree   основан на квадрате 9 Ганна. Используя данный индикатор вы можете выявлять сильные временные и ценовые зоны. Индикатор отображает уровни в виде градусной величины. Градусы можно прописать в настройках. После запуска появляется кнопка МЕНЮ. Если она выделена, то ее можно передвигать в любую точку графика, а после кликнув по ней двойным щелчком мыши , она перестает быть выделенной и появляются кнопки меню. Чтоб спрятать меню просто кликните по кнопке двойным щел
Представляем       Quantum Breakout PRO   , новаторский индикатор MQL5, который меняет ваш способ торговли в зонах прорыва! Разработан командой опытных трейдеров со стажем торговли более 13 лет,       Квантовый прорыв PRO       разработан, чтобы поднять ваше торговое путешествие к новым высотам с его инновационной и динамичной стратегией зоны прорыва. Quantum Breakout Indicator покажет вам сигнальные стрелки на зонах прорыва с 5 целевыми зонами прибыли и предложением стоп-лосса на основе поля
ОПИСАНИЕ ICSM (Impulse-Correction SCOB Mapper) - это индикатор, который анализирует движение цены и определяет действительные импульсы, коррекции и SCOB (ордер блок на одну свечу). Это мощный инструмент, который можно использовать с любым типом технического анализа, так как он гибкий, информативный, прост в использовании и существенно улучшает понимание трейдером наиболее ликвидных зон интереса. НАСТРОЙКИ Общие | Визуальные Цветовая тема - определяет цветовую тему ICSM. SCOB | Визуальные
Ищете мощный индикатор для торговли на рынке Форекс, который поможет вам с легкостью определить прибыльные торговые возможности? Не ищите ничего, кроме Beast Super Signal. Этот простой в использовании индикатор, основанный на тренде, постоянно отслеживает рыночные условия, ищет новые развивающиеся тренды или отслеживает уже существующие. Beast Super Signal дает сигнал на покупку или продажу, когда все внутренние стратегии совпадают и на 100% совпадают друг с другом, что устраняет необходимость
Volume Profile, Footprint and Market Profile TPO (Time Price Opportunity). Volume and TPO histogram bar and line charts. Volume Footprint charts. TPO letter and block marker collapsed and split structure charts. Static, dynamic and flexible range segmentation and compositing methods with relative and absolute visualizations. Session hours filtering and segment concatenation with Market Watch and custom user specifications. Graphical layering, positioning and styling options to suit the user's a
TPA True Price Action indicator reveals the true price action of the market makers through 100% non-repainting signals strictly at the close of a candle! TPA shows entries and re-entries, every time the bulls are definitely stronger than the bears and vice versa. Not to confuse with red/green candles. The shift of power gets confirmed at the earliest stage and is ONE exit strategy of several. There are available now two free parts of the TPA User Guide for our customers. The first "The Basics"
Другие продукты этого автора
EAsiTrader: Advanced Strategy Creation & Automation for MetaTrader 5 EAsiTrader is designed for those who want to eliminate the hassle of programming and drastically accelerate the process of creating Expert Advisors, making strategy development faster and more efficient. EAsiTrader is a versatile trading tool designed specifically for MetaTrader 5, providing automation features and a comprehensive set of tools to help users build, test, and refine and run trading strategies. EAsiTrader adapts
FREE
AutoFib: Advanced Fibonacci Retracement for MetaTrader 5 Automate Fibonacci Analysis for Smarter Trading Decisions AutoFib simplifies Fibonacci retracement analysis by automatically identifying key levels of support and resistance directly on your MT5 charts. Whether you're new to Fibonacci analysis or an advanced trader, AutoFib enhances your ability to identify potential reversals, continuations, and critical price levels. Key Features: Automatic Fibonacci Levels – Identify retracement and ext
Japanese Candle Patterns (JCP) User Guide Overview and Features Japanese candlestick patterns, a foundational element of technical analysis, provide traders with visual insights into market psychology. Each pattern represents the battle between bulls and bears, encapsulating critical information about market sentiment, potential reversals, and continuation signals. Developed centuries ago and later popularized by Steve Nison in Japanese Candlestick Charting Techniques , these patterns are now wi
EAsiTrader: Advanced Strategy Creation & Automation for MetaTrader 5 EAsiTrader is designed for those who want to eliminate the hassle of programming and drastically accelerate the process of creating Expert Advisors, making strategy development faster and more efficient. EAsiTrader is a versatile trading tool designed specifically for MetaTrader 5, providing automation features and a comprehensive set of tools to help users build, test, and refine and run trading strategies. EAsiTrader adapts
Pivot Lines (PL) User Guide Overview and Features The Pivot Lines Indicator (PL) provides traders with a powerful tool for identifying potential support and resistance levels based on well-established pivot point calculation methods. By offering insights into possible price turning points, this indicator helps traders make more informed trading decisions and refine their entry and exit strategies. With customizable settings for different timeframes and calculation methods, PL is versatile and a
ABH - Candle Component Analysis - User Guide Overview and Features The   ABH - Average Bar Height   indicator is designed to help traders analyze market volatility and identify potential buy and sell signals by measuring the average size of each candlestick component over a specific period. The indicator calculates and displays four lines representing different candlestick metrics. By analyzing these values, traders can interpret market strength, volatility, and potential trend changes. Beyond
NTL Market Times Indicator The NTL Market Times Indicator for MT5 provides a clear unobtrusive display of the opening and closing times of the world’s major Forex trading centers. It automatically adjusts for UK daylight saving time, ensuring reliable market session information all year round. Main Features Major Markets: Displays New York, London, Frankfurt, Sydney, and Tokyo trading hours. Color-Coded Sessions: Each market session is uniquely color-coded for quick identification on the chart.
Фильтр:
Нет отзывов
Ответ на отзыв