• Visão global
  • Comentários
  • Discussão

NTL HLines

HLines User Guide

Overview and Features

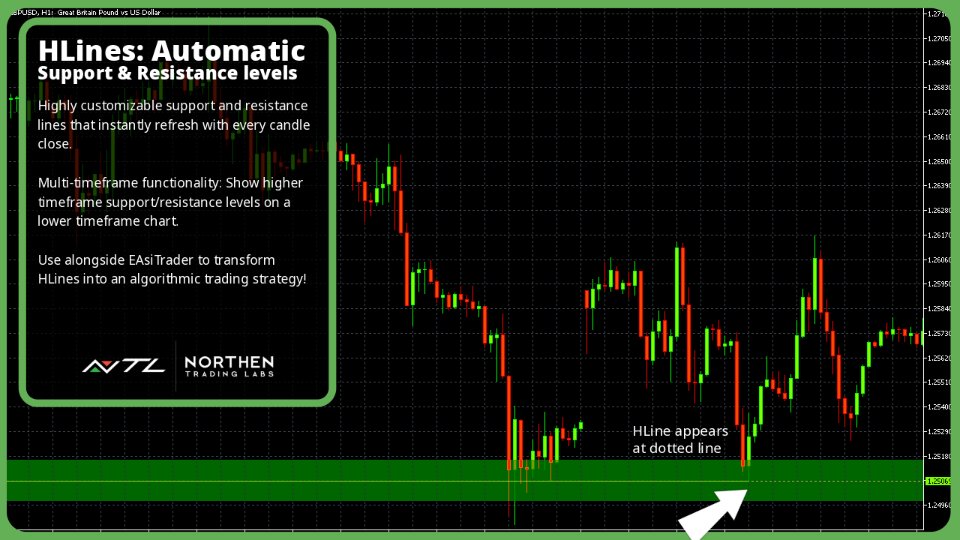
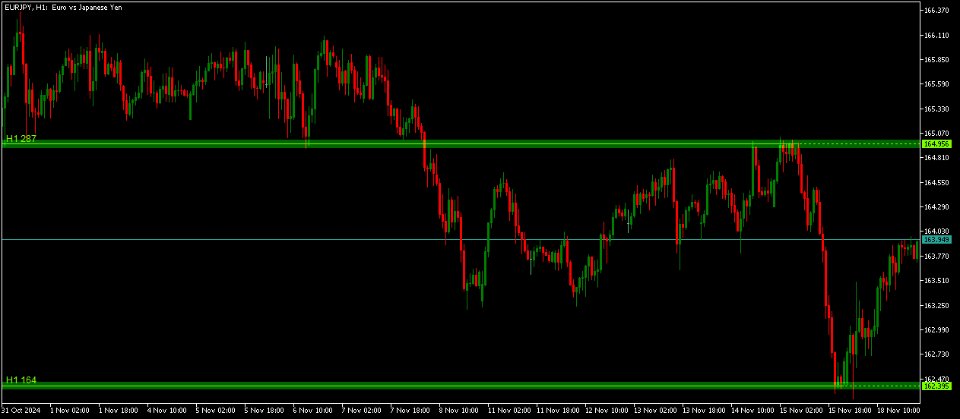
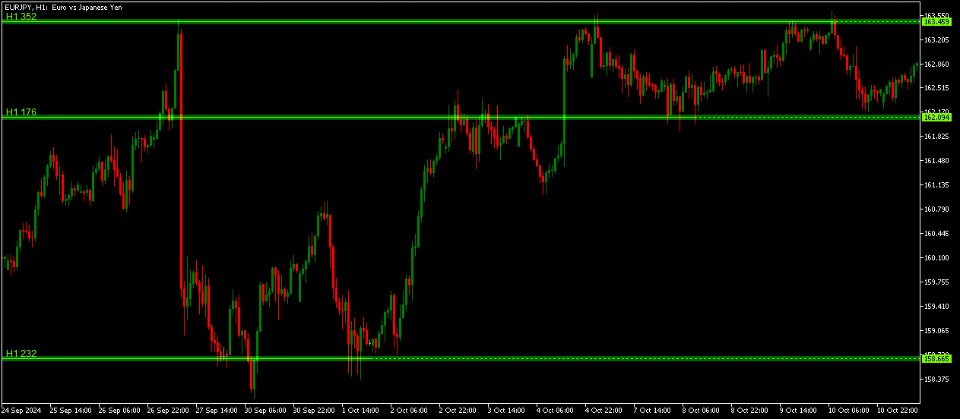
The NTL HLines Indicator is designed to elevate your trading with precise support and resistance analysis. Utilizing a sophisticated algorithm, this MQL5 indicator scans for high-probability price levels across multiple timeframes, helping traders pinpoint strategic entry and exit zones. With fully customizable pivot scanning and multi-timeframe support, HLines provides a powerful, adaptable toolset for traders of all experience levels.

Key features include customizable Pivot String and Pivot Order settings, allowing traders to define unique patterns of support and resistance pivots. HLines automatically adjusts these levels in real time, reducing subjectivity and maintaining clarity in fast-moving markets. This indicator is compatible with the EAsiTrader EA, offering seamless integration for automated trading strategies. Whether you’re focused on short-term trading or longer-term trend analysis, HLines helps you make data-driven decisions with greater confidence.

Key Features

  • Custom Pivot Scanning
    This feature allows traders to search key pivot points within price action for specific sequences of support and resistance pivots, such as a strong support level followed by a key resistance level, or any custom-defined combination that aligns with their strategy enabling traders to spot optimal entry and exit points with greater confidence.

  • Automatic Line Adjustments
    Continuously updates support and resistance lines to reflect the latest market data, allowing traders to maintain a clear view of critical price zones in real time and stay focused on strategic decision-making.

  • Customizable Settings for Line Sensitivity
    Allows traders to adjust the sensitivity of line generation to suit their unique trading strategy, from short-term scalping to long-term positioning.

  • Multi-Timeframe Scanning: Whether trading on the 1-minute chart or the monthly chart, HLines adapts seamlessly, allowing users to examine support and resistance lines across multiple timeframes, from intra-day to long-term perspectives. Note: To use this feature effectively, fully load tick data for your desired timeframe.

  • Reduces Subjectivity: Manual identification of patterns can be subjective, while HLines applies consistent criteria.

  • Compatible with EAsiTrader EA: Provides signals to NTL EAsiTrader EA for automated trading.

Installation and Settings

This section provides the installation steps for setting up the HLines indicator on the MQL5 platform, as well as detailed explanations of customizable settings to configure it for optimal performance.

Installation

  1. Install the Indicator:

    • Download the HLines indicator file (HLines.ex5) and place it in the  Indicators\NTL  folder in your MQL5 platform directory. If this folder does not exist, create it manually.
    • Typical path:  Terminal -> MQL5 -> Indicators -> NTL . Restart the platform to make the indicator appear in the Navigator panel.
  2. Apply to a Chart:

    • Open your desired chart, select the symbol and timeframe.
    • Drag the HLines indicator from the Navigator panel onto your chart.
    • Configure the Input settings to customize HLines, display options, and other parameters.
  3. Customize Settings:

    • Access the Input settings by double-clicking the indicator on the chart or through the Navigator panel.
  4. Save as Template:

    • Save your preferred settings as a template by right-clicking on the chart and selecting  Template -> Save Template . Give it a descriptive name like  HLines_Custom  for easy access.

Settings

Timeframe

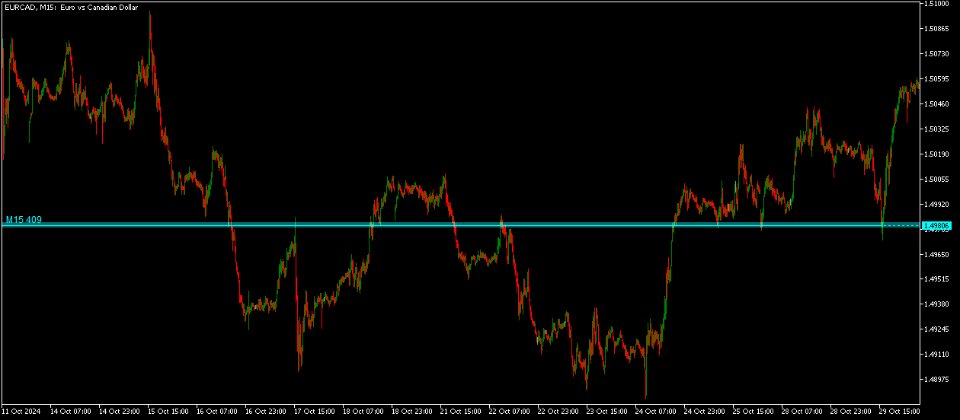
This setting allows you to select the specific timeframe from which HLines will analyze price data, regardless of the chart’s current timeframe. This feature is helpful if you want to analyze support and resistance lines on a higher or lower timeframe than the one currently displayed, giving you a multi-timeframe perspective.

Min Line Strength

Line strength is a measure of the support or resistance line’s importance relative to other lines. Use this setting to specify the minimum strength value of a line that can be shown on the chart. Use values between 20 and 1000.

Pivot String

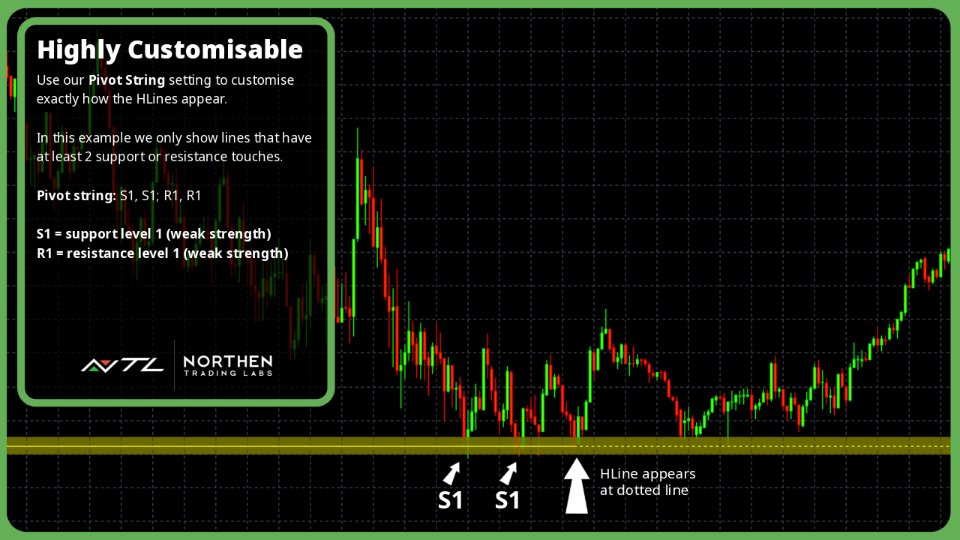
Use this setting to filter line patterns according to their pivot order values. The default value is “S2;R2” meaning HLines will find all support lines with a pivot order value of 2 or more and resistance lines with a pivot order value of 2 or more. Here are more examples:
"S3": matches support lines that have a 3 or greater pivot order value.
"R3": matches resistance lines that have a 3 or greater pivot order value.
"S2;S3": matches support lines that have a 2 or greater pivot order value, or resistance lines that have a 3 or greater pivot order value.
"S3,R3": matches support lines that have a 3 or greater pivot order value followed by a resistance line that has a 3 or greater pivot order. For example, a down trend that finds support, breaks and then find resistance.
"R3,S3": matches resistance lines that have a 3 or greater pivot order value followed by a support line that has a 3 or greater pivot order. For example, an up trend that finds resistance, breaks and then find support.
"S3,R3;R3,S3": matches support lines that have a 3 or greater pivot order value followed by a resistance line that has a 3 or greater pivot order. Or, matches resistance lines that have a 3 or greater pivot order value followed by a support line that has a 3 or greater pivot order.

Max Body Crosses

Defines the maximum number of candle bodies that the support or resistance line can cross before being excluded as a support or resistance line.

Pivot Weight

Defines the tolerance around a candle’s high and low and candle’s body high and body low when calculating line strength and body cross. The smaller this value the less tolerance, meaning support and resistance lines are more precise. More precision usually results in fewer lines.

Overlap Tolerance

Defines the tolerance, in average body height, between adjacent lines of support or resistance. It is used to decide if two adjacent lines should be considered the same line or separate lines. A smaller tolerance will produce more lines whilst a larger tolerance will produce less lines.

ABH Period

Defines the period for the ABH (Average Bar Height) Indicator. HLines uses the ABH Indicator in its calculations to set the value of an average bar height and average body height.

ABH Zone Multiplier

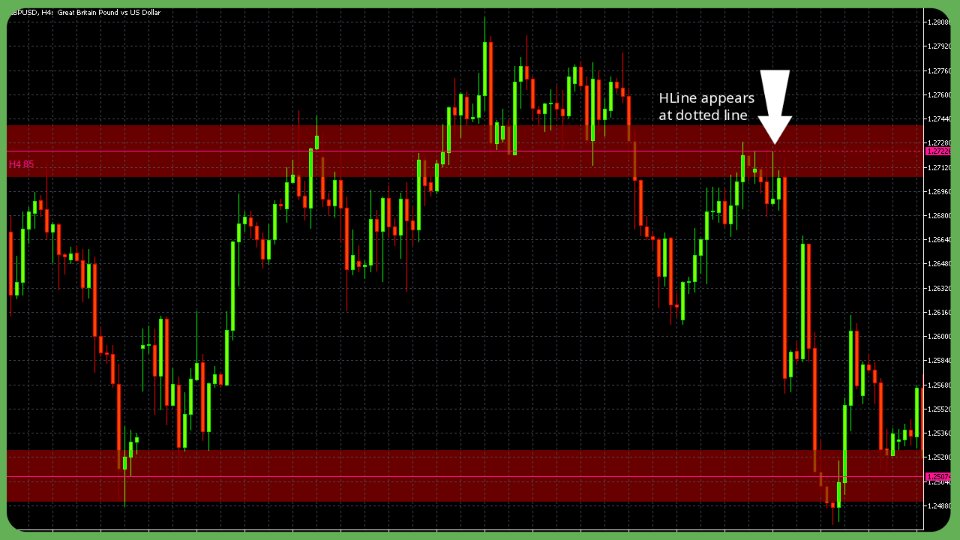
Defines the size of an HLine draw zone above and below the support or resistance lines as a ratio of the average bar height at the time the line is created. A multiplier value of 1.0 draws a zone of half ABH ** 1.0 above and below the line. A multiplier value of 1.5 draws a zone of half ABH * 1.5 above and below the line.

ABH Show Zones

If true, the indicator will draw the zone above and below the lines. If false, no zones are drawn. The zone is an area drawn on the chart above and below each line, whose size is a ratio of the average bar height at the time the line is created. These edges of the zones can be used by traders to set entry, stop loss or take profit prices.

New HLine Alerts

If true, the trader will be alerted with a message in a separate window whenever a new support or resistance line is created. The message includes the symbol, timeframe, local time of the alert and the symbol’s price the line was created. Optionally, a push notification can also be sent to a mobile device.  Tools -> Options -> Notifications

Font Size

Defines the size of font to be used to display the timeframe and strength values on the HLine.

Chart Label Style

Determines the style used to display the timeframe and strength values on the HLine. Use Label to show this information as a simple label, or use Boxed to show the information inside a rectangle box.

Chart Edge Alignment

Allows the trader to align the HLine text content to the left or right edge of the chart.

Advanced Usage and Strategy Integration

Static HLines

To fix an HLine so that it doesn’t get removed when new candles are added, simply click on the HLine - the word Static will appear above the line. Click again to return the HLine to normal.

Leverage HLines to refine complex trading strategies by integrating advanced pivot and support/resistance analysis:

  1. Custom Pivot Sequence for Targeted Signal Generation
    With the Pivot String and Pivot Order settings, traders can construct personalized sequences of support and resistance pivots, enabling focused searches for specific patterns that align with their strategy. For example, combining a high-order support pivot (e.g. S3) followed by a resistance pivot (e.g. R3) can highlight zones of strong trend reversals, providing actionable signals that fit into trend-based or mean-reversion strategies.

  2. Multi-Timeframe Analysis for Strategic Depth
    By configuring HLines to scan higher timeframes, traders can identify significant support and resistance levels from daily or weekly charts while trading on shorter timeframes. This setup allows for more comprehensive analysis, helping to validate signals against broader market trends or longer-term levels.

  3. Dynamic Zone Creation for Entry and Exit Management
    The ABH Zone Multiplier helps define adaptive zones around each line, offering flexible areas where traders can place entry, stop loss, or take profit levels. These zones, based on average bar height, provide a buffer that accommodates minor fluctuations, especially useful in volatile markets.

  4. Automated Alerts for Real-Time Strategy Execution
    HLines can be configured to alert traders when new support or resistance levels are detected. This feature is especially beneficial for strategies that require quick reactions to emerging levels, enabling prompt entries or exits based on the latest market data.

  5. Seamless Integration with EAsiTrader for Automated Trading
    Compatible with NTL’s EAsiTrader EA, the indicator provides automated trading capabilities by sending signals directly to the EA. This feature allows traders to combine manual analysis with automated trade execution, aligning with sophisticated strategies that depend on precision timing.

Insights

Gain deeper insights into market structure and dynamics with HLines’ analytical features:

  1. Pivot Order Depth and Market Significance
    High-order pivots reflect more stable, recurring price levels, suggesting strong support or resistance zones. By focusing on high-order pivots, traders can identify areas with increased probability of price reversal, helping them anticipate potential breakout or reversal points with greater accuracy.

  2. The Role of Sequence in Support and Resistance Strength
    The customizable Pivot String enables traders to spot pivotal sequences, such as a resistance pivot followed by a support pivot, which may indicate a potential shift in market direction. Recognizing these sequences enhances a trader’s ability to interpret market sentiment, allowing for strategic alignment with prevailing trends.

  3. Min Line Strength and Volatility Sensitivity
    The Min Line Strength setting aids in filtering noise by ensuring only significant lines appear on the chart, reducing clutter and focusing attention on levels that are more likely to hold. This sensitivity adjustment is particularly useful in high-volatility periods, where less reliable levels are automatically excluded.

  4. Adaptive Tolerance for Precision Analysis
    The Overlap Tolerance and Pivot Weight settings allow traders to fine-tune the precision of the support and resistance lines, accommodating their specific needs for broader or narrower levels. This flexibility provides an edge in adapting the indicator’s analysis to both trending and ranging market conditions.

Terms

Pivot Order

Ordering pivots ranks price highs and lows based on their significance. The higher the order, the more significant the price compared to lower-ordered pivots.

  • a 0 order high pivot is a bar without a lower high bar on its immediate left (older) and right (newer).
  • a 0 order low pivot is a bar without a higher low bar on its immediate left (older) and right (newer).
  • a 1 order high pivot is a bar with a lower high bar on its immediate left and right.
  • a 1 order low pivot is a bar with a higher low bar on its immediate left and right.
  • a 2 order high pivot is a bar with a 1 order high pivot on its left and right.
  • a 2 order low pivot is a bar with a 1 order low pivot on its left and right.
  • a 3 order pivot has a 2 order pivot on its left and right.
  • a 4 order pivot has a 3 order pivot on its left and right, and so on.

Rev:10.11.2024

Produtos recomendados
Transaction Data Analysis Assistant: This is a statistical analysis tool for transaction data, and there are many data charts for analysis and reference. language: Support language selection switch (currently supports Chinese and English active recognition without manual selection) The main window shows: Balance display Total profit and loss display Now the position profit and loss amount is displayed Now the position profit and loss ratio is displayed The total order volume, total lot size, and
FREE
Market Steps MT5
Mahdi Ebrahimzadeh
O Indicador Market Steps foi projetado e construído baseado nas correlações de Preço/Tempo de Gann, e otimizado por regras específicas de Price Action do Mercado Forex. Ele usa o conceito de fluxo de ordens de mercado para prever as zonas de preços potenciais que terão um alto volume de ordens. Os níveis apresentados pelo Indicador podem ser usados para negociação, e/ou também para filtro de sinais de outras estratégias ou indicadores. Todo Trader precisa desta poderosa ferramenta para ter ao
The Easy Trend Trading Indicator delivers quick and accurate BUY/SELL signals, ensuring that traders can make timely decisions. It works flawlessly across various timeframes and supports all symbols, making it a versatile tool for any market. Whether you're trading short-term or long-term, this indicator adapts to your needs with ease. Quick Setup: Simply "Enable" the indicator via input settings With a low memory footprint, the indicator is designed for efficiency, ensuring smooth performance e
KT Candlestick Patterns Scanner is a Multi-Symbol and Multi-Timeframe scanner that fetches and shows various candlestick patterns on 28 currency pairs and 9 time-frames concurrently . The scanner finds the candlestick patterns by loading the KT Candlestick Patterns indicator as a resource in the background. Features The scanner can find the candlestick patterns on 252* combinations of symbols and time-frames from a single chart. Open the signal's chart loaded with a predefined template with
MTF MultiMeter5
GRANTLEY LAURENCE CAUSE
Benefits: A new and innovative way of looking across multiple timeframes and multiple indicators on any chart. Provides instant multi-timeframe analysis of any market. i.e. forex currency pairs, cryptocurrency pairs, commodities, etc. It offers precise indications across multiple timeframes of volatility as measured by RSI, ADX and STOCH within one chart. Helps you determine high probability trading setups. See example strategy in comments. Can see bullish/bearish volatility building across mult
The "Super Trend Alert MT5" is an indicator designed for the MetaTrader 5 (MT5) trading platform. The specific details and functionality of this indicator may depend on the version or settings you are using. The Super Trend indicator is a popular technical analysis tool that helps identify the direction of the current market trend. It is displayed as a line on the price chart and is accompanied by alerts to notify traders of potential trend changes. To use the "Super Trend Alert MT5" indicator i
O Captador de Tendências: A Estratégia do Captador de Tendências com Indicador de Alerta é uma ferramenta versátil de análise técnica que auxilia os traders na identificação de tendências de mercado e potenciais pontos de entrada e saída. Apresenta uma Estratégia dinâmica do Captador de Tendências, adaptando-se às condições do mercado para uma representação visual clara da direção da tendência. Os traders podem personalizar os parâmetros de acordo com suas preferências e tolerância ao risco.
FREE
This is a simple arrow system based on Engulfing Candlestick Pattern. It gives you alerts on your smartphone when there is an engulfing candlestick pattern happens. Which type of alerts available? 1. It paints on chart Up/Down Arrows. 2. Popup message and sound alert in trading terminal window. 3. Push notification or Alert on your Android and IOS mobile phones (requires MT4 or MT5 app installed!) *Note: Use it on higher timeframes like H4 (4 hours), D1 (1 Day) then find trade opportunities on s
O indicador ROMAN5 Time Breakout desenha automaticamente caixas de suporte e resistência diárias para rompimentos. Ajuda o usuário a identificar o momento de comprar ou vender. Vem com um alerta sonoro sempre que um novo sinal aparece. Ele também possui a facilidade de enviar e-mail. O seu endereço de e-mail e configurações do servidor SMTP devem ser especificados na janela de configurações do guia "Email" no seu MetaTrader 5. Seta para cima azul = Comprar Seta para baixo vermelha = Vender. Você
FREE
CChart
Rong Bin Su
Overview In the fast-paced world of forex and financial markets, quick reactions and precise decision-making are crucial. However, the standard MetaTrader 5 terminal only supports a minimum of 1-minute charts, limiting traders' sensitivity to market fluctuations. To address this issue, we introduce the Second-Level Chart Candlestick Indicator , allowing you to effortlessly view and analyze market dynamics from 1 second to 30 seconds on a sub-chart. Key Features Support for Multiple Second-Level
Uma das sequências numéricas é chamada de "Forest Fire Sequence". Foi reconhecida como uma das mais belas novas sequências. Sua principal característica é que essa sequência evita tendências lineares, mesmo as mais curtas. É esta propriedade que formou a base deste indicador. Ao analisar uma série temporal financeira, este indicador tenta rejeitar todas as opções de tendência possíveis. E somente se ele falhar, ele reconhece a presença de uma tendência e dá o sinal apropriado. Esta abordagem pe
TPSproTREND PrO MT5
Roman Podpora
4.54 (13)
TPSpro TREND PRO  - is a trend indicator that automatically analyzes the market and provides information about the trend and each of its changes, as well as giving signals for entering trades without redrawing! The indicator uses each candle, analyzing them separately. referring to different impulses - up or down impulse. Exact entry points into transactions for currencies, crypto, metals, stocks, indices!  INSTRUCTIONS     RUS   -    ENG              R ecommended to use with an indicator   - 
Free automatic Fibonacci is an indicator that automatically plots a Fibonacci retracement based on the number of bars you select on the BarsToScan setting in the indicator. The Fibonacci is automatically updated in real time as new highest and lowest values appears amongst the selected bars. You can select which level values to be displayed in the indicator settings. You can also select the color of the levels thus enabling the trader to be able to attach the indicator several times with differe
FREE
Binary Options Assistant (BOA) BOIL Signals Indicator provides signals based on Ana Trader Binary Options Strategy. Indicators: Stochastic Stop missing trades, stop jumping from chart to chart looking for trade set-ups and get all the signals on 1 chart! U se any of the BOA Signals Indicator with the  Binary Options Assistant (BOA) Multi Currency Dashboard .  All BOA Signal Indicator settings are adjustable to give you more strategy combinations. The signals can be seen visually and heard au
Visual EMA Trend Force Indicator
AL MOOSAWI ABDULLAH JAFFER BAQER
VisualEMA TrendForce Indicator — Empower Your Trading with Precision Price: $65 Discover a Smarter Way to Trade with EMAs! The VisualEMA TrendForce Indicator is designed to elevate your trading with a reliable and visually intuitive trend-following system. Leveraging the power of Exponential Moving Averages (EMAs) , this indicator provides actionable buy and sell signals based on dynamic market conditions, enabling traders to capture profitable trends with confidence. Core Features:
LT Candle Counter
Thiago Duarte
5 (3)
Candle Counter é um simples indicador que enumera a quantidade de velas do dia de acordo com o tempo gráfico atual. Ele é útil principalmente para quem ensina outros a operar, pois pode chamar a atenção para a vela X do dia. Configuração: Reverse mode - se ativado a primeira vela é a atual. Position - Acima ou abaixo das velas. Vertical distance - Distância vertical das velas. Size - Tamanho da fonte. Se precisar de ajuda não hesite em me contatar. Faça bom uso! Este é um indicador gratuito
FREE
Esta estratégia de negociação é adequada para USDJPY apenas, com uma taxa média de retorno anualizada 20%~25% Lembrete das condições de negociação: Selecione o par de moedas USDJPY; Depósito inicial:> = 1000USD; Alavancagem:> 1: 100; O modo 1: 500 é recomendado; Esta estratégia é um script de negociação totalmente automatizado, sem necessidade de abrir e fechar posições manualmente; claro, ele também suporta abertura e fechamento manual; Se você está buscando um crescimento estável e constant
SyncDB LT
Maxim Kuznetsov
A   service   to   keep   the   SQLite   database up   to   date .   Fast   real -t ime   operation .   Saves   open   positions   and   orders ,   current   quotes ,   and   trading   history .   Take   advantage   of   SQLite 's   capabilities   for   intermediate   data   storage ,   analytics ,   and   integration   of the   MetaTrader   platform .   Save   all   your   data   in   one   place .   Use   the   saved   data   in   SQL   analytical   queries ,   from   Python   and   other   la
FREE
Are you tired of drawing trendlines every time you're analyzing charts? Or perhaps you would like more consistency in your technical analysis. Then this is for you. This indicator will draw trend lines automatically when dropped on a chart. How it works Works similar to standard deviation channel found on mt4 and mt5. It has 2 parameters: 1. Starting Bar 2. Number of bars for calculation The   starting bar   is the bar which drawing of the trend lines will begin, while the   number of bars for c
FREE
SR Arrows mt5
Natasha Diedericks
This indicator gives you arrows, two SR lines and a golden trend line. Uses a special trend algorithm to plot the arrows, combined with support and resistance inputs. Perfect for channel trading. Features alert functions. Parameter TrendArrowPeriod. Parameter TrendLinePeriod. (Change to your preference) How to use: Simply attach to any chart with default settings. Zoom in the chart, to see the two blue SR lines and arrows more clearly. When the blue SR line is below the price, golden trend line
Follow The Line MT5
Oliver Gideon Amofa Appiah
4.52 (29)
This indicator obeys the popular maxim that: "THE TREND IS YOUR FRIEND" It paints a GREEN line for BUY and also paints a RED line for SELL. (you can change the colors). It gives alarms and alerts of all kinds. IT DOES NOT REPAINT and can be used for all currency pairs and timeframes. Yes, as easy and simple as that. Even a newbie can use it to make great and reliable trades. NB: For best results, get my other premium indicators for more powerful and reliable signals. Get them here: https://www.m
FREE
Binary Options Assistant (BOA) BURN Signals Indicator provides signals based on Ana Trader Binary Options Strategy. Indicators: MACD & Stochastic Stop missing trades, stop jumping from chart to chart looking for trade set-ups and get all the signals on 1 chart! U se any of the BOA Signals Indicator with the  Binary Options Assistant (BOA) Multi Currency Dashboard .  All BOA Signal Indicator settings are adjustable to give you more strategy combinations. The signals can be seen visually and hea
RTS5Pattern-touch-mouse -EN is a revolutionary statistical indicator designed for the MetaTrader 5 platform, bringing an innovative approach to technical analysis and market movement prediction. This indicator combines advanced mathematical methods, including normalization and historical data analysis, with a user-friendly interface and precise trading capabilities. RTS5Pattern-touch-mouse -EN is an ideal tool for traders looking to improve their trading strategies and achieve better results.
NasdaqInvestor | expert advisors Este robot funciona exlusivamente para o Nasdaq e no timeframe H1 e saldo mínimo de 500$. O robôt tem três tipos de ordens. 1. Ordens contra tendência das médias móveis de 85 e 110, 2. Ordens a favor da tendência das médias móveis de 85 e 110 e 3. Ordens Scalping a favor e contra tendência de outras Médias móveis 13 e 21 para compensar quando as outras ordens tipo 1 e 2 estiverem no negativo. Devido à natureza deste robôt, é normal que tenha drawdawns, fazem par
20 Sources, Non-Repainting, Fast Performance Introducing the All-In-One Supertrend: my first attempt at creating the ultimate trading tool. Designed with flexibility and customization in mind, each source is fully adjustable and integrates seamlessly with the others, allowing you to craft a strategy that fits your unique trading style, without compromising on speed or performance. Note : Each indicator is clear and straightforward -- no black-box methods or gimmick names (like I have seen on
Trend Screener Pro MT5
STE S.S.COMPANY
4.88 (68)
Desbloqueie o poder da negociação de tendências com o indicador Trend Screener: sua solução definitiva de negociação de tendências, alimentada por lógica difusa e sistema de múltiplas moedas! Eleve sua negociação de tendências com o Trend Screener, o revolucionário indicador de tendências alimentado por lógica difusa. É um poderoso indicador de acompanhamento de tendências que combina mais de 13 ferramentas e recursos premium e 3 estratégias de negociação, tornando-o uma escolha versátil para to
Awesome Oscillator by Bill Williams with the ability to fine-tune and replace the averaging algorithms of the indicator, which significantly expands the possibilities of using this oscillator in algorithmic trading and brings it closer in its properties to such an indicator as the MACD. To reduce price noise, the final indicator is processed with an additional Smooth averaging. The indicator has the ability to give alerts, send mail messages and push signals when the direction of movement of th
Winter MT5
Natalyia Nikitina
Attention!   Contact me immediately after purchase   to receive setup instructions! The Winter MT5 — advisor is your reliable assistant in the Forex market. It uses key market patterns, such as price return after a sharp movement in any direction. Start the advisor on one chart, selecting the NZDCAD_e currency, and let the other currencies work automatically. This is a fully automated trading system that does not require any special skills from you. Just start the advisor and enjoy your free
Hello There, Today I want to show you my new researchable fore BUY SELL indicator, it work all asset, and also work Derive Volatility asset! it work all time frame, but i recommend start 5 minute to H1 when you receive a signal just take trade and stay wait for your take profit asset All Major Pair And minor IT WORK ALSO XAUUSD Fantastic results,  for more info,,, message us thank you   
Aqui estão os resultados do teste forward. (MT4 ver.) USDJPY Trend Surfer é uma ferramenta de negociação inovadora projetada como um EA (Expert Advisor) de acompanhamento de tendências. Este EA captura com precisão a tendência do USDJPY combinando múltiplas SMAs (Médias Móveis Simples), RSI (Índice de Força Relativa) e StdDev (Desvio Padrão). Ao utilizar várias SMAs, ele analisa simultaneamente as tendências em diferentes períodos e, ao combinar indicadores como RSI e StdDev, detecta condições d
Os compradores deste produto também adquirem
TPSpro RFI Levels MT5
Roman Podpora
4.67 (15)
INSTRUÇÕES         Russo   -        ENG       R   ecomendado para uso com um indicador       -       TPSpro   TREND PRO -   Versão MT4         Um elemento-chave na negociação são as zonas ou níveis a partir dos quais as decisões de comprar ou vender um instrumento de negociação são tomadas. Apesar das tentativas dos principais participantes de esconder sua presença no mercado, eles inevitavelmente deixam rastros. Nossa tarefa era aprender como identificar esses rastros e interpretá-los corretame
Agora US $ 147 (aumentando para US $ 499 após algumas atualizações) - Contas ilimitadas (PCs ou Macs) Manual do usuário do RelicusRoad + vídeos de treinamento + acesso ao grupo de discórdia privado + status VIP UMA NOVA FORMA DE OLHAR PARA O MERCADO O RelicusRoad é o indicador de negociação mais poderoso do mundo para forex, futuros, criptomoedas, ações e índices, oferecendo aos traders todas as informações e ferramentas necessárias para se manterem rentáveis. Fornecemos análises técnica
Quantum TrendPulse
Bogdan Ion Puscasu
5 (5)
Apresentando   Quantum TrendPulse   , a ferramenta de negociação definitiva que combina o poder do   SuperTrend   ,   RSI   e   Stochastic   em um indicador abrangente para maximizar seu potencial de negociação. Projetado para traders que buscam precisão e eficiência, este indicador ajuda você a identificar tendências de mercado, mudanças de momentum e pontos de entrada e saída ideais com confiança. Principais características: Integração SuperTrend:   siga facilmente a tendência predominante do
FX Volume MT5
Daniel Stein
4.93 (14)
Ganhe uma verdadeira vantagem no Forex com o Volume FX: O melhor indicador de volume O FX Volume é o primeiro e único indicador de volume a revelar o sentimento genuíno do mercado a partir de uma perspetiva interna. Ao fornecer informações exclusivas sobre como os participantes do mercado institucional e os corretores estão posicionados, o FX Volume permite que você negocie com a previsão geralmente reservada para os principais participantes. Diga adeus aos atrasos dos relatórios COT - o FX Vo
Este é um indicador para MT5 que fornece sinais precisos para entrar em uma negociação sem redesenhar. Ele pode ser aplicado a qualquer ativo financeiro: forex, criptomoedas, metais, ações, índices. Ele fornecerá estimativas bastante precisas e informará quando é melhor abrir e fechar um negócio. Assista o vídeo (6:22) com um exemplo de processamento de apenas um sinal que compensou o indicador! A maioria dos traders melhora seus resultados de negociação durante a primeira semana de negociação c
MetaForecast M5
Vahidreza Heidar Gholami
5 (2)
MetaForecast prevê e visualiza o futuro de qualquer mercado com base nas harmonias nos dados de preços. Embora o mercado nem sempre seja previsível, se houver um padrão nos preços, o MetaForecast pode prever o futuro com a maior precisão possível. Em comparação com outros produtos similares, o MetaForecast pode gerar resultados mais precisos ao analisar as tendências do mercado. Parâmetros de entrada Past size (Tamanho do passado) Especifica o número de barras que o MetaForecast usa para criar
TrendMaestro5
Stefano Frisetti
note: this indicator is for METATRADER4, if you want the version for METATRADER5 this is the link:  https://www.mql5.com/it/market/product/108106 TRENDMAESTRO ver 2.4 TRENDMAESTRO recognizes a new TREND in the bud, he never makes mistakes. The certainty of identifying a new TREND is priceless. DESCRIPTION TRENDMAESTRO identifies a new TREND in the bud, this indicator examines the volatility, volumes and momentum to identify the moment in which there is an explosion of one or more of these data a
MetaBands M5
Vahidreza Heidar Gholami
4.5 (2)
MetaBands utiliza algoritmos poderosos e únicos para desenhar canais e detectar tendências, a fim de fornecer aos traders pontos potenciais para entrar e sair de negociações. É um indicador de canal mais um indicador de tendência poderoso. Inclui diferentes tipos de canais que podem ser mesclados para criar novos canais simplesmente usando os parâmetros de entrada. O MetaBands usa todos os tipos de alertas para notificar os usuários sobre eventos de mercado. Recursos Suporta a maioria dos algori
FX Power MT5 NG
Daniel Stein
5 (7)
Desbloquear todo o poder do FX Power NG: o derradeiro medidor de força da moeda Durante mais de oito anos, o FX Power capacitou os operadores de todo o mundo com uma análise fiável e precisa da força da moeda. Agora, o FX Power NG leva esta ferramenta de confiança para o próximo nível, oferecendo funcionalidades avançadas que proporcionam uma precisão, personalização e conhecimentos inigualáveis à sua negociação. O que faz do FX Power NG uma ferramenta indispensável para os operadores sérios
Quantum Trend Sniper
Bogdan Ion Puscasu
4.73 (51)
Apresentando       Quantum Trend Sniper Indicator   , o inovador Indicador MQL5 que está transformando a maneira como você identifica e negocia as reversões de tendência! Desenvolvido por uma equipe de traders experientes com experiência comercial de mais de 13 anos,       Indicador de Atirador de Tendência Quântica       foi projetado para impulsionar sua jornada de negociação a novos patamares com sua forma inovadora de identificar reversões de tendência com precisão extremamente alta. ***C
Royal Scalping Indicator M5
Vahidreza Heidar Gholami
5 (6)
Royal Scalping Indicator is an advanced price adaptive indicator designed to generate high-quality trading signals. Built-in multi-timeframe and multi-currency capabilities make it even more powerful to have configurations based on different symbols and timeframes. This indicator is perfect for scalp trades as well as swing trades. Royal Scalping is not just an indicator, but a trading strategy itself. Features Price Adaptive Trend Detector Algorithm Multi-Timeframe and Multi-Currency Trend Low
Weis Wave with Alert MT5
Trade The Volume Waves Single Member P.C.
4.94 (16)
Rental/Lifetime Package Options and Privileges  Rent Monthly Six Months   Yearly/Lifetime Weis Wave with Speed with Alert+Speed Index x x x Manual  x x x Quick Set up Video x x x Blog x x x Lifetime Updates x x x Setup and Training Material x x Discord Access Channel "The SI traders"          x Rectangle Break Alert Tool      x How to trade with it:    http://www.tradethevolumewaves.com   ** If you purchase please contact me to setup your  : Two hour  webinar and  training Room and  com
FxaccurateLS
Shiv Raj Kumawat
WHY IS OUR FXACCCURATE LS MT5 THE PROFITABLE ? PROTECT YOUR CAPITAL WITH RISK MANAGEMENT Gives entry, stop and target levels from time to time. It finds Trading opportunities by analyzing what the price is doing during established trends. POWERFUL INDICATOR FOR A RELIABLE STRATEGIES We have made these indicators with a lot of years of hard work. It is made at a very advanced level. Established trends provide dozens of trading opportunities, but most trend indicators completely ignore them!
TPA True Price Action indicator reveals the true price action of the market makers through 100% non-repainting signals strictly at the close of a candle! TPA shows entries and re-entries, every time the bulls are definitely stronger than the bears and vice versa. Not to confuse with red/green candles. The shift of power gets confirmed at the earliest stage and is ONE exit strategy of several. There are available now two free parts of the TPA User Guide for our customers. The first "The Basics"
Blahtech Supply Demand MT5
Blahtech Limited
4.54 (13)
Was: $299  Now: $149  Supply Demand uses previous price action to identify potential imbalances between buyers and sellers. The key is to identify the better odds zones, not just the untouched ones. Blahtech Supply Demand indicator delivers functionality previously unavailable on any trading platform. This 4-in-1 indicator not only highlights the higher probability zones using a multi-criteria strength engine, but also combines it with multi-timeframe trend analysis, previously confirmed swings
Trend Forecaster
Alexey Minkov
5 (6)
!!!CHRISTMAS SALE!!! The Trend Forecaster indicator utilizes a unique proprietary algorithm to determine entry points for a breakout trading strategy. The indicator identifies price clusters, analyzes price movement near levels, and provides a signal when the price breaks through a level. The Trend Forecaster indicator is suitable for all financial assets, including currencies (Forex), metals, stocks, indices, and cryptocurrencies. You can also adjust the indicator to work on any time frames, al
CBT Quantum Maverick Sistema de Negociação de Opções Binárias de Alta Eficiência O CBT Quantum Maverick é um sistema de opções binárias de alto desempenho, projetado para traders que buscam precisão, simplicidade e um enfoque disciplinado. Não exige personalização: o sistema está otimizado para resultados eficazes desde o início. Basta seguir os sinais, que podem ser dominados com um pouco de prática. Principais características: Precisão nos sinais: Sinais baseados na próxima vela, utilizand
Gartley Hunter Multi
Siarhei Vashchylka
5 (9)
Gartley Hunter Multi - An indicator for searching for harmonic patterns simultaneously on dozens of trading instruments and on all possible timeframes. Manual (Be sure to read before purchasing) | Version for MT4 Advantages 1. Patterns: Gartley, Butterfly, Shark, Crab. Bat, Alternate Bat, Deep Crab, Cypher 2. Simultaneous search for patterns on dozens of trading instruments and on all possible timeframes 3. Search for patterns of all possible sizes. From the smallest to the largest 4. A
PZ Trend Trading MT5
PZ TRADING SLU
3.8 (5)
O Trend Trading é um indicador projetado para lucrar o máximo possível com as tendências que ocorrem no mercado, cronometrando retrocessos e rupturas. Ele encontra oportunidades de negociação analisando o que o preço está fazendo durante as tendências estabelecidas. [ Guia de instalação | Guia de atualização | Solução de problemas | FAQ | Todos os produtos ] Negocie mercados financeiros com confiança e eficiência Lucre com as tendências estabelecidas sem ser chicoteado Reconhecer retrocesso
Descubra os níveis de FX: O seu melhor indicador de suporte e resistência para o sucesso da negociação O FX Levels é mais do que apenas um indicador de suporte e resistência; é um divisor de águas para traders sérios que desejam precisão, confiabilidade e funcionalidade contínua em todos os símbolos de negociação - sejam pares de moedas, índices, ações ou commodities. Construído com base no comprovado método Lighthouse e aprimorado com adaptabilidade dinâmica e em tempo real, o FX Levels traz
Advanced Supply Demand MT5
Bernhard Schweigert
4.5 (14)
Atualmente com 33% de desconto! A melhor solução para qualquer Trader Novato ou especialista! Este indicador é uma ferramenta de negociação exclusiva, de alta qualidade e acessível porque incorporamos uma série de recursos proprietários e uma nova fórmula. Com esta atualização, você poderá mostrar fusos horários duplos. Você não só será capaz de mostrar um TF mais alto, mas também mostrar ambos, o TF do gráfico, MAIS o TF mais alto: MOSTRANDO ZONAS ANINHADAS. Todos os traders de Oferta e Demanda
Royal Wave Pro M5
Vahidreza Heidar Gholami
3.5 (4)
Royal Wave is a Trend-Power oscillator which has been programmed to locate and signal low-risk entry and exit zones. Its core algorithm statistically analyzes the market and generates trading signals for overbought, oversold and low volatile areas. By using a well-designed alerting system, this indicator makes it easier to make proper decisions regarding where to enter and where to exit trades. Features Trend-Power Algorithm Low risk Entry Zones and Exit Zones Predictions for Overbought and Over
Elliot Waves Analyzer Pro
Viktor Weidenthal
2.67 (3)
Elliot Waves Analyzer Pro calculates Elliot Waves to Help Identify Trend direction and Entry Levels. Mainly for Swing Trading Strategies. Usually one would open a Position in trend direction for Wave 3 or a Correction for Wave C . This Indicator draws Target Levels for the current and next wave. Most important Rules for Elliot Wave Analysis are verified by the Indicator.  The Pro version analyzes Multiple Timeframes and shows the Subwaves and Target-Levels.   For an Overview  " Elliot Waves Anal
Trend Master Pro MT5
Tatiana Zyrianova
4.5 (2)
MT5 trend indicator with a probability of reaching a profit of 70-90%! Works without redrawing and delays. Trend Master PRO shows good results on all trading instruments: currencies, metals, indices, stocks, cryptocurrencies. Recommended timeframe: H1-H4. More information about the indicator is here :  https://www.mql5.com/en/blogs/post/744748 Recommendations for use Use automatic period detection           The main feature of the indicator is the self-optimization function.             Th
Apresentando       Quantum Breakout PRO   , o inovador Indicador MQL5 que está transformando a maneira como você negocia Breakout Zones! Desenvolvido por uma equipe de traders experientes com experiência comercial de mais de 13 anos,       Quantum Breakout PRO       foi projetado para impulsionar sua jornada comercial a novos patamares com sua estratégia de zona de fuga inovadora e dinâmica. O Quantum Breakout Indicator lhe dará setas de sinal em zonas de breakout com 5 zonas-alvo de lucro e
Mega Spikes Max
Niccyril Chirindo
Are you tired of missing out on the biggest opportunities in Boom and Crash trading? Mega Spikes Max is your ultimate tool for dominating the markets, giving you the precision and confidence you need to succeed. Why Choose Mega Spikes Max? Stay Ahead with Real-Time Alerts Never miss a profitable trade again. Get instant notifications directly to your mobile or desktop when a spike is imminent, even if you're away from your screen. Accurate Spike Detection Engineered for pinpoint accuracy,
Was: $249  Now: $149   Market Profile defines a number of day types that can help the trader to determine market behaviour. A key feature is the Value Area, representing the range of price action where 70% of trading took place. Understanding the Value Area can give traders valuable insight into market direction and establish the higher odds trade. It is an excellent addition to any system you may be using. Inspired by Jim Dalton’s book “Mind Over Markets”, this indicator is designed to suit the
AT Forex Indicator MT5
Marzena Maria Szmit
5 (5)
The AT Forex Indicator MT5 is a sophisticated trading tool designed to provide traders with a comprehensive analysis of multiple currency pairs. This powerful indicator simplifies the complex nature of the forex market, making it accessible for both novice and experienced traders. AT Forex Indicator uses advanced algorithms to detect trends, patterns and is an essential tool for traders aiming to enhance their forex trading performance. With its robust features, ease of use, and reliable signal
Bill Williams Advanced
Siarhei Vashchylka
5 (9)
Bill Williams Advanced is designed for automatic chart analysis using Bill Williams' "Profitunity" system. The indicator analyzes four timeframes at once. Manual (Be sure to read before purchasing) Advantages 1. Automatically analyzes the chart using the "Profitunity" system of Bill Williams. The found signals are placed in a table in the corner of the screen. 2. Equipped with a trend filter based on the Alligator indicator. Most of the system signals are recommended to be used only accordi
The Volume Spread Analysis indicator is based on the original Volume Spread Analysis method. It was designed for quick and easy recognition of VSA patterns. Even though this indicator looks very simple, it is the most sophisticated tool we've ever made. It is a really powerful analytical tool that generates very reliable trading signals. Because it is very user-friendly and understandable, it is suitable for every type of trader, regardless of his experience. What is VSA? VSA - Volume Spread
Mais do autor
NTL EAsiTrader
Northen Trading Labs
EAsiTrader: Advanced Automation for MetaTrader 5 EAsiTrader: Advanced Automation for MetaTrader 5 Create, Customize, and Automate Trading Strategies with Ease EAsiTrader is a versatile trading tool for MetaTrader 5, providing automation features and a comprehensive set of tools to help users build, test, and refine trading strategies. EAsiTrader adapts to various trading styles, whether you prefer full automation or manual trade management. *Note: EAsiTrader is not compatible with the MT5 Strat
AutoFib: Advanced Fibonacci Retracement for MetaTrader 5 Automate Fibonacci Analysis for Smarter Trading Decisions AutoFib simplifies Fibonacci retracement analysis by automatically identifying key levels of support and resistance directly on your MT5 charts. Whether you're new to Fibonacci analysis or an advanced trader, AutoFib enhances your ability to identify potential reversals, continuations, and critical price levels. Key Features: Automatic Fibonacci Levels – Identify retracement and ext
Japanese Candle Patterns (JCP) User Guide Overview and Features Japanese candlestick patterns, a foundational element of technical analysis, provide traders with visual insights into market psychology. Each pattern represents the battle between bulls and bears, encapsulating critical information about market sentiment, potential reversals, and continuation signals. Developed centuries ago and later popularized by Steve Nison in Japanese Candlestick Charting Techniques , these patterns are now wi
NTL Pivot Lines
Northen Trading Labs
Pivot Lines (PL) User Guide Overview and Features The Pivot Lines Indicator (PL) provides traders with a powerful tool for identifying potential support and resistance levels based on well-established pivot point calculation methods. By offering insights into possible price turning points, this indicator helps traders make more informed trading decisions and refine their entry and exit strategies. With customizable settings for different timeframes and calculation methods, PL is versatile and a
ABH - Candle Component Analysis - User Guide Overview and Features The   ABH - Average Bar Height   indicator is designed to help traders analyze market volatility and identify potential buy and sell signals by measuring the average size of each candlestick component over a specific period. The indicator calculates and displays four lines representing different candlestick metrics. By analyzing these values, traders can interpret market strength, volatility, and potential trend changes. Beyond
NTL Market Times
Northen Trading Labs
NTL Market Times Indicator The NTL Market Times Indicator for MT5 provides a clear unobtrusive display of the opening and closing times of the world’s major Forex trading centers. It automatically adjusts for UK daylight saving time, ensuring reliable market session information all year round. Main Features Major Markets: Displays New York, London, Frankfurt, Sydney, and Tokyo trading hours. Color-Coded Sessions: Each market session is uniquely color-coded for quick identification on the chart.
Filtro:
Sem comentários
Responder ao comentário