Смотри обучающее видео по маркету на YouTube
Как купить торгового робота или индикатор
Запусти робота на
виртуальном хостинге
виртуальном хостинге
Протестируй индикатор/робота перед покупкой
Хочешь зарабатывать в Маркете?
Как подать продукт, чтобы его покупали
Торговые роботы и индикаторы для MetaTrader 5 - 57

Túnel de Vegas, com até 20 níveis, permitindo plotar ou não cada nível com troca de cor, espessura das linhas e visualização ON/OFF para facilitar a utilização.
Recomendado a utilização para timeframes:
Original --> H1
Fractais --> M15, M30, H4, D1 e W1 Teste em Gráfico W1 apresentando consistência.: https://www.mql5.com/pt/signals/2211259 Acompanhe os resultados no meu sinal:
https://www.mql5.com/pt/signals/2211259
Tiago Lacerda Telegram: @tfmlacerda
E-mail: mediador@gmail.com
Yo
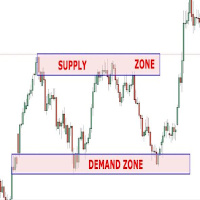
This Expert Advisor can be applied to many markets because It exploits basic supply/demand and price action concepts. It identifies the major rotation zones (PRZ), supply and demand zones and supports and resistances within major price trends. It buys at discount zones and sells at premium prices. It can and should be optimized through the Metatrader tester to find the best parameters to use for current market conditions. This is not a fixed strategy rather a full trading algo that will find whi

A simple script which will trigger a download of your broker's tick data for a specific trading instrument.
Simply add to your chart and it will start the process. You may add the script to multiple charts, enabling you to download tick data for more than one instrument at a time After a short period, the script will stop running and remove itself from your chart. Following this, it may take a few more minutes to finish downloading the tick data.
The Tick Data folder can be found via Meta
FREE

Trading panel for manual trading. Has a fairly wide functionality. Allows you to automatically calculate the order size, open both market and pending orders. It has a wide range of options for closing orders, it is possible to partially close orders, close orders after reaching a certain profit or loss, separately close profitable and unprofitable, buy and sell, as well as pending orders. The panel also contains a simple implementation of a grid of pending orders, reverse and lock functions, tr
FREE

The Indicator indicator draws 2 clouds based on Bollinger Bands indicator values. The upper cloud is formed by the upper lines values and the lower cloud by the lowers lines values. The indicator allows to change the Bollinger Bands parameters and the clouds colors the period of the base line and the deviations of each Bollinger Bands instance. The indicator holds 5 buffer index as follow: [0] - Outer values of the upper cloud [1] - Inner values of the upper cloud [2] - Base/Center line values
FREE

Backtesting PRO: Make a review of the market based on the available history of your broker. Practice your strategies and verify them in seconds. Remember to maintain excellent risk management, check your days and hours of operation. R emember to start it in the shortest period to operate. Any questions or suggestions can be sent to this email: autoeducacion0110@gmail.com
FREE
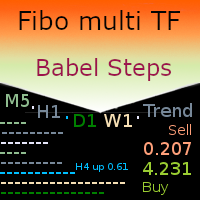
MT5 netting the “Babel Steps” robot uses the ZigZag indicator to generate Fibonacci levels on M1, M5, M15, H1, H4, D1, W1 periods of the charts , calculates the strength of trends for buying and selling. It opens a position when the specified trend level is exceeded plus Bollinger indicators and Stochastic indicators inform about oversold / overbought market. Stochastic and Bollinger indicators help to increase or decrease the position. If market moves into favorable direction the Robot genera
Aydmaxx Trade Tracker Описание: Aydmaxx Trade Tracker – это мощный и удобный инструмент для трейдеров, который позволяет отслеживать текущую прибыль или убыток по каждой сделке в режиме реального времени. Индикатор выводит на экран информацию о текущей прибыли, помогая трейдерам быстро оценивать результаты своих торговых операций. Основные функции: Отображение текущей прибыли или убытка по всем открытым позициям в реальном времени. Настройка угла экрана для отображения информации (правый нижний
FREE
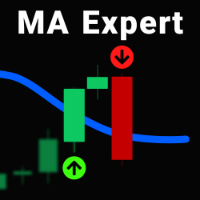
In previous products , we have published an indicator of this strategy, but now we offer you an Expert Advisor to make it easier for traders
The procedure is whenever the price or the candle (depending on entry condition in the "Inputs" section, "Touch_Line", or "Close_Candle"), hits the Moving Average, the EA will open a position buy/sell automatically based on the volume, SL and TP that you specify in the " Inputs " section.
You also can define the direction of the positions, Buy, Sell, o
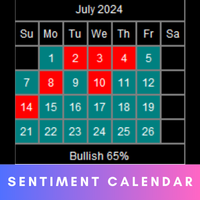
The Market Sentiment calendar provides a visual representation of market sentiment for each day or month. It will display daily and monthly BIAS . The calendar also highlights the percentage of bullish days or months within a given month or year. MT4 version - https://www.mql5.com/en/market/product/120767/ Inputs Frequency: Choose between "Daily" and "Monthly" calendar views. Sentiment Method: Select the method to determine daily or monthly sentiment: " L inear Regression ", " Accumu

This indicator saves the chart as a template when you change the symbol. It also loads the template from the new symbol. Therefore you are able to save all objects that you have drawn on the chart. It is an addition to the Watchlist Indicator.
How to use it: - Pull the indicator to the chart - The first parameter defines which timeframes are saved into one file. An example: If you do not want to see a drawn object (e.g. line) from D1 in M1 you need to specify the timeframes.
- The default v
FREE

The Market Thermometer can be used to help traders identify sleepy or turbulent periods.
It helps beginners to check when is the ideal time to enter operations, that is, when the value of the thermometer is below its average for several periods, identifying a peaceful market. When the market is heated, that is, the thermometer is above three times its average, it is time to make profits. The Thermometer measures the extent to which the end of a period, maximum or minimum price, projects outsi
FREE

The idea behind this indicator is to find all currency pairs that are over-bought or over-sold according to the RSI indicator at one go.
The RSI uses the default period of 14 (this can be changed in the settings) and scans all symbols to find the RSI level you will have specified. Once currency pairs that meet the specification are found, the indicator will open those charts for you incase those charts aren't open and proceed to write the full list of currencies on the experts tab.
FREE

Индикатор ColorLine отображает на графике цены линию (скользящую среднюю). Линия окрашивается по 100 баров тремя различными цветами, при этом каждые 5 тиков цветовавя схема меняется (всего 3 цветовых схемы). Индикатор для демонстрации стиля DRAW_COLOR_LINE . Рисует цветными кусками по 20 баров линию по ценам Close. Толщина,стиль и цвет участков линии меняется случайным. Код индикатора опубликован в MQL5 Документации в разделе Стили индикаторов в примерах
FREE

The RFOC Symbol Background was created to display the name of the asset and the current timeframe in the background of the chart.
Displaying the name of the asset at the bottom of the chart is often used by traders who are designing the screen for spectators, making it easier to identify the asset and the timeframe during a class, for example.
It is available for the user to select the font size (small, medium or large) and select the color for better viewing according to the background colo
FREE

Stat Monitor – это хороший информационный индикатор.
Преимущества индикатора: Индикатор выдает полезную информацию - текущий спред, стоимость одного лота символа, торговое плечо и рекомендуемый размер лота для торговли.
Использовать индикатор можно на торговой платформе MetaTrader 5 любого брокера. Индикатор можно использовать как отличное основное дополнение к вашей торговой системе.
Версия индикатора Stat Monitor для MetaTrader 4 Желаю всем удачи в торговле и стабильного профита!
FREE
Советник рекомендован для торговли на USDCHF M15. Основан на стратегии "пересиживания", точки входа в рынок (и выхода) определяет на основе корреляции ряда индикаторов. Торговый объем для открытия позиции зависит от результатов предыдущих сделок. Есть возможность ограничить размер риска (параметр AutoMM). Также есть возможность установить максимальный спред, при превышении которого советник будет автоматически приостанавливать торговлю (параметр MaxSpread). Также обладает расширенной функциональ
FREE
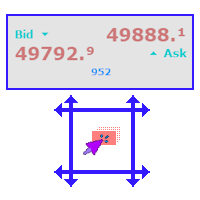
A simple and functional Current Price Panel that shows magnified Bid, Ask and spread price, that can be moved by using the mouse, to any location of the chart window. The functionality included are: Customize Current Price Panel Contents shown on Panel Width and Height, Row and Column gap. Background color, background transparency and border color. Font, its size and color. Move the panel to any location of chart window. Option to show current spread as pips or points. Highlight spread in differ
FREE

Blahtech Fisher Transform indicator is an oscillator that displays overbought and oversold locations on the chart. The Fisher Transform algorithm transforms prices with any distribution shape into a normal distribution. The end result is a curve with sharp turning points that may help to identify bullish or bearish trends. Fisher Transform values exceeding 1.66 on the daily chart are considered to be good areas for reversal trades. Links [ Install | Update | Training | All Products ]

NOW FREE!! It's crucial to note that, like any trading tool, ForexClimber EA doesn't guarantee profits. Forex trading carries risks, and market volatility means success is never certain. The pricing of ForexClimber EA is dynamic, and as it gains popularity, the cost for renting or buying may increase. Invest now to secure your place in Forex trading advancement. Seize the opportunity, navigate the markets, and let ForexClimber EA support your Forex trading aspirations.
FREE

This EA automatically closes all Open Trades and Pending Orders at your specified Net Profit or Net Loss. The TP and SL for a single trade can easily be set in Meta Trader, on individual basis and on hitting that TP or SL, the trade is automatically closed. However, if you have multiple trades and you want to set a Net TP and Net SL (in terms of profit & loss) for all of them, then Meta Trader cannot help you. Here comes this EA “Net TP Net SL Setter” using which you can set a Net TP and Net SL
FREE

Pending Order Grid is a multi-symbol multi-timeframe Expert Advisor that enables multi-strategy implementation based on pending order grids. The EA offers multi-option through input parameters to configure the pending orders. General Description
Pending Order Grid allows the performing of a user-defined strategy through the creation of one or more grids of pending orders. The Expert Advisor places pending orders of a given type (Buy Limit, Sell Limit, Buy Stop, or Sell Stop) at equidistant

Вычисляет уровни pivot. В зависимости от расположения цен относительно этих уровней закрашивает гистограмму. Значения параметров: style - выбор типа отображения (Histogram, Line, Arrow) price - цена, мало влияет на конечный вид, но это можно настроить timeframe - выбор таймфрейма для расчета уровней. color over pivot line - цвет всего что выше уровня pivot color under pivot line - цвет всего что ниже уровня pivot pivot line intersection color - цвет, когда тело свечи пересекает центральную ли
FREE

Close All and Change Take Profit and Stop Loss All Orders. Main Features
Ability to Close All Orders the Symbol you put this EA. Ability to Change Take Profit to All Order. Ability to Change Stop Loss to All Order. Show Order count. Show Average price with info and Horizontal Line. Show lot open.
Show Price diff from average to price now Show broken price with info and Horizontal Line. Easy to use . How to use
Close All (Symbol) PC : you can click on Clos

All Symbols AND All Time frames Scan
Document Introduction
A breakout refers to when the price of an asset moves above a resistance zone or moves below a support zone. A breakout indicates the potential for a price trend to break.Break provides a potential business opportunity. A break from the top signals to traders that it is better to take a buy position or close a sell position. A breakout from the bottom signals to traders that it is better to take sell positions or close the

The purpose of the remaining time indicator on the K-line is to assist traders in gaining a deeper understanding of market dynamics and making more precise trading decisions, particularly in the realm of forex and binary short-term trading. The significance of this indicator and its application to various trading strategies will be thoroughly examined below: Enhancement of Trading Timing Accuracy - Precision: By displaying the remaining time of the current K-line cycle, traders can achieve great
FREE

Индикатор Accurate Gold - это удобный инструмент, который интуитивно понятен и прост в использовании, независимо от уровня опыта трейдера. Он предназначен для трейдеров, ищущих точные сигналы на временном интервале M5 на рынке золота. Этот индикатор использует передовые математические алгоритмы для анализа движения цен и динамики объема, генерируя точные сигналы на покупку и продажу. Отличительные особенности этого индикатора, включая его нерепейнтовый характер, предоставляют трейдерам ценны
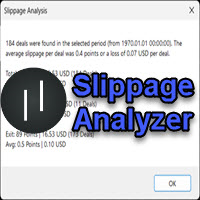
If you are using scalping strategies (or any strategy that uses stop orders for position opening or closing) you need to know your slippage. Slippage is the difference between your pending order price and the price that your brokers uses to execute your order. This can be really different and depends on the broker as well as on the market conditions (news, trading hours, etc..) With this small script you can calculate the slippage you "paid" in points and also in your account currency. You also
FREE

В индикаторе SM Trend Cloud для расчета и отрисовки использовано два буфера. Одним из основных достоинств данного инструмента является простота, при этом его сигналы могут быть достаточно точны. Но, опять же, перед нами трендовый индикатор, а потому ложные сигналы он будет генерировать преимущественно в условиях консолидации. При этом не советую использовать индикатор в самостоятельном виде, тут без дополнительных фильтров не обойтись. В качестве дополнительно сигнала предлагаю использовать инди
FREE

This is a volume indicator with the addition of a threshold level that can be set to a fixed value chosen personally or obtained from the average of the volume values themselves. The type of averaging method can be selected in the input parameters.
The input parameters are easy to interpret but let's examine them:
1 - Volume type Here you can select the type of volume you want to see represented and there are 2 choices, either TICK volume or REAL volume. Keep in mind that for forex, for exa
FREE

Новое предупреждение о свечах, предупреждение появляется в соответствии с временным периодом, на котором оно размещено. Индикатор работает на любом активе, предупреждение может быть отключено в любое время, без необходимости удаления индикатора с графика. Это отлично подходит для тех, кто не может постоянно следить за графиком. Крепкие объятия !! Novoye preduprezhdeniye o svechakh, preduprezhdeniye poyavlyayetsya v sootvetstvii s vremennym periodom, na kotorom ono razmeshcheno. Indikator rabot
FREE

Встречайте Ultimate Breakout EA: Breakout Rider! Ваш ключ к доминированию на рынках Forex, индексов и золота! НАПИШИТЕ МНЕ ЛИЧНО ЗДЕСЬ ПОСЛЕ ПОКУПКИ, ЧТОБЫ ПОЛУЧИТЬ ПОШАГОВОЕ ВИДЕО О том, КАК НАСТРОИТЬ ЭКСПЕРТ-СОВЕТНИК ЛУЧШИМ СПОСОБОМ! Я ВСЕГДА ОТВЕЧАЮ БЫСТРО, МАКСИМАЛЬНОЕ ОЖИДАНИЕ МОЖЕТ СОСТАВИТЬ 48 ЧАСОВ, ЕСЛИ Я В ПРАЗДНИКЕ Готовы поднять свой трейдинг на новый уровень и воспользоваться рыночными возможностями? Откройте для себя Breakout Rider – передовой советник, тщательно разработанный для
Внимание : Демо-версию для ознакомления и тестирования можно скачать здесь . Демо-версия не позволяет совершать торговые операции и может быть запущена только на одном графике. Active Lines - мощный профессиональный инструмент для работы с линиями на графике. Active Lines предоставляет широкий набор действий для событий, связанных с пересечением ценой линий. Например: оповестить, открыть/модифицировать/закрыть позицию, разместить/удалить отложенные ордера. Active Lines позволяет к одной линии

This utility allows to switch among symbols. You have to insert in the input your favorite tickers. it is possible to customize up to 5 symbols
Shortcut Keys : Switch among Symbols : A -Forward D -Backward
Inputs You can setup your favorite keys to switch among symbols.
You can customize the color of background and the edge of the buttons .
You can customize the labels : dimension and font.
FREE

Этот неторгующий эксперт предназначен для преобразования неструктурированной информации веб-страниц в структурированные табличные данные. Он скачивает и парсит HTML файл, создает по нему иерархию объектов DOM ( Document Object Model ), затем применяет указанные селекторы CSS ( Cascading Style Sheets , англ.) для требуемых полей данных и выделяет для них конкретные значения. Иными словами, это - мощный, настраиваемый конвертер из HTML в CSV ( Comma-Separated Values ). Эксперт может обрабатывать с

Having a chart window that has multiple pairs (symbols), timeframes, and indicators displayed simultaneously can be quite advantageous. This indicator will allow traders to place multiple chart objects in a sub window of the main chart window. The indicator is capable of adding all available MT5 indicators and custom indicators to the existing chart. The list and parameters of the indicators are for reference at: https://www.mql5.com/en/docs/indicators
Input parameters Name
Example
Indicat
FREE

Indicator for fast navigation through financial instruments. When you click on the button, you go to the chart of the financial instrument, the name of which was written on the button. In other words, the indicator opens or unfolds an existing chart window. For each chart, you can customize the name of the financial instrument, text color and background color; in total, you can customize symbols buttons that you trade often. The indicator can be installed on any charts for which you need to swit
FREE

Это Бета версия моего трендового индикатора. Он построен на принципе схожем с нейросетями, и это расчет многомерного полинома. При установке его на график или при изменениях в параметрах индикатора, а также при переключении периода графика, происходит первоначальная инициализация индикатора. При инициализации не только пересчитывается весь период графика, но и происходит самообучение индикатора. Параметры индикатора: Sensitivity (100 max) - чувствительность к глобальным трендам, определяться ус
FREE

Nueva entrega en la familia de los Baby EAs: Baby RSI es un EA Experto basado en el indicador RSI. No usa martingala ni grilla, estrategia basada en RSI, Estrategia conservadora. La oscilación relativa del indice del precio o RSI detecta sobrecompras y sobreventas, si estas revierten o hacen Pullback Baby RSI se posicionará a favor de esa corrección de precio, solo si esto ocurre, si no, no. Baby RSI es un Ea muy simple, no necesita mucho más y es una de mis favoritas estrategias automatizadas
FREE

Non-proprietary study of Joe Dinapoli used for trend analysis. The indicator gives trend signals when the fast line penetrates the slow line. These signals remain intact until another penetration occurs. The signal is confirmed at the close of the period. It is applicable for all timeframes. Inputs lnpPeriod: Period of moving average. lnpSmoothK: %K period. lnpSmoothD: %D period. ********************************************************************************
FREE

Down load all the historic ticks data from a pair. Just load the EA to a graph, give it time to download all the data ticks and wait for the messages to appear as downloaded in the terminal. Once its downloaded, the data will appear in MQL5/Files folder as "ticks_data_XXXX.csv". where XXXX is the symbol from whom you just downloaded the data. You can use this data as input for a python file for ONNX or what ever you want or need. For big pairs, the data is Gb big.
FREE

This script exports the economic calendar from MT5 as a .csv-file into the common directory of the terminal (...\Terminal\Common\Files). The generated file news.csv is necessary for using the news filter in back testing the Range Breakout Day Trader EA.
Input parameters: Country 1: First country from which the news will be exported Country 2: Second country from which the news will be exported
Date from: Start date from which the calendar data will be exported Date to: End date to which the
FREE

Consecutive candles can give us an indication as to the strength of a trend. With this indicator, you can set the number of consecutive bull or bear candles you wish to be present before achieving a valid signal of RSI crossing into overbought or oversold. With this information, you can better judge if a continuation or reversal situation is about to present. RSI has two settable levels
Interesting settings: Number of consecutive candles needed before a valid signal Overbought level of RSI Ove
FREE
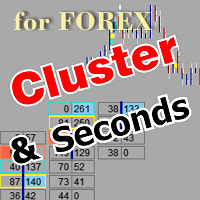
Утилита позволяет строить различные виды графиков: Секундный график от 1 секунды до 86400 секунд Тиковый график от 1 тика и выше Объемный график Дельтовый график Ренко график Рендж график Демоверсия продукта https://www.mql5.com/ru/channels/clustersecondforex
Встроенные индикаторы для объемного анализа: дневной профиль рынка и профиль рынка выбираемого таймфрейма, Cluster Search, Imbalance, VWAP, Dynamic POC, VAH, VAL профиль стакана цен вертикальный объем с различными вариантами отображения

Советник для MetaTrader 5 SeasonalEA позволяет трейдерам покупать/продавать символы по времени. Например, можно установить, чтобы советник покупал по понедельникам в 10:00 и продавал по вторникам в 17:00. Советник полезен для трейдеров, которые: изучают сезонные паттерны на Форексе и CFD изучают внутридневные паттерны осваивают торговлю по времени Советник может работать одновременно с шестью символами (если вы хотите торговать только на одной паре, просто установите остальные равными нулю).
В
FREE

В этом советнике реализованы функции: Начать торговлю, Завершить торговлю, Закрыть ордер(Время), Выставить отложенный ордер(Время), Трейлинг-стоп (автоматически по стратегии), возможность отключения торговли, дневной диапазон (стратегия), стоп-лосс за день (риск-менеджмент), Стоп-лосс (управление рисками), тейк-профит (мани-менеджмент), отслеживание стопа и отслеживание шага (стратегия), Риск на заказ (управление рисками) и многое другое!
Настраиваемые параметры: На свой страх и риск!! Исполь
FREE
3つの時間軸を分析に使います。 3つの時間軸が、全て同じ方向になった場合、上昇方向または、下降方向になった場合 その方向にエントリーをします。 決済は、上記同様全て同じ方向になった場合、上昇方向または、下降方向になった場合 その方向に決済をかけます。
時間軸は、変数として定義されています。 移動平均も、各変数として定義されています。
基本的に、単発ポジションをもち、追加購入はしません。 途中決済は、手動で行うことも可能です。 その場合、EA内では、ポジションなしとして処理されます。
ロット数、利益確保、ストップロスも変数として設定できます。
使用する前に、最適化等を行ったほうが精度をあげてトレードできると思います。 また、100%任せきりにするのは、おすすめしません。
FREE

Объем - широко используемый индикатор в техническом анализе, однако есть вариант, который даже более полезен, чем сам объем: скользящее среднее объема.
Это не что иное, как скользящая средняя, применяемая к популярному индикатору Volume.
Как следует из названия, Volume + MA служит для отображения объема транзакций (совершенных покупок и продаж) определенного финансового актива в заданный момент времени вместе со скользящей средней этого же объема с течением времени.
Для чего это? С помо
FREE
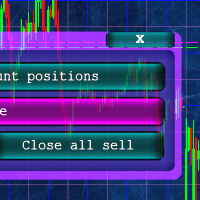
Кнопочная панель для одновременного закрывания большого числа позиций. Всего четыре варианта закрывания: Закрыть все позиции на счёте ( Close all account positions ). Закрыть все позиции по символу графика, на котором находится панель ( Close all positions ). Закрыть все Buy позиции по символу графика, на котором находится панель ( Close all Buy positions ). Закрыть все Sell позиции по символу графика, на котором находится панель ( Close all Sell positions ).
FREE
TradeFlow Dashboard MT5 представляет собой сдвиг парадигмы в управлении торговлей, предлагая надежное и универсальное решение, предназначенное для улучшения ваших стратегий управления рисками и оптимизации принятия решений на платформе Meta Trader 5. Благодаря своему элегантному и удобному интерфейсу этот инструмент превосходит обычный торговый опыт и особенно подходит для трейдеров, занимающихся ручным управлением, желающих повысить свою эффективность.
Давайте углубимся в ключевые моменты Tr
FREE

Ключом к успеху всегда является хорошая оптимизация.
Система имеет ряд переменных, и в этом случае ее простота является ключом к успеху.
Система ищет различные "гэпы", как сбои при входе в рынок, а затем отлаживает их через серию Moving Averages, чтобы решить, должен ли он войти или нет. Это простая, но мощная система. Переменные следующие:
Lot : Определяет размер партии.
TakeProfit : определяет тейк-профит в пунктах.
Stop Loss: Определяет стоп-лосс в пунктах.
Эти три переменные име
FREE

It is the simplest indicator in existence. It has only one function: report the seconds elapsed since the last minute end in a very convenient way, with a label that can be moved in the chart, so that the trader does not have to take his eye off the forming candle. It is used on M1, but also on larger intervals, for those interested in opening/closing positions at the best time. Sometimes an intense movement in the last 10" of the minute gives indications of future trend, and can be used for sc
FREE

Торговая система разработана для работы с золотом на временных периодах: 30M, 1H. Индикатор позволяет подстраиваться под рыночную ситуацию.
Параметры для 1H : PERIOD=9F , FILTER=300 .
Параметры для 30M : PERIOD=22B , FILTER=450 .
Допускается небольшая подстройка под конкретного брокера .
При изменении количества отображаемой истории, также может потребоваться подстройка параметров.
Индикатор не перерисовывается .
В "Gold n XAU" используются разные правила для входа

This indicator displays the spread Simple and easy to use and fully customisable: View as Pips or Pipettes Chart symbol can be hidden Text display can be changed Change color and text styles Add or hide a decimal point Spacing options between inputs Default screen positions Screen position inputs
How to use 1. Simply use the default settings; or 2. Choose to show pips or pipettes; 3. Choose to display symbol, text or decimal; 4. Choose where to place it on the screen; 5. Save settings or save
FREE

Posh Sessions is indicator which displays sessions in broker time or your local time. You can set up to 5 sessions, assign name, start time, end time and color of each session. There is session's range to help you make a chart analysis.
Settings for a session: Show: To show or not the session on chart Title: The title/name of the session Timezone: Select between broker or local time to implement the session's period Start time: The session start time End time: The session end time C
FREE

This is a simple EA Can only open ONE trade EVER then MUST be reattached to the chart everytime you want to use it. Designed to help manual traders Has lot sizes and stops / targets in pips. For a sell trade the engulfing bar must close below the previous green bars low Includes Alarm and Phone notifications
Basically if you find a price zone you like and will take a trade if there is an engulfing bar . use this.
FREE

It is the very same classic Stochastic indicator, but with a little twist: NO NAME and data is shown in the sub window. It could be stupid, BUT, if you are running out of space in Micro windows like Mini Charts, where the indicator's name is totally useless, you came to the right place. And that's it! I know it seems stupid but I needed the classical version of Stochastic indicator without that annoying name on my Mini Chart, so I did it that way... The original formula is right from Metaquote's
FREE

This indicator is based on the MACD indicator
Also, some candlestick patterns are used in it to identify better signals
Can be used in all symbols
Can be used in all time frames
Easy to use method
Adequate settings
Settings: period: The number of candles used to calculate signals. pFast: Like the MACD indicator settings pSlow: Like the MACD indicator settings
alarmShow: If you want to receive an alert in Metatrader after receiving the signal, enable this setting alarmShowNoti: If you
FREE

ProFactor is an indicator generating signals based price on the famous profit factor formula. The calculation is simply defined as gross GREEN BARS divided by gross RED BARS.
That's it in a nutshell, but sometimes the simplest things hold the most value.
So let's imagine your trading system's gross profit for the past year was $40,000 and your gross losses were $20,000. Your Profit Factor would be 2. The ProFactor calculation works on the price of the asset instead of the strategy out
FREE
Серия GLEB, версия 1.0. Высокочастотная система по минутным барам. Фиксированный лот . Множество настроек, в том числе по активным часам торговли. Основан на сделках Bay, сделки Sell - подключаемые. Краткое описание: 1. Переключатель стратегий: key "Speed" (on/off) 2. Контроль тренда: Shadow Control (on/off) 3. Глубина контроля тренда в барах: Shadow high for Shdw cntrl 4. Контроль спреда: Spread control (on/off) 5. Ограничитель для спреда: Volume Spread control (Points) 6. Автоматическ
FREE

Lite Hamster Scalping (Very Fast EA no Graphics)
The Lite Hamster Scalper is a Trading Robot with no use of Classic martingale. Schedule scalping Options. it uses some Indicators as a filter to maximize Correct entries.
Please to check The version 1.4 of Hamster Pro : Hamster_PRO_MT4 && Hamster_PRO_MT5 Recommendations : Lot : 0.01. Balance : 100 USD. Pair : EURUSD. TimeFrame : 5Min. Spread : 30. Broker : Trusted Brokers Inputs descriptions : Period Indicator1 - period of the fi
FREE
This is Boleta Long & Short NT-HDG, an Expert Advisor created with the function that will make operations carried out in Long & Short much easier.
> With just one click it is possible to mount a position in two assets simultaneously, further accelerating your actions right after the decision has been made.
> With it, it is also possible to operate in Hedge accounts, being able to set up positions in the same asset, for those who have strategies for this purpose.
> Can be used in multiple

Ронал Кутрим в течение 14 лет был увлеченным математиком с более чем 10-летним опытом работы на финансовом рынке.
Концепция теории проста - найти дисбаланс между покупателями и продавцами. В этом есть большой смысл, потому что ничто не растет вечно, ничто не падает вечно. Когда вы находите актив с математической вероятностью неравновесного равновесия, это отличный способ заняться трейдингом: Включите субтитры, видео сопровождается субтитрами
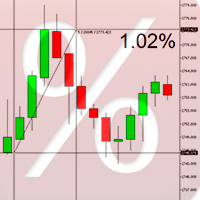
Percent Crosshair представляет собой мощный и простой инструмент измерения процентов. Быстрое измерение процентов на графике! Прекратите тратить время понапрасну! Просто прикрепите индикатор Percent Crosshair к графику, выберите на панели инструментов режим "Перекрестие" или нажмите "Ctrl+F" и используйте перекрестие привычным для вас способом! Проценты будут отображаться рядом с индикативной ценой. Настройте свой индикатор так, как удобно вам! Вам предлагаются 4 параметра для входа: Positive %

The Heikin Ashi Delta Pro leverages the refined elegance of Heikin Ashi candlesticks, renowned for their ability to filter market noise and highlight clearer trends and reversals. Building on a solid foundation, this advanced indicator integrates the Hull Moving Average method, enhancing its precision and responsiveness. Alongside an intuitive alert system, it transforms raw market data into actionable trading insights, empowering traders to make more informed decisions swiftly. Learn more about
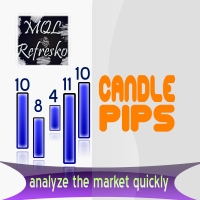
Индикатор "Candle Pips" - инструмент, позволяющий быстро увидеть размер свечи в платформе. Это хороший инструмент для трейдеров, желающих тщательно изучить рынок, а также полезный индикатор для стратегий, основанных на размере свечи. Индикатор отображает округленный размер в пипсах каждой свечи на текущем графике.
Его входные параметры просты Candle Type - часть свечи, которую необходимо измерять. "High__Low" - расстояние между максимумом и минимумом каждой свечи. "Open__Close" - размер тела с

Добро пожаловать в революцию трейдинга! Мы - команда экспертов по трейдингу с многолетним опытом, которые направили свои знания на разработку советника Zazen. Советник Zazen также может быть использован с PropTrading компаниями (например, FTMO). Советник имеет множество функций (например, ограничение просадки), которые особенно необходимы в сфере проп-трейдинга. Название "Zazen" не случайно. Оно происходит от буддийской практики медитации, которая способствует спокойствию, безмятежности и ясност

Warren Buffett famously said: "Be greedy when others are fearful. Be fearful when others are greedy." This expert advisor captures the very essence of this wisdom.
Indeed, since 1871, the U.S. stock index S&P500 has been growing at an average annual rate of 10%. That is why Warren Buffett has been advocating investing in it.
This EA boosts the annual return to 150% (or 8% monthly) by utilizing a grid approach. Simply attach it to the S&P500 chart (or "US500" / "US500Cash" for some brokers)

The SuperTrend MTF indicator is an excellent trend tracking indicator . It can not only display SuperTrend trends within the timeframe of the chart, but also set up to display SuperTrend trends for larger time frames simultaneously . This will be beneficial for grasping trends at a larger time scale and predicting future trends . At the same time, the price of the trend line can also be displayed at a glance, making it easy to observe.
Input parameters :
ATR period used at chart timeframe

This indicator shows the engulfing pattern, which is the most direct manifestation of capital flow. Engulfing Pattern is a common price reversal pattern in technical analysis, which usually appears at the end of a price trend or at key support and resistance levels. It can be divided into two types: Bullish Engulfing Pattern and Bearish Engulfing Pattern. Bullish Engulfing Pattern feature: Previous K-line: This is the negative line of a small entity (the opening price is higher than the closing
Узнайте, как легко и просто купить торгового робота в MetaTrader AppStore - магазине приложений для платформы MetaTrader.
Платежная система MQL5.community позволяет проводить оплату с помощью PayPal, банковских карт и популярных платежных систем. Кроме того, настоятельно рекомендуем протестировать торгового робота перед покупкой, чтобы получить более полное представление о нем.
Вы упускаете торговые возможности:
- Бесплатные приложения для трейдинга
- 8 000+ сигналов для копирования
- Экономические новости для анализа финансовых рынков
Регистрация
Вход
Если у вас нет учетной записи, зарегистрируйтесь
Для авторизации и пользования сайтом MQL5.com необходимо разрешить использование файлов Сookie.
Пожалуйста, включите в вашем браузере данную настройку, иначе вы не сможете авторизоваться.