Смотри обучающее видео по маркету на YouTube
Как купить торгового робота или индикатор
Запусти робота на
виртуальном хостинге
виртуальном хостинге
Протестируй индикатор/робота перед покупкой
Хочешь зарабатывать в Маркете?
Как подать продукт, чтобы его покупали
Торговые роботы и индикаторы для MetaTrader 5 - 52

Do you believe that financial markets and celestial bodies operate in separate realms? Our indicator begs to differ! Based on the innovative theory of William Gann, which emphasizes the influence of celestial planet movements on financial market dynamics, we present to you the "Gann Planetary Lines Indicator". Features of the Indicator : Precision : Accurate projection of the 360 degrees of planetary orbits onto price charts. Advanced Customization : Ability to display or hide any planet line,
Buy and Sell Grid is an expert advisor that uses mechanical strategy to trade on any timeframe and any currency pair. BUY and SELL GRID EA lets you choose between three types of grid trading strategies whether you want to trade sideways, uptrend or downtrend market. To make things easier for our users, we developed a interactive graphical panel that shows you all relevant information about EA inputs and your account.
STRATEGY Grid strategy is pure mechanical strategy, this EA has three types

Этот продукт позволит Вам выгодно приобреcти и использовать два самых популярных продукта для анализа объемов заявок и сделок на биржевых рынках: Actual Depth of Market Chart Actual Tick Footprint Volume Chart Данный продукт вобрал в себя всю мощь каждого отдельного индикатора и оформлен в виде одного файла. Функционал продукта Actual COMBO Depth of Market AND Tick Volume Chart полностью идентичен оригинальным индикаторам. Вы оцените удобство объединения этих двух продуктов в один супер-индикато

Скрипт для закрытия позиций Если Вам необходимо быстро закрыть несколько позиций, то этот скрипт избавит Вас от рутинных действий! Входные параметры скрипт не запрашивает. Разрешите авто-торговлю перед запуском скрипта. Использование:
Запустите скрипт на графике. Если Вам необходимо указать максимальное отклонение или количество попыток для закрытия, то используйте скрипт с входными параметрами https://www.mql5.com/ru/market/product/625 Версию для MetaTrader 4 можно скачать здесь: https://www.
FREE

Gann 9+ Indicator Introduction The "Gann Matrix Chart" is the most simple and clear technical analysis in Gann theory, which is the calculation tool that Gann has always been committed to using. It is the essence of Gann's whole life. The Gann 9+ indicator uses the matrix chart to find the future high or low points of stocks or futures. Indicator Input: The base and step size can be set as 1 by default; When the multiple is -1, the multiple will be automatically obtained, or it can be filled in

EquityProtect provides hidden StopLoss, TakeProfit or TrailingStop based on the account equity. All orders of all symbols can be closed or just the chosen currency and/or just buys or sells or pending orders deleted. EquityProtect closes all or just defined orders when the account equity falls under or rises over a certain level. Besides EquityProtect can use the account equity as trailing stop. A comment in the chart shows the equity where the robot will react. An Alert can be activated and ope

Introducing the "Cybercycle Trend" Forex Oscillator, a powerful technical indicator designed to enhance your trading experience in the foreign exchange market. This innovative tool utilizes advanced algorithms to identify and analyze market trends, providing you with valuable insights and helping you make informed trading decisions.
The Cybercycle Trend Forex Oscillator is specifically designed to detect and measure cyclical price movements in the forex market. By incorporating this oscillato
FREE

Внимание!!! Не пытайтесь протестировать советник в Тестере МТ4 , - это просто невозможно, поскольку советник открывает позиции по разным 27 инструментам 8 таймфрейме . Тестер же способен проводить тест только по одной паре. Мультивалютный тестер возможно только в МТ5. Инструкция по запуску мультивалютного тестер а в МТ5: https://youtu.be/WrQQwMQclrY Принцип работы EA:
1. Используются основная стратегия по пробою локальных экстремумов. 2. Используются дополнительный алгоритм для контроля у

Create and trade timeframes in seconds. The bar time duration is freely adjustable from 1 second and up. The chart is accurately constructed using real ticks from the broker's server. Main characteristics The indicator is an overlay on the main chart, making it possible to utilize one-click trading and on-chart order manipulation. History calculated using real tick data. Built-in technical studies: 4 moving averages (Simple, Exponential, Smooth, Linear-weighted, Volume-weighted using tick or rea

Switch Tray is a shortcut tray tool for commonly used trading pairs provided to traders. It can be placed at the bottom of the chart, and commonly used trading pairs can be set by themselves. 1. You can set the shortcut switch button for your commonly used trading pairs. The default is [EURUSD/GBPUSD/XAUUSD/USDJPY/USDCHF/USDCNH]. / slash is the separator. 2. The button of each trading pair is also equipped with the number of open positions of a certain trading pair. 3. Multi-cycle quick switchi
FREE
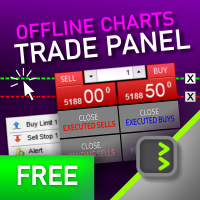
Это панель, которая кажется распространенной, однако она выходит далеко за пределы кнопок дополнительных кнопок для закрытия нескольких ордеров, она важна для тех, кто использует автономные генераторы графиков для Renko, Range, Ticks и т. П., Поскольку в Metatrader 5 вы не можете вручную обрабатывать ордера на графике, которая не является родной для платформы. «TRADE PANEL» выполняет заказы и выставляет отложенные ордера, предлагая те же ресурсы немедленного действия, которые доступны в обы
FREE

Индикатор предназначен для того, чтобы вовремя закрывать позиции по рынку.
Например: досрочно фиксировать прибыль, если цена не достигла TakeProfit, а рынок разворачивается.
Индикатор анализирует импульс, а не тренд. О тренде никакой информации он не дает.
Индикатор хорошо подходит для поиска дивергенции.
Индикатор Ershov 38 Parrots динамически подстраивается под рынок и выявляет импульсы движения цены средней и высокой амплитуды. На мелкие скачки цены почти не реагирует.
Принципиальное о

Highly configurable CCI indicator. Features: Highly customizable alert functions (at levels, crosses, direction changes via email, push, sound, popup) Multi timeframe ability Color customization (at levels, crosses, direction changes) Linear interpolation and histogram mode options Works on strategy tester in multi timeframe mode (at weekend without ticks also) Adjustable Levels Parameters:
CCI Timeframe: You can set the current or a higher timeframes for CCI . CCI Bar Shift: you can set
FREE

Скрипт VR Orders History предназначен для выгрузки отчета о торговле в файл формата csv. Этот формат предназначен для проведения дополнительного анализа истории торговли в программах типа EXCEL, Openoffice и Libreoffice. Благодаря скрипту трейдеру теперь намного проще анализировать свою торговую историю. Программа облегчает анализ торговой истории для терминала MetaTrader 5. Трейдер видит структурированную торговлю. Весь отчет строиться по принципу: Позиция > Ордер на основании которого была отк
FREE

В этом советнике реализованы функции: Начать торговлю, Завершить торговлю, Закрыть ордер(Время), Выставить отложенный ордер(Время), Трейлинг-стоп (автоматически по стратегии), возможность отключения торговли, дневной диапазон (стратегия), стоп-лосс за день (риск-менеджмент), Стоп-лосс (управление рисками), тейк-профит (мани-менеджмент), отслеживание стопа и отслеживание шага (стратегия), Риск на заказ (управление рисками) и многое другое!
Настраиваемые параметры: На свой страх и риск!! Исполь
FREE

This is diamond!
Diamond Pattern is based on Read The Market(RTM) concepts. The purpose of this model is to face the big players of the market (financial institutions and banks), As you know in financial markets, big traders try to fool small traders, but RTM prevent traders from getting trapped. This style is formed in terms of price candles and presented according to market supply and demand areas and no price oscillator is used in it. RTM concepts are very suitable for all kinds of inves

Утилита представляет собой чек лист, где Вы можете написать все правила вашей торговой системы и держать его на графике перед глазами. Как исполняется какое то правило, отмечайте его галочкой. С права от каждого правила можно прописать "силу"(процент) правила. И если напротив правила стоит галочка, то все "силы" суммируются в строке "Total". Для удобства визуального восприятия можно настроить цвет отображения строки"Total" Параметры панели:
Title Надпись на заголовке панели
Number of rules Кол
FREE

Индикатор основан на стандартном индикаторе объемов Volumes. Он рассчитывает средний объем на основе выбранных последних N баров, и если значение объема превышает указанное среднее значение в %, цвет индикатора изменится. Индикатор отображается в отдельном окне.
Входные параметры Bars used to calculate the average volume - количество баров для расчета среднего объема. Threshold (in %) for changing the color of the Bar - порог в %, при котором цвет бара изменится.
FREE
Unlock Your Trading Potential with Our Risk Management Tool! Revolutionize your trading experience with our game-changing solution. Designed for traders who prioritize precision and control, our Risk Management Tool lets you effortlessly calculate the perfect lot size or volume, ensuring confident trades even in volatile markets. Seamless Trade Execution : Input your stop loss and risk level, and let our tool handle the rest. No more manual calculations – just efficient trading. Optimal Risk-Rew
FREE

MT5 RSI Experiment: This indicator leverages the Relative Strength Index (RSI) and floating levels to pinpoint potential buy and sell signals.
The code uses enums for prices and RSI calculation methods. These enums define indicator parameters.
Input variables include RSI period, price type for RSI calculation, smoothing method, and look-back period with levels for floating levels.
Index buffers store RSI fill, RSI up line, RSI middle line, RSI down line, and trend line data.
For each ba
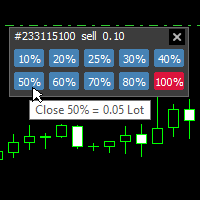
With this tool, you can easily and quickly close part of the trade. Click near the trade to display the closing panel. There are ten preset values for partial closing, but you can set your own values. You can also resize the panel according to Windows settings (125%, 150% ...) See the animation below for how it works. **********************************************************
Note: This tool does not work in the tester.

This pass-band oscillator seeks to pass-band out both high and low frequencies from market data to eliminate wiggles from the resultant signal thus significantly reducing lag. This pass-band indicator achieves this by using 2 differenced EMA's of varying periods. (40 and 60). Trigger points for the pass-band oscillator are added with a RMS cyclic envelope over the Signal line. Output of the pass-band waveform is calculated by summing its square over the last 50 bars and taking the square root of

The new version of MirrorSoftware 2021 has been completely rewriten and optimized.
This version requires to be loaded only on a single chart because it can detect all actions on every symbol and not only the actions of symbol where it is loaded.
Even the graphics and the configuration mode have been completely redesigned. The MirrorSoftware is composed of two components (all components are required to work): MirrorController (free indicator): This component must be loaded into the MAST
FREE

The Netsrac Correlation Trade Indicator (NCTI) was created to trade correlations between different assets. NCTI offers five different strategies to do this. Five different correlation trading strategies with two or three assets Fast access your assets with one click via asset buttons Your profit/loss at a glance Configurable alerts via screen or mobile You can use the indicator with every timeframe. Higher timeframes give fewer but better signals. If you have some questions or suggestions - plea
FREE
This is a script based tool that informs the swap from all the currency pairs (gold and silver too). It is possible to highlight pairs with a specific currency and whether the swap is positive or negative. In addition it is possible to complement the name of the symbols depending on the broker. The informations are showed in the Experts tab of the Toolbox (Ctrl+T). If you have any doubt or suggestion, please, contact us. Enjoy!
FREE

For those Price Action traders who love to trade strong Price points, like today's Opening Price (or even yesterday's Price), here is an indicator to ease the identification of those values, drawn directly on your chart! Opening Price will automatically draw a line showing you this point for you, AND, if you like any OPENing price in the past, not just today's price. A must-have in your Price Action toolbox!
SETTINGS
How many past days do you want to be drawn? Do you want to draw the current
FREE

Эта система хороша для выявления краткосрочных разворотов на рынке. Он основан на исследовании структуры рынка с помощью машинного обучения и может быть отличным инструментом для сканирования рынка или прямых сделок. При всем при этом не существует 100%-ного коэффициента выигрыша, но этот показатель иногда всегда точен.
Когда он думает, что произойдет разворот, он окрасит свечу в определенный цвет, нарисует стрелку, а затем предупредит вас о том, покупать или продавать предстоящую свечу.
Background
This product is a practical tool to check the market based on the cycle theory . When you need to use multi cycle charts to analyze a symbol , manually adding charts with different cycles and applying templates is a very large cost. This product can help you quickly add multi cycle charts of one or more symbols, and uniformly apply the same template . After adding, you can drag the charts to the sub screen, which is suitable for multi screen analysis. Usage Method Apply this script t
FREE

This indicator is designed based on the Moving Origin indicator
When the moving origin indicator breaks the price, this indicator gives a signal
It is useful for better viewing of signals and analysis on them
Attributes: Can be used in all symbols Can be used in all time frames Too many signals Simple and quick settings Easy way to work
Settings: period: like moving average settings alarmShow: If you want to receive an alert in Metatrader after receiving the signal, enable this setting
a
FREE

Индикатор сочетает разворотные паттерны "Двойное дно" и "Двойная вершина" с индикатором определения расхождения RSI.
Особенности С легкостью определяет сильные сигналы разворота. Позволяет использовать паттерны "Двойное дно" и "Двойная вершина" и сигналы расхождения RSI вместе или по отдельности. Получайте уведомления по электронной почте и/или на мобильное устройство при обнаружении сигнала. Можно использовать пользовательские цвета. Индикатор не перерисовывается. Можно использовать в составе

Этот советник использует индикатор Course Crystal для принятия торговых решений. Вот ключевые моменты: Индикатор Course Crystal : Этот индикатор помогает определить направление тренда на рынке. Он анализирует движение цен и отображает результаты на графике в виде цветных областей. Синий цвет указывает на возможность покупки, а красный — на возможность продажи. Торговая система : Советник анализирует текущие и прошлые данные цен, чтобы определить общее направление тренда. Если данные указыва

This EA uses two moving averages one slow and one fast, when ever they cross it checks if the RSI value is greater or lesser than 50 depending on the signal given by the Moving averages. After that it checks if the Stochastics lines are going up or down and not in the Over Bought or Over sold zone. so in total it uses an RSI, 2 Moving Averages ,Stochastics and an ATR to try to evade stop hunting.Also has a trailing function to hold the profits if price moves X pips tested on a 5 min time frame
FREE

Opening Range Indicator
Idea Toby Crabel introduced this way of trading in the ealy ninties in his book "Day Trading with Short Term Price Patterns and Opening Range Breakout". In simple terms this means to trade the brekouts from the limits of the first trading hour with the stop loss at the opposite side. I.e. if the first hourly candle meausres 40 points (Crabel calls this the "stretch") you set the stop loss at breakout level minus 40 points and the take profit at the breakout level plus
FREE

Moving average indicator to work with the F12 Replay simulation and replay tool.
In this way, the F12 Replay tool now supports the moving average indicator.
F12 Replay: https://www.mql5.com/pt/market/product/38313
This is a product developed by Renato Fiche Junior and available to all MetaTrader 5 users!
Partners: "Águia Traders" team ( Eagle Traders ) by Larissa Sihle #aguiatraders #larissasihle
Input Parameters
Period Shift Method
FREE

[Translated with ChatGPT] Не стесняйтесь скачать это абсолютно бесплатно, если вам нравится. У меня есть здесь менеджер скальпинга: https://www.mql5.com/en/market/product/101312
[Не стесняйтесь предложить улучшения, которые могут быть внедрены. Этот советник навсегда останется бесплатным.]
Таймфрейм: от 5 минут и выше (на 1-минутном таймфрейме свечи очень короткие, стоп-лосс не может быть установлен)
Валюты: Мультивалютный
Настройки:
Объем лота: объем торговли для советника
Продолжи
FREE

Points of Inertia - мощный инструмент обнаружения критических точек ценового движения, основанный на идеи вычисления инерции ценовых колебаний. _________________________________ Как пользоваться сигналами индикатора: Индикатор формирует сигнал после появления нового ценового бара. Использовать сформированный сигнал рекомендуется после пробития ценой критической точки в указанном направлении. Индикатор не перерисовывает свои сигналы. _________________________________ Параметры индикатора предла
FREE

1. Эта система является локальной документарной системой, то есть запускающая и принимающая стороны должны работать с одним и тем же компьютером, так как номер счета MT4 / 5 может быть зарегистрирован на нескольких компьютерах одновременно, так что нужно только посылать клиенту пароль на один счет. Локальная документация очень быстрая и стабильная, поскольку она не связана с интернетом.
2. в настоящее время для запуска, загрузка в график может нормально работать, а также установить приемны
FREE

Своеобразное представление индикатора Average Directional Movement Index. Индикатор написан по просьбе трейдера и для освоения программирования индикаторов на языке программирования mql5. Линия показывает то же самое, что и стандартный индикатор Индекс Среднего Направления Движения (Average Directional Movement Index, ADX); Гистограмма вверх показывает разницу +DI и -DI, когда +DI выше -DI; Гистограмма вниз показывает разницу +DI и -DI, когда +DI ниже -DI.
FREE

MetaCOT 2 - набор индикаторов и специализированных утилит для анализа отчетов американской коммиссии по товарным рынкам CFTC (U.S. Commodity Futures Trading Commission). Благодаря отчетам, издаваемым комиссией, можно анализировать размер и направление позиций крупных участников рынка, что выводит точность долгосрочного прогнозирования цены на новый, более качественный уровень, недоступный большинству трейдеров. Данные индикаторы, относящиеся к фундаментальному анализу, также можно использовать,
FREE

Этот робот позволяет фиксировать прибыль, закрывая процент позиции и изменяя стоп-лосс, как только цена достигает триггера.
Параметры
процент: процент лотов, которые должны быть закрыты при безубыточности буфер: расстояние между ценой входа и новым стоп-лоссом триггер: расстояние в пунктах для активации безубыточности Lots: объем, который вы используете для открытия позиции. Пожалуйста, оставьте отзыв
FREE

SHADOW vous donne des signaux d'achat et de vente solides avec un risque minimal. Vous pouvez voir dans quelle direction le prix évolue et la force du mouvement. Shadow filtre le bruit du marché et améliore radicalement les performances des traders.
Points forts: Détection visuelle efficace des tendances. Bruit du marché des filtres Ne repeint ni ne recalcule jamais. Signaux strictement sur "fermeture du bar". Fonctionne dans tous les symboles. Pop-up intégré, e-mail, notification push e
FREE

Phi Cubic Fractals Pack1A with FuTuRe PACK 1A é uma melhoria sobre o Pack 1 que inclui a possibilidade de selecionar as linhas LINE 4/8/17/34/72/144/305/610 individualmente. Este produto contém os indicadores do PACK 1A (Lines + LineSAR + Channels + BTL + Ladder) + MODO FUTURO Phi Lines - medias moveis especiais, semelhantes às MIMAs do Phicube, capazes de indicar com muita clareza tanto a tendencia como a consolidação; Phi LineSAR - apaga ou destaca as Phi Lines para mostrar apenas as linha

A supply and demand indicator designed with a minimalist trading strategy based on the nature of the market. Indicator type: Price Action indicator The Bull zone is a strong support area, and the Bear zone is a strong resistance area. When a Bull zone was breakout, it becomes the "base" of the Bears and vice versa. When the price meets these areas, there is a high probability that the price will reversal , so we call them Obstacles. It is a suitable indicator for traders interested in manual pr

Индикатор рисует нормальный график, раскрашивая его в цвета, основанные на ценах, вычисленных по алгоритму индикатора Heiken Ashi. То есть, форма свечей не меняется. По сути, это тот же Heiken Ashi, который не искажает ценовой график.
Дальше будет рисунок кота, потому что больше об индикаторе писать нечего.
.
FREE

A ideia do indicador é mudar de cores assim que o candle viole a banda; Caso o candle viole a banda superior, pinta o candle de vermelho, Caso o candle viole a banda inferior , pinta o candle de verde, Se o candle passar em algum momento pela média, ele assume uma cor acinzentada; Os candles que não passem pela média, nem violem a banda, apresentarão cor verde fraca, se for de alta e cor vermelha fraca se for de baixa. Projeto concebido no canal Aprenda a programar, keltner cores.
FREE

Простой тиковый индикатор цены Bid и Ask. Разделитель периода (1 минута) отображен в виде гистограммы. Параметры Show Bid Line - включить/выключить отображение лини Bid; Show Ask Line - включить/выключить отображение лини Ask; Show Labels - включить/выключить отображение последних значений цены.
FREE

Volume Cross Over is an indicator that measure positive and negative volume flow in a financial instrument, such as a stock, commodity, or index. It is base on the idea of On-Balance Volume developed by Joseph Granville. However instead of trending lines, this indicator shows volume cross over. When the closing price of an asset is higher than the previous closing price, then the Bull volume is greater than zero and Bear volume is negative. It suggests that buying volume is dominating, and
FREE

This indicator displays the spread with extra options Simple and easy to use and fully customisable: View as Pips or Pipettes Chart symbol can be hidden Text display can be changed Change colour and text styles Add or hide a decimal point Spacing options between inputs Default screen positions Screen position inputs
Pro version includes: Drag and drop box on the screen Add an alert when the spread is too high Alert colours for text and text box changeable
How to use 1. Simply use the defaul
FREE

Индикатор отображает коэффициенты между экстремумами графика. Вы можете указать собственные коэффициенты (например, Фибоначчи).
Параметры Наиболее важные Density - насколько детальным должен быть поиск коэффициентов в экстремумах. Чем выше значение, тем менее детальный поиск, и наоборот. Базовая единица - 1 бар на графике. History - насколько глубоко в истории искать. При -1 индикатор ищет на всех барах истории. Базовая единица - 1 бар на графике. Range - насколько далеко от экстремума следует
FREE
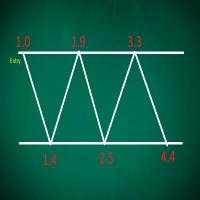
This EA performs with a Hedging strategy by which Buy and Sell signals are from the MACD indicator.... The lot sizes in the input are Custome for you to adjust as you pleased, so you are able to improve your hedging style. Inputs. Close Money- this option is basically the take profit in ($), for example if you set the close money at $20 the EA will automatically close all trades when your overall profit is $20. Nearby Hedge Pips- this basically determine the distance of pips between yo
FREE

MOON 4 TREND COLORS: is a Tren indicator. I s a powerful indicator of TREND for any par and any timeframe. It doesn't requires any additional indicators for the trading setup.The indicator gives clear signals about opening and closing trades, PAINTING THE CANDLES OF COLOR IN FUNCTION OF THE SENSE OF TREND .This Indicator is a unique, high quality and affordable trading tool.
Perfect For New Traders And Expert Traders Low risk entries. For MT5 Only Great For Scalping Great For Swing Trad

DYJ TRADINGVIEW — это многоиндикаторная рейтинговая система, использующая подсчет рейтинговых сигналов и инструменты анализа для поиска возможностей входа на мировые рынки. DYJ TRADINGVIEW имеет 10 встроенных индикаторов для анализа рынка. Анализ на основе индикаторов используется многими трейдерами, чтобы помочь им принять решение о том, какие сделки заключать и где входить и выходить из них. Мы используем несколько разных типов, которые могут хорошо дополнять друг друга. Используйте нас, чтобы

This is an OLD indicator which was rather efficient to be paired with MA Cross, Bollinger Bands, Dochian Channel and many other strategies and this provides you with market change of BEAR and BULL trends. Since there isn't much listed in MT5 Market, I would like to share my very own indicator for your usage. Please feel free to comment or criticize for better and improvement of the indicator listed.
FREE

Fundamentação teórica Rate of Change - taxa de mudança (ROC) O ROC é um oscilador que flutua acima e abaixo de uma linha de zero, medindo a variação percentual de preços ao longo de determinado período. O ROC de 20 períodos mede a variação percentual de preços ao longo de 20 períodos, quanto maior a diferença entre o preço atual e o de 20 períodos atrás, maior o valor do ROC. Quando o indicador está acima de zero, a variação percentual é positiva indicando tendência bullish, se o indicador está
FREE

Назначение IFM IFM упрощает работу с линиями и другими инструментами Фибоначчи в MetaTrader 5. Индикатор позволяет редактировать все настройки без необходимости заходить в настройки правым кликом мыши, предоставляя быстрый и простой способ управления объектами на вашем графике.
Входные параметры Font size - размер шрифта панели IFM. Параметр необходим при смене размера шрифта в настройках Windows Description of the Fibo levels - описание уровней Фибоначчи (переменные: F - уровень, %$ - цена) п

Indicator that show candlestick bars with an different sampling method than time fixed. Real time data is sourced to the indicator and it may be used as substitute of the default graph. Each bar is formed when a predefined amount of ticks is received, showing in the graph the OHLC of this clusteri of ticks. The input variable is the amount of ticks of each bar. It's a different approach of sampling, the amount of bars is proportional to the amount of negotiations insted of a sample in a fixed am
FREE

Order Entry - Probably the easiest way to enter an order If you like this perhaps you might consider buying the pro version https://www.mql5.com/en/market/product/64353?source=Site+Profile+Seller An aid for entering orders. Features: * Drag & drop tool to adjust price, stop loss and take profit levels. * Calculates lot sizes automatically based on risk entered, currency pair and stop loss / price levels.
Description It enables you to visually enter a trade's price, stop loss and take profit
FREE
A Fibonacci Panel tool to facilitate your trading with Fibonacci indicator. Simple and easy to use! Magnificent Design (Adjustable) Sound Effects (This will make trading much more fun) Five Fibonacci Levels (freehand movable) Acoustic and graphic signals (adjustable for each level) Integrated narrow trading panel also with risk and money management If you need silence while trading, you can deactivate the sounds in the settings.
Parameter
Language English Magic number Commentary (for all po
FREE

Что такое RSI? Индикатор RSI (Relative Strength Index, индекс относительной силы) — это индикатор, который измеряет соотношение восходящих и нисходящих движений. Расчет ведётся таким образом, что индекс выражается в диапазоне от 0 до 100. Как понять RSI?
Если значение RSI находится равно 70 и больше, считается, что инструмент находится в состоянии перекупленности (ситуация, когда цены выросли выше, нежели того ожидал рынок). Значение RSI на уровне 30 и ниже считается сигналом о том, что инст
FREE

Swiss Holy Grail Indicator Motivation and functioning The HolyGrail indicator serves to optimize an entry. At that very moment I caught myself, that I went short in an uptrend, so I got into a trade in an anti-cyclical way. Or I have entered into a much too mature trend. This indicator should prevent such errors: One should always be aware of whether it is pro- or anticyclic entry, and one must always know about the maturity of the trend. Don't enter an old trend. Linda Raschke advises to buy th
FREE

Индекс товарного канала (Commodity Channel Index, CCI) вычисляет отклонение типичной цены на каждом баре от средней цены за определенный период времени. Умножение среднего отклонения на 0,015 облегчает нормализацию, что делает все отклонения ниже первого стандартного отклонения меньше, чем -100, и все отклонения выше первого стандартного отклонения более чем на 100. Это адаптированная версия на основе индикатора, описанного Джоном Эйлерсом в книге "Rocket Science for Traders". Индикатор использу
FREE

Here we have the Start Midas Fibo Bands , I confess that it is an indicator that excited me enough to operate because I was able to find more defined rules. Well, the indicator has the functions of the other indicators of the Start line , which is a possibility to plot several Midas on the screen, you can move the anchor point using keyboard shortcuts and use the legend to differentiate one anchor from another. The rules that I have analyzed for my possible setup are recommended to the entry, st
Данная панель из разряда: "Все в одном". Возможность контролировать одновременно: до 3-х символов; до 6-ти периодов; до 31-ти популярных сигналов. Возможность смотреть сумму по всем сигналам с учетом веса сигнала Версия для MetaTrader 4: https://www.mql5.com/ru/market/product/27880 Версия для MetaTrader 5: https://www.mql5.com/ru/market/product/27830
Параметры NUM_BAR - номер бара на котором происходит работа (для работы только по закрытым барам параметр > 0). timeframe_1....timeframe_6 - пара
FREE

Investment Castle News Indicator will plot vertical lines before the news on the chart and categorized in three different colors in accordance with the news importance. You can choose to limit the news to the current chosen symbol or show all future news on the same chart. High impact news is marked in Red lines be default. Medium impact news is marked in Orange lines be default. Low impact news is marked in Yellow lines be default.
FREE

Order Book, известный также как Market Book, глубина рынка, стакан цен, Level 2, - это предоставляемая брокером динамически обновляемая таблица с данными по текущим объемам торговых заявок на покупку и продажу для различных уровней цен вблизи Bid и Ask конкретного финансового инструмента. MetaTrader 5 предоставляет возможность трансляции стакана цен , но только в реальном времени. Данный эксперт OrderBook History Playback позволяет воспроизводить события стакана на истории из предварительно сохр
FREE

This EA automatically closes all Open Trades and Pending Orders at your specified Net Profit or Net Loss. The TP and SL for a single trade can easily be set in Meta Trader, on individual basis and on hitting that TP or SL, the trade is automatically closed. However, if you have multiple trades and you want to set a Net TP and Net SL (in terms of profit & loss) for all of them, then Meta Trader cannot help you. Here comes this EA “Net TP Net SL Setter” using which you can set a Net TP and Net SL
FREE
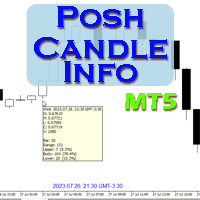
Show candle info with: Time in selected timezone Bar number Candle range points Upper wick points and percentage Body points and percentage Lower wick points and percentage Mark large/small candle body with customizable line. Settings group: Broker and local timezone. Lookback bars for candle marking. Large candle body Small candle body Date and time info with auto position or custom the x and y coordinate.
FREE

• IMPORTANT! Test this EA on a DEMO account carefully before using it in the real market. • This Trade Manager (EA) works only on MetaTrader5 . There will NOT be a MetaTrader4 version! • Updates to this EA will be made solely at my own discretion. I do NOT take feature requests. • I have tested/used this EA only for trading DAX CFDs (DE40, GER40) on various brokers. • I don’t know if it works as expected with FX, Metals, Oil, Crypto etc. or on any broker
FREE
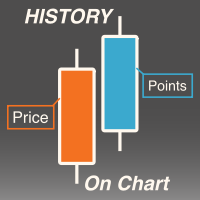
Description This is a utility tool for MT5 reminding traders of all the entry points by highlighting trading history. For those who just started to learn trading, one of the most efficient tips to improve their trading skill is to look back their own trading history. However, trade history arrow shown on MT5 chart is simply too small to find out, which will keep traders away from reviewing their trade, especially stupid mistakes like overtrading. By clearly showing their trade history and face i
FREE

Ladies and gentlemen, let me explain a simple tool that can help adjust stop-loss positions based on historical data and customized distance. Tool Name: Trailing Stop Pro Description: A trailing stop is a risk management tool commonly used in trading. It allows traders to set a dynamic stop-loss level that automatically adjusts as the price moves in their favor. Here’s how it works: Initial Stop-Loss: When you enter a trade, you set an initial stop-loss level. This is the price at which you’re
FREE
А знаете ли вы, почему MetaTrader Market - лучшее место для продажи торговых стратегий и технических индикаторов? Разработчику у нас не нужно тратить время и силы на рекламу, защиту программ и расчеты с покупателями. Всё это уже сделано.
Вы упускаете торговые возможности:
- Бесплатные приложения для трейдинга
- 8 000+ сигналов для копирования
- Экономические новости для анализа финансовых рынков
Регистрация
Вход
Если у вас нет учетной записи, зарегистрируйтесь
Для авторизации и пользования сайтом MQL5.com необходимо разрешить использование файлов Сookie.
Пожалуйста, включите в вашем браузере данную настройку, иначе вы не сможете авторизоваться.